. 2020 Jul 28;4(14):3443-3456.
doi: 10.1182/bloodadvances.2020001565.

Rapidly expanded partially HLA DRB1-matched fungus-specific T cells mediate in vitro and in vivo antifungal activity

Affiliations

Rapidly expanded partially HLA DRB1-matched fungus-specific T cells mediate in vitro and in vivo antifungal activity

Gloria Castellano-González et al. Blood Adv. .

Abstract

Invasive fungal infections are a major cause of disease and death in immunocompromised hosts, including patients undergoing allogeneic hematopoietic stem cell transplant (HSCT). Recovery of adaptive immunity after HSCT correlates strongly with recovery from fungal infection. Using initial selection of lymphocytes expressing the activation marker CD137 after fungal stimulation, we rapidly expanded a population of mainly CD4+ T cells with potent antifungal characteristics, including production of tumor necrosis factor α, interferon γ, interleukin-17, and granulocyte-macrophage colony stimulating factor. Cells were manufactured using a fully good manufacturing practice-compliant process. In vitro, the T cells responded to fungal antigens presented on fully and partially HLA-DRB1 antigen-matched presenting cells, including when the single common DRB1 antigen was allelically mismatched. Administration of antifungal T cells lead to reduction in the severity of pulmonary and cerebral infection in an experimental mouse model of Aspergillus. These data support the establishment of a bank of cryopreserved fungus-specific T cells using normal donors with common HLA DRB1 molecules and testing of partially HLA-matched third-party donor fungus-specific T cells as a potential therapeutic in patients with invasive fungal infection after HSCT.


Conflict of interest statement

Conflict-of-interest disclosure: The authors declare no competing financial interests.

Figures

None
Graphical abstract
Figure 1.
Figure 1.
Method to generate clinical grade fungus-specific T cells targeting different fungal species. (A) Diagram of the method used for selection and enrichment of fungus-specific T cells from stem cell apheresis product. Representative flow cytometric analysis of the CD137-selected product after activation with fungal lysate (showing the content of CD3+CD137+ and CD4+ or CD8+ from this population). (B) Total cell number of fungus-specific T cells selected using different fungal lysates at the start of culture (CD137+-selected cells, day 0) and after expansion (end of culture, day 11). (C) Total cell number of T cells (FUN T cells) at the start of culture, after expansion, and after restimulation for 7 or 8 days with irradiated PBMCs pulsed with A terreus and C krusei lysates. Results are means of 3 to 5 experiments (±SEM) and shown total cell count. (D) TNF-α expression in fungus-specific T cells selected and expanded using different fungal lysates (shown on the top x-axis) after 6-hour coculture with DCs pulsed with a range of fungal species (shown on the y-axis) analyzed by flow cytometry. Results are expressed in terms of heat map in which each square represents the mean value percentage of CD4+ TNF-α+ cells from 3 to 6 experiments. Results are expressed in terms of heat map in which each square represents the mean value percentage of the indicated marker from 3 to 6 experiments. (E) Representative flow cytometric analysis showing TNF-α expression determined by flow cytometry in panfungal T cells after 6-hour coculture with DCs pulsed with individual fungal lysates, a mix of all fungal lysates, or pp65 cytomegalovirus (CMV) pepmix as irrelevant control antigen. Results are means of 6 experiments and shown as percentage of CD4+ T cells (*P ≤ .001 DC control vs fungal lysate–pulsed DC; paired, 2-tailed Student t test). AT, A terreus; CK, C krusei; CTR, control; RO, R oryzae.
Figure 2.
Figure 2.
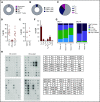
Characterization of panfungal T-cell product. Donor HPCs were stimulated with lysates of A terreus and C krusei and expanded as described in “Methods.” Average composition or percentage of (A) T cells (CD3+), natural killer (NK) cells (CD3CD56+), natural killer T cells (NKT) (CD3+CD56+), B cells (CD19+), and monocytes (CD14+) of live cells; (B) CD4+ T cells and CD8+ T cells of CD3+ T cells; (C) T central memory (CD45RA62L+), T terminal effector (CD45RA+62L), T naive (CD45RA+62L+), and T effector memory (CD45RA62L); (D-E) exhaustion marker expression profile of CD4+ T cells (PD-1, Tim-3 and CTLA-4, and CD57 and Lag-3) and (F) the CD4 T helper subtypes TH1 (CCR4CCR6CCR10CXCR3+), TH2 (CCR4+CCR6CXCR3), TH9 (CCR4-CCR6+), TH17 (CCR4+CCR6+CCR10CXCR3), TH22 (CCR4+CCR6+CCR10+), and TH1/TH17 (CCR4CCR6+CXCR3+) was determined at the end of culture by flow cytometry (A-D) or mass cytometry by time of fight (E-F). Results are means of 3 to 11 experiments (±SEM) and shown as percentage of live cells, CD3+ T cells, or CD4+ T cells. (G) Quantification of the TCR-β sequences expression in CD4+CD154+ sorted cells from T-cell products expanded for 11 days or 19 days after 16-hour activation with A fumigatus–pulsed DCs. Results are from 5 experiments and give the proportion of the product made up of the top N clones, where N is the number of clones shown. (H) Immunoblot analysis of cytokines in supernatants of panfungal T cells cultured for 24 hours with noncontrol or fungus-pulsed DCs, shown as representative immunoblot image from 2 experiments (cytokines measured in the blot are described in the tables; upper table refers to top 2 blots, and lower table refers to bottom 2 blots). Relative density measurement corresponds to the relative cytokine expression levels from panfungal T cells cultured with pulsed DCs and control DCs and calculated as follows: X(Ny) = X(y) × P1/P(y), where P1 is the mean signal density of positive control spots on reference array, P(y) is the mean signal density of positive control spots on array “y,” X(y) is the mean signal density for spot “X” on array for sample “y,” and X(Ny) is the normalized signal intensity for spot “X” on array “y” spots on reference array “y.”
Figure 3.
Figure 3.
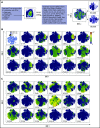
T-cell markers associated with T-cell phenotype, functionality, and response to fungi. (A) Diagram describing gating strategy and t-SNE mapping and analysis workflow for samples shown in B and C. t-SNE plot showing marker expression levels for single parameters (B, activation markers and cytokines; C, phenotype markers) on individual cells of panfungal T-cell products cultured for 6 hours with nonpulsed DCs or fungus-pulsed DCs. Responding fungus-specific T cells correspond to the cell cluster showing higher GM-CSF and TNF-α expression. t-SNE plots are representative of control and pulsed DC-treated panfungal T cells from 3 experiments.
Figure 4.
Figure 4.
Immunophenotype characterization of reactive T cells against fungi. (A) t-SNE plots (described in Figure 3A) for panfungal T cells cultured for 6 hours with nonpulsed DCs (DC control) or fungus-pulsed DCs (DC pulsed). Gates show 3 different populations of cells responding to fungi (these populations were only present in panfungal T cells cultured with fungal pulsed DCs). (B) Percentage of the 3 populations of reactive panfungal T cells after 6-hour coculture with fungal lysate–pulsed DCs analyzed by CyTOF. Results are means of 3 experiments (±SEM) and shown as percentage of CD4+ T cells. (C) Expression of exhaustion and phenotype markers and cytokines (shown on the y-axis) in the 3 different reactive T-cell populations (shown on the x-axis) of panfungal T-cell products after 6-hour coculture with fungal lysate–pulsed DCs and analyzed by CyTOF. Results are expressed in terms of heat map in which each square represents the mean value percentage of CD4+ T cells from 3 experiments. R1, reactive T-cell population 1; R2, reactive T-cell population 2; R2(17), reactive T-cell population 2 (IL-17A+); Tcm, central memory T cells (CD45RA CCR7+); Teff, terminal effector T cells (CD45RA+CCR7); Tem, effector memory T cells (CD45RACCR7); Tn, naive T cells (CD45RA+CCR7+); Treg, regulatory T cells (CD137+CD154).
Figure 5.
Figure 5.
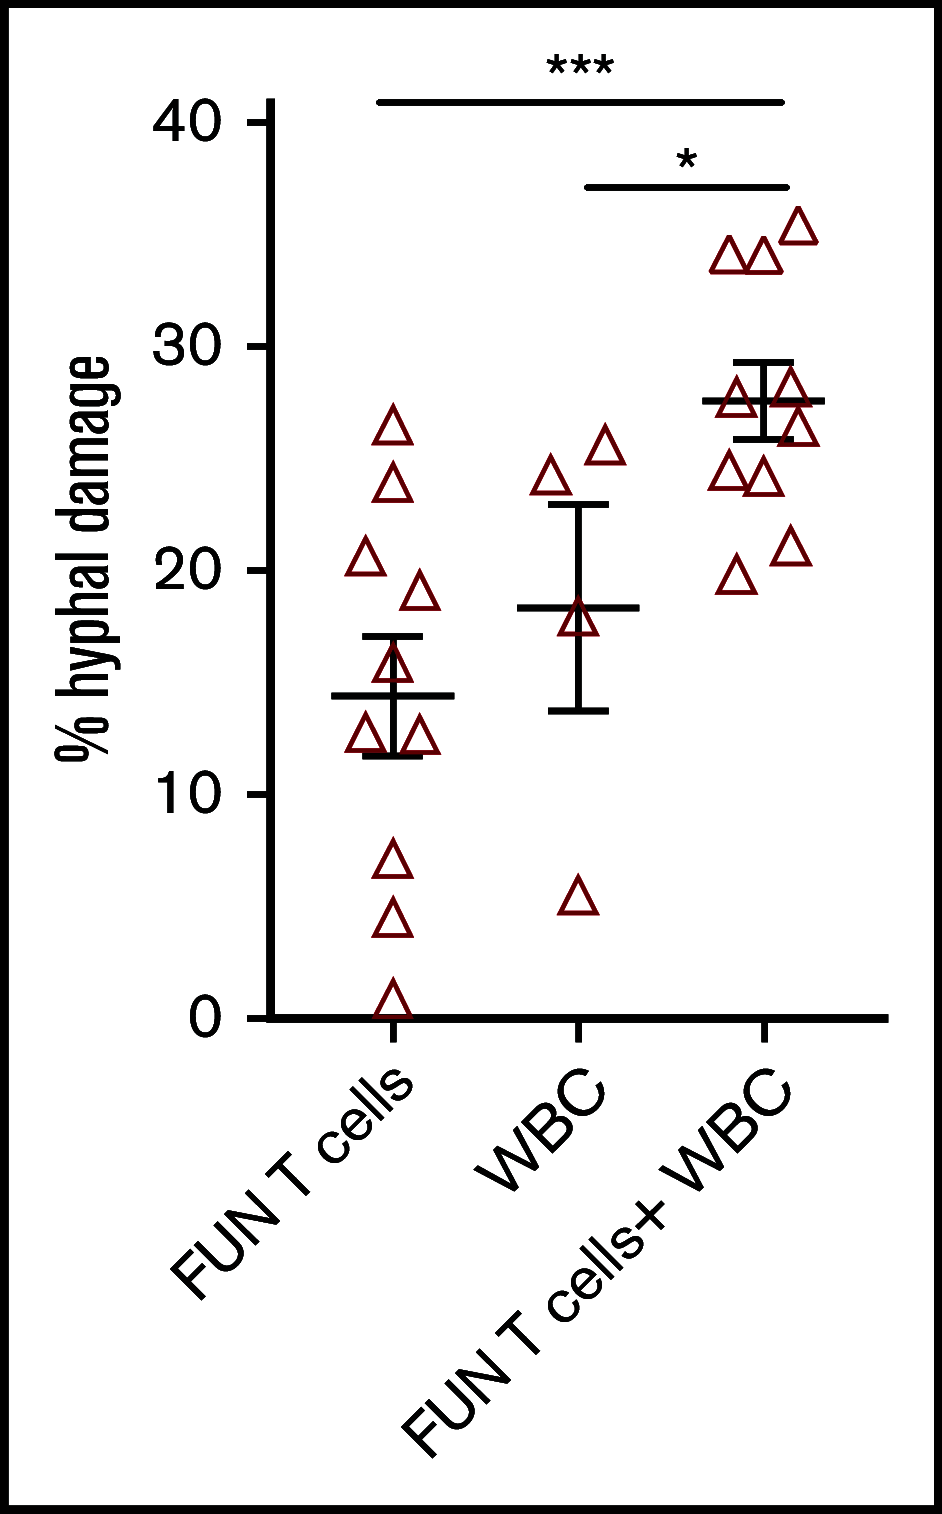
Antihyphal activity of panfungal T cells. Percentage of hyphal damage induced by panfungal T cells, WBCs, and a combination of both after 2-hour incubation with germinated conidia from A fumigatus was assessed using an XTT calorimetric assay. Results are means of 4 experiments (±SEM) and shown as percentage of hyphal damage relative to nontreated hyphae (*P ≤ .05 and ***P ≤ .001 treatment vs none; unpaired, 2-tailed Student t test).
Figure 6.
Figure 6.
Ability of common HLA-DRB1 subtypes to present fungal antigens to antigen- and allelically mismatched panfungal T cells. (A) Flow cytometry analysis of TNF-α expression in panfungal T cells cultured for 6 hours with nonpulsed or fungal lysate–pulsed MoDCs when the DCs presenting fungi antigens share 2 HLA-DRB1 antigens, only 1 HLA-DRB1 antigen, and only 1 HLA-DRB1 antigen but with different allele subtype and neither of the HLA-DRB1 antigens (mismatched) with the panfungal T cells. Results are means of 2 to 4 experiments (±SEM) and shown as percentage of CD4+ T cells. (A) *P ≤ .05 partially matched vs mismatched and allele subtype missmatched vs mismatched; ΦP ≤ .001 matched vs partially matched, partially matched with allele subtype missmatched and missmatched (unpaired, 2-tailed Student t test). (B-F) Flow cytometry analysis of TNF-α expression in panfungal CD4+ T cells with common HLA types (DRB1 01:01, 04:01, 11:01, 13:01, or 15:01) cultured for 6 hours with allelic-mismatched nonpulsed or fungal lysate–pulsed DCs; DCs express (B) HLA-DRB1 01:02; (C) HLA-DRB1 04:03, 04:04, 04:05; (D) HLA-DRB1 11:04; (E) HLA-DRB1 13:02; and (F) HLA-DRB1 15:02. Results are means of 2 to 6 experiments (±SEM) and shown as percentage of CD4+ T cells (**P ≤ .01, *P ≤ .05 DC control vs DC pulsed; paired, 2-tailed Student t test).
Figure 7.
Figure 7.
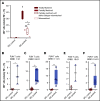
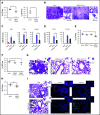
Panfungal T cells protect from infection in NSG mice upon adoptive transfer. (A-I) Recipient mice were humanized with autologous and unrelated HLA DR–matched PBMCs 1 day before intranasal A fumigatus infection (resulting in low [A-D] or high [E-I] fungal burden) followed by the intravenous infusion of 106 panfungal T cells the day after the infection. (A) Colony-forming units (log10 CFU) in lungs and brain, (B) lung histology (Periodic acid–Schiff [PAS]–stained sections; scale bars, 500 and 100 μm [upper insets]; and percentage of polymorphonuclear neutrophils [PMNs] in bronchoalveolar lavage [lower insets]), (C) gene expression, and (D) cytokine and chemokine production at 6 days after infection. (E) Colony-forming units (log10 CFU) in lungs of mice treated with PBMCs alone, panfungal T cells alone, or combination at 6 days after infection. (F) Colony-forming units (log10 CFU) in lungs and (G) lung histology (PAS-stained sections; scale bars, 100 μm; and percentage of PMNs in bronchoalveolar lavage [upper insets)] at 6 days after infection. (H) Colony-forming units (log10 CFU) in lungs, (I) lung histology (PAS-stained sections; scale bars, 200 μm [left]; and percentage of PMNs in bronchoalveolar lavage [upper insets]) and CD11c+ and CD11b+ cell infiltration, evaluated by immunofluorescence at 14 days after infection (scale bars, 100 μm). Results are the mean ± SD from 3 to 5 mice per group (*P < .05, **P < .01, T cells vs none; 2-way analysis of variance, Bonferroni post-test and Student t test). None, mice that received neither humanizing cells nor T cells.

References

    1. Pagano L, Caira M, Candoni A, et al. . The epidemiology of fungal infections in patients with hematologic malignancies: the SEIFEM-2004 study. Haematologica. 2006;91(8):1068-1075. - PubMed
    1. Kontoyiannis DP, Marr KA, Park BJ, et al. . Prospective surveillance for invasive fungal infections in hematopoietic stem cell transplant recipients, 2001-2006: overview of the Transplant-Associated Infection Surveillance Network (TRANSNET) Database. Clin Infect Dis. 2010;50(8):1091-1100. - PubMed
    1. Sun Y, Meng F, Han M, et al. . Epidemiology, management, and outcome of invasive fungal disease in patients undergoing hematopoietic stem cell transplantation in China: a multicenter prospective observational study. Biol Blood Marrow Transplant. 2015;21(6):1117-1126. - PubMed
    1. Harrison N, Mitterbauer M, Tobudic S, et al. . Incidence and characteristics of invasive fungal diseases in allogeneic hematopoietic stem cell transplant recipients: a retrospective cohort study. BMC Infect Dis. 2015;15(1):584. - PMC - PubMed
    1. Neofytos D, Horn D, Anaissie E, et al. . Epidemiology and outcome of invasive fungal infection in adult hematopoietic stem cell transplant recipients: analysis of Multicenter Prospective Antifungal Therapy (PATH) Alliance registry. Clin Infect Dis. 2009;48(3):265-273. - PubMed

Publication types