. 2020 Jul 28;21(1):308.
doi: 10.1186/s12882-020-01960-0.

Renal expression of cytokines and chemokines in diabetic nephropathy

Affiliations

Renal expression of cytokines and chemokines in diabetic nephropathy

Liliane Silvano Araújo et al. BMC Nephrol. .

Abstract

Background: Diabetic nephropathy (DN) is the leading cause of end-stage renal disease worldwide. Inflammatory mediators have been implicated in the pathogenesis of DN, thus considered an inflammatory disease. However, further studies are required to assess the renal damage caused by the action of these molecules. Therefore, the objective of this study was to analyze the expression of cytokines and chemokines in renal biopsies from patients with DN and to correlate it with interstitial inflammation and decreased renal function.

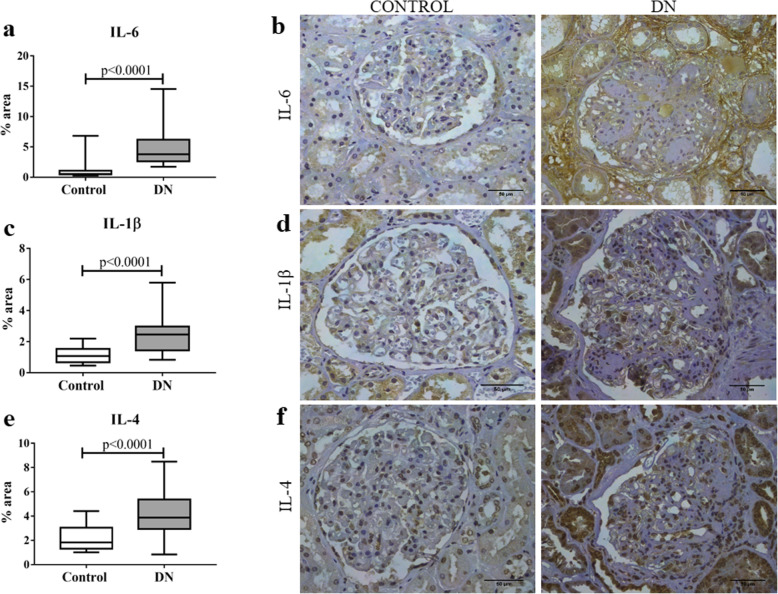
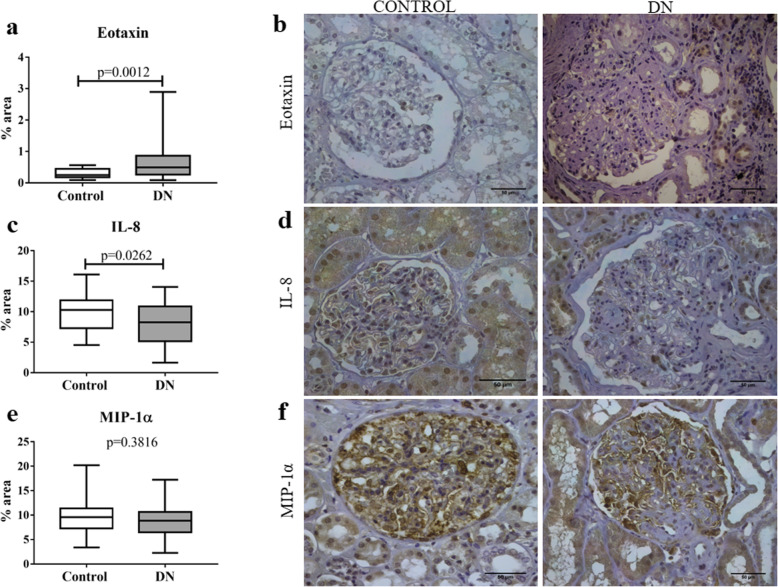
Methods: Forty-four native renal biopsies from patients with DN and 23 control cases were selected. In situ expression of eotaxin, MIP-1α (macrophage inflammatory protein-1α), IL-8 (interleukin-8), IL-4, IL-10, TNF-α (tumor necrosis factor-α), TNFR1 (tumor necrosis factor receptor-1), IL-1β, and IL-6 were evaluated by immunohistochemistry.

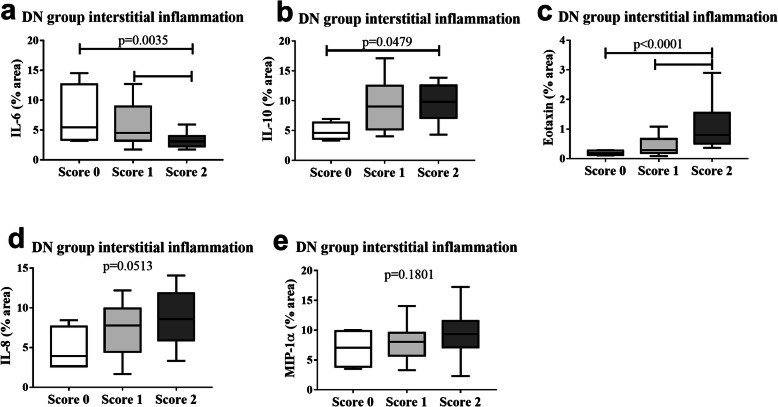
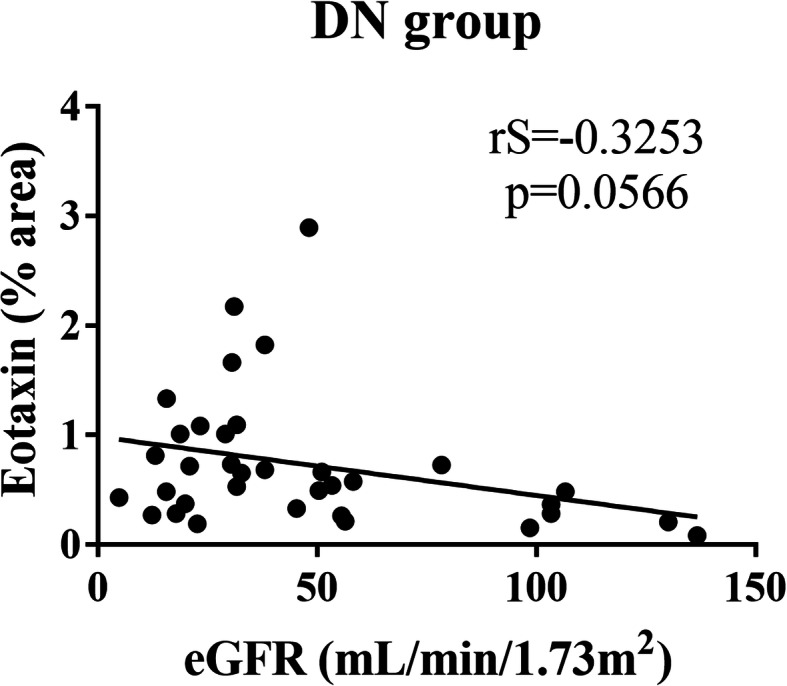
Results: The DN group showed a significant increase in IL-6 (p < 0.0001), IL-1β (p < 0.0001), IL-4 (p < 0.0001) and eotaxin (p = 0.0012) expression, and a decrease in TNFR1 (p = 0.0107) and IL-8 (p = 0.0262) expression compared to the control group. However, there were no significant differences in IL-10 (p = 0.4951), TNF-α (p = 0.7534), and MIP-1α (p = 0.3816) expression among groups. Regarding interstitial inflammation, there was a significant increase in IL-6 in scores 0 and 1 compared to score 2 (p = 0.0035), in IL-10 in score 2 compared to score 0 (p = 0.0479), and in eotaxin in score 2 compared to scores 0 and 1 (p < 0.0001), whereas IL-8 (p = 0.0513) and MIP-1α (p = 0.1801) showed no significant differences. There was a tendency for negative correlation between eotaxin and estimated glomerular filtration rate (eGFR) (p = 0.0566).

Conclusions: Our results indicated an increased in situ production of cytokines and chemokines in DN, including IL-6, IL-1β, IL-4, and eotaxin. It was observed that, possibly, eotaxin may have an important role in the progression of interstitial inflammation in DN and in eGFR decrease of these patients.

Keywords: Chemokines; Cytokines; Diabetic nephropathy; Interstitial inflammation; Renal biopsy.


Conflict of interest statement

We declare not having conflict of interest related to this study.

Figures

Fig. 1
Fig. 1
In situ expression of IL-6, IL-1β, and IL-4 in glomerular and tubulointerstitial compartments in patients with diabetic nephropathy (DN) and control group. a IL-6 expression in control and DN groups. b IL-6 immunostaining in control and DN groups. c IL-1β expression in control and DN groups. d IL-1β immunostaining in control and DN groups. e IL-4 expression in control group and DN groups. f IL-4 immunostaining in control and DN groups. Results are expressed as median (min-max). Horizontal lines represent the medians, the bars represent the 25–75% percentiles and the vertical lines represent the percentiles 10–90%
Fig. 2
Fig. 2
In situ expression of TNFR1, IL-10, and TNF-α in glomerular and tubulointerstitial compartments in patients with diabetic nephropathy (DN) and control group. a TNFR1 expression in control and DN groups. b TNFR1 immunostaining in control and DN groups. c IL-10 expression in control and DN groups. d IL-10 immunostaining in control and DN groups. e TNF-α expression in control and DN groups. f TNF-α immunostaining in control and DN groups. Results are expressed as median (min-max). Horizontal lines represent the medians, the bars represent the 25–75% percentiles and the vertical lines represent the percentiles 10–90%
Fig. 3
Fig. 3
In situ expression of chemokines eotaxin, IL-8, and MIP-1α in glomerular and tubulointerstitial compartments in patients with diabetic nephropathy (DN) and control group. a Eotaxin expression in control and DN groups. b Eotaxin immunostaining in control and DN groups. c IL-8 expression in control and DN groups. d IL-8 immunostaining in control and DN groups. e MIP-1α expression in control and DN groups. f MIP-1α immunostaining in control and DN groups. Results are expressed as median (min-max). Horizontal lines represent the medians, the bars represent the 25–75% percentiles and the vertical lines represent the percentiles 10–90%
Fig. 4
Fig. 4
Comparison between in situ cytokine and chemokine expression and interstitial inflammation in patients with diabetic nephropathy (DN). Score 0 (n = 4), score 1 (n = 19) and score 2 (n = 20). a IL-6 expression in cases classified as scores 0, 1, and 2 for interstitial inflammation in DN group. b IL-10 expression in cases classified as scores 0, 1, and 2 for interstitial inflammation in DN group. c Eotaxin expression in cases classified as scores 0, 1, and 2 for interstitial inflammation in DN group. d IL-8 expression in cases classified as scores 0, 1, and 2 for interstitial inflammation in DN group. e MIP-1α expression in cases classified as scores 0, 1, and 2 for interstitial inflammation in DN group. Results are expressed as median (min-max). Horizontal lines represent the medians, the bars represent the 25–75% percentiles and the vertical lines represent the percentiles 10–90%
Fig. 5
Fig. 5
Correlation between estimated glomerular filtration rate (eGFR) and in situ chemokine expression in patients with diabetic nephropathy (DN). Negative and significant correlation trend between eGFR and eotaxin in DN group

References

    1. Cho NH, Shaw JE, Karuranga S, Huang Y, da Rocha Fernandes JD, Ohlrogge AW, et al. IDF diabetes atlas: global estimates of diabetes prevalence for 2017 and projections for 2045. Diabetes Res Clin Pract. 2018;138:271–281. doi: 10.1016/j.diabres.2018.02.023. - DOI - PubMed
    1. Lim CTS, Nordin NZ, Fadhlina NZ, Anim MS, Kalaiselvam T, Haikal WZ, et al. Rapid decline of renal function in patients with type 2 diabetes with heavy proteinuria: a report of three cases. BMC Nephrol. 2019;20(1):22. - PMC - PubMed
    1. Tuttle KR. Linking metabolism and immunology: diabetic nephropathy is an inflammatory disease. J Am Soc Nephrol. 2005;16(6):1537–1538. - PubMed
    1. Mora C, Navarro JF. Inflammation and diabetic nephropathy. Curr Diab Rep. 2006;6(6):463–468. - PubMed
    1. Wada J, Makino H. Inflammation and the pathogenesis of diabetic nephropathy. Clin Sci (Lond) 2013;124(3):139–152. - PubMed

Publication types

MeSH terms