. 2020 Jul 28;13(1):107.
doi: 10.1186/s13041-020-00646-w.

Cortico-amygdala interaction determines the insular cortical neurons involved in taste memory retrieval

Affiliations

Cortico-amygdala interaction determines the insular cortical neurons involved in taste memory retrieval

Konami Abe et al. Mol Brain. .

Abstract

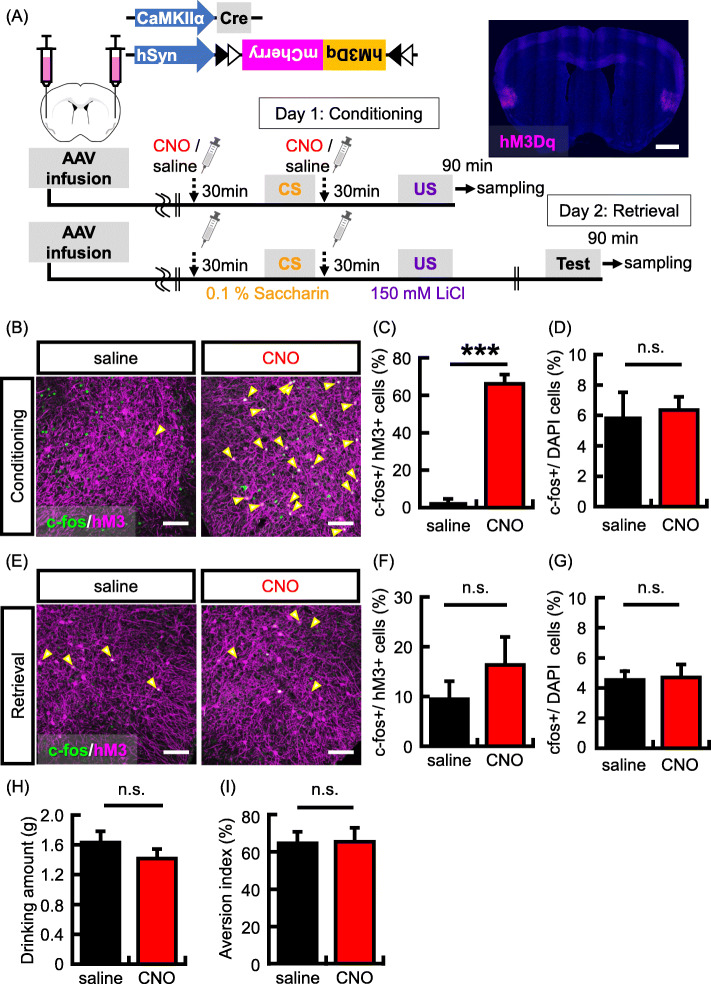
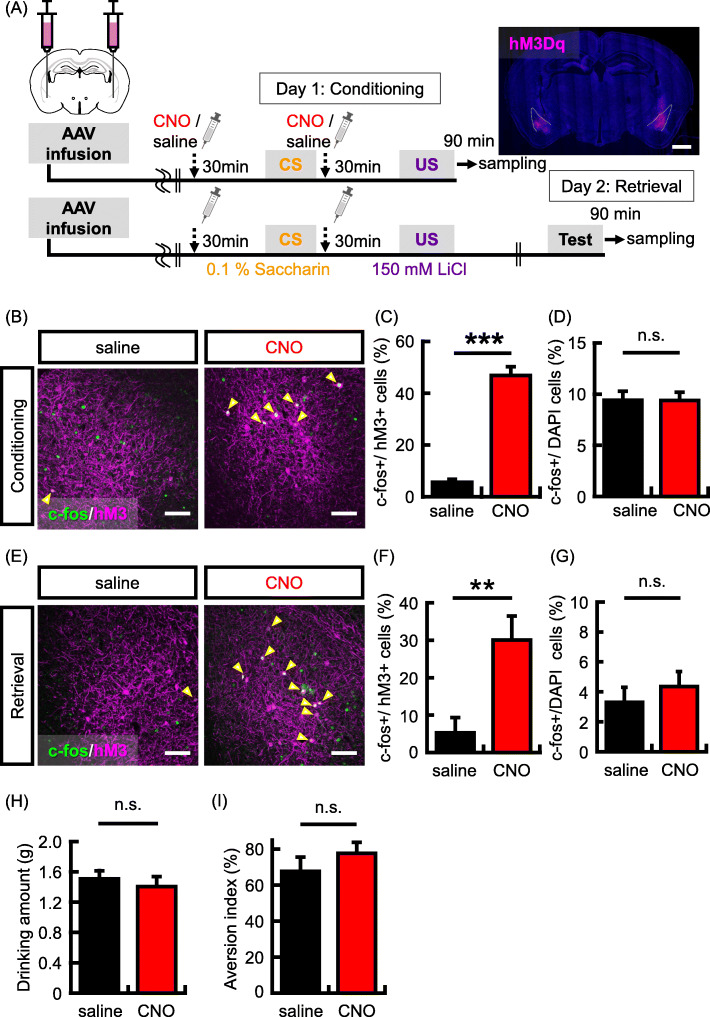
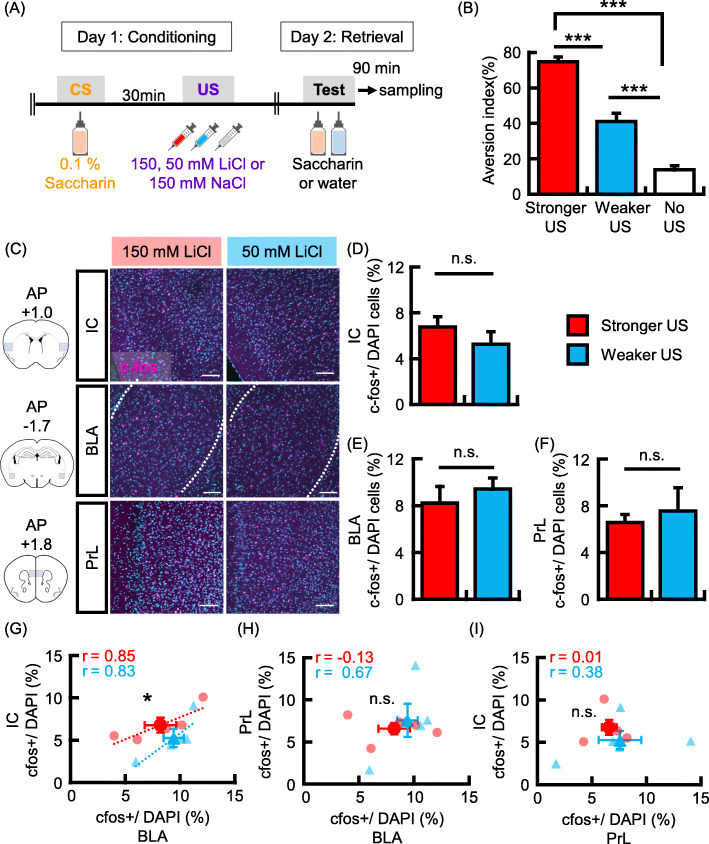
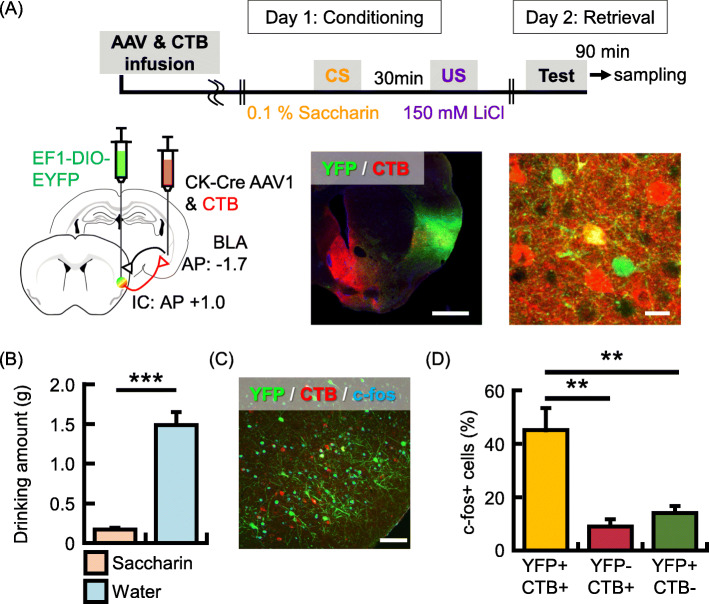
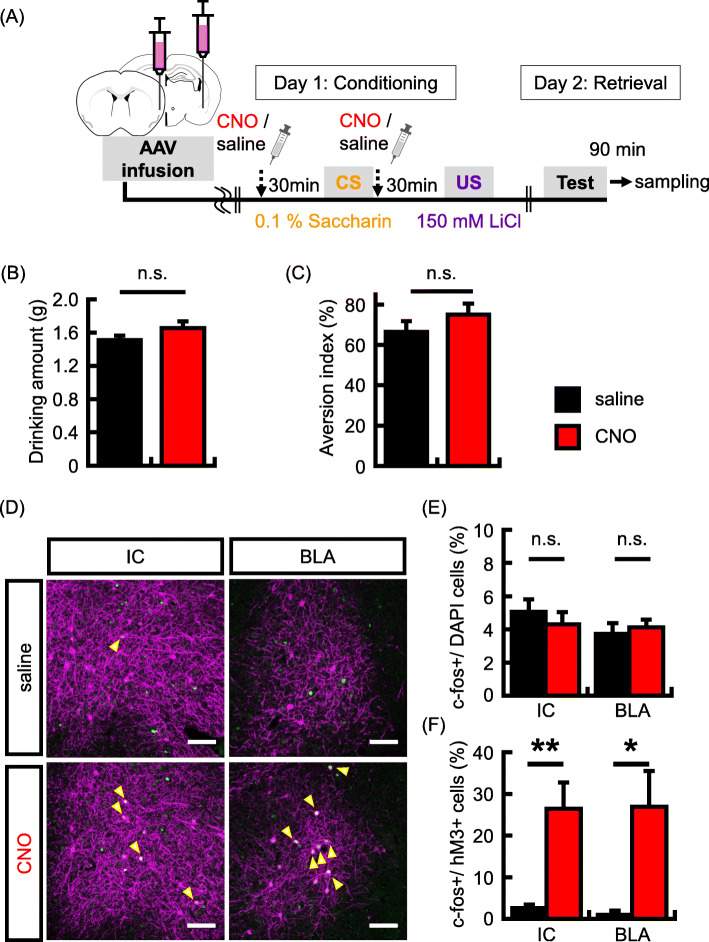
The insular cortex (IC) is the primary gustatory cortex, and it is a critical structure for encoding and retrieving the conditioned taste aversion (CTA) memory. In the CTA, consumption of an appetitive tastant is associated with aversive experience such as visceral malaise, which results in avoidance of consuming a learned tastant. Previously, we showed that levels of the cyclic-AMP-response-element-binding protein (CREB) determine the insular cortical neurons that proceed to encode a conditioned taste memory. In the amygdala and hippocampus, it is shown that CREB and neuronal activity regulate memory allocation and the neuronal mechanism that determines the specific neurons in a neural network that will store a given memory. However, cellular mechanism of memory allocation in the insular cortex is not fully understood. In the current study, we manipulated the neuronal activity in a subset of insular cortical and/or basolateral amygdala (BLA) neurons in mice, at the time of learning; for this purpose, we used an hM3Dq designer receptor exclusively activated by a designer drug system (DREADD). Subsequently, we examined whether the neuronal population whose activity is increased during learning, is reactivated by memory retrieval, using the expression of immediate early gene c-fos. When an hM3Dq receptor was activated only in a subset of IC neurons, c-fos expression following memory retrieval was not significantly observed in hM3Dq-positive neurons. Interestingly, the probability of c-fos expression in hM3Dq-positive IC neurons after retrieval was significantly increased when the IC and BLA were co-activated during conditioning. Our findings suggest that functional interactions between the IC and BLA regulates CTA memory allocation in the insular cortex, which shed light on understanding the mechanism of memory allocation regulated by interaction between relevant brain areas.

Keywords: Basolateral amygdala; Conditioned taste aversion; Functional interaction; Insular cortex; Memory allocation; Structural interaction; Taste memory.


Conflict of interest statement

The authors declare no competing interests.

Figures

Fig. 1
Fig. 1
Increasing neuronal activity in a subset of IC neurons during CTA conditioning. a The top panel shows the map of the AAV constructs. Bottom panel shows experimental schema. Representative picture showing localized hM3Dq (magenta) expression in the IC by hM3Dq-mCherry virus infection. Scale bar = 1000 um. b Representative images showing expression of c-fos (green) following conditioning and hM3Dq (magenta). Yellow arrows indicate double-labeled neurons (c-fos + and hM3Dq+). Scale bar = 100 um. (C-D) Probability of expression of c-fos (c-fos+) in cells transduced with the hM3Dq viruses (hM3Dq + neurons) (c) and stained with DAPI (DAPI+ cells) (d) in the IC (N = 3 in each group). e Representative images showing expression of c-fos (green) following memory retrieval test and hM3Dq (magenta). Scale bar = 100 um. f-g Probability of occurrence of c-fos + neurons in the hM3Dq + neurons (f) and DAPI+ cells (g) in the IC (N = 7 in each group). h Data show the mean quantity of saccharine solution consumed during the conditioning. i Data showing the aversion index in the memory retrieval test (N = 13 in each group). Data are presented as mean ± SEM; ***p < 0.001 (saline-injected mice, black columns; CNO-injected mice, red columns)
Fig. 2
Fig. 2
Neural activity regulates taste memory allocation in BLA neurons. a Experimental schema. Representative picture shows localized hM3Dq (magenta) expression in the BLA. Scale bar = 1000 um. b Representative images showing expression of c-fos (green) following conditioning and hM3Dq (magenta). Yellow arrows indicate double-labeled neurons (c-fos + and hM3Dq+). Scale bar = 100 um.c-d Expression probability of expression of c-fos + following conditioning in hM3Dq + neurons (c) and DAPI+ cells (d) in the BLA (saline group, N = 4, CNO group, N = 5 animals). e Representative images showing the expression of c-fos (green) following memory retrieval test and hM3Dq (magenta). Yellow arrows indicate double-labeled neurons (c-fos + and hM3Dq+). Scale bar = 100 um. f-g Probability of occurrence of c-fos + neurons in the hM3Dq + neurons (f) and DAPI+ cells (g) in the BLA (saline group, N = 7, CNO group, N = 8 animals). h Data showing the mean quantity of saccharine solution consumed during the conditioning. i Data showing the aversion index in the memory retrieval test (saline group, N = 9 in each group). Data are presented as mean ± SEM; **p < 0.01 and ***p < 0.001 (saline-injected mice, black columns; CNO-injected mice, red columns)
Fig. 3
Fig. 3
Functional connectivity between the IC and BLA is increased in stronger US conditioning. a Experimental schema. b Data showing the aversion index in the memory retrieval test (Stronger US, N = 14; Weaker US, N = 14; No US, N = 13). c Left panels show schema of representative coronal sections at each AP position (AP = + 1.0 mm; IC, AP = − 1.7 mm; BLA, AP = + 1.8 mm; PrL). Analyzed areas are depicted by a red line. Representative images showing c-fos (magenta) after memory retrieval test. Scale bar = 100 μm. d-f Probability of expression of c-fos in DAPI+ cells in the IC (d), BLA (e) and PrL (f) (N = 5 in each group). g-i Probabilities of occurrence of c-fos + neurons in the IC versus BLA (g), BLA versus PrL (h), and IC versus PrL (i) are plotted for each mouse. The r represents correlation coefficient. Data are represented as mean ± SEM; *p < 0.05 and ***p < 0.001 (Stronger US, red columns and circles; Weaker US group, blue columns and triangles)
Fig. 4
Fig. 4
IC neurons reciprocally connected with the BLA are preferentially activated by CTA memory retrieval. a Experimental schema (top panel). CTB and AAV1-hSyn-Cre injection into the BLA and AAV1-Ef1a-DIO EYFP injection into the IC (bottom left panel). Representative image showing coronal section of the IC with CTB (red) and YFP (green) labeled cells. Scale bars = 1000 um (bottom middle). Magnified representative image showing double-positive (yellow, reciprocally connected), YFP+/CTB- (BLA-to-IC only) and YFP−/CTB+ (IC-to-BLA only) IC neurons (bottom right). Scale bar = 20 um. b Data showing the mean quantity of saccharine solution (orange column) and water (blue column) consumed in the retrieval test (N = 5 animals). c Representative image showing expression of c-fos (cyan) following memory retrieval test, CTB (red) and YFP (green). Scale bar = 100 um. d Probability of occurrence of cells expressing c-fos after retrieval test over double-positive (yellow column), YFP+ ∩ CTB- (red column) and YFP- ∩ CTB+ (green column) cells in the IC. Data are represented as mean ± SEM; **p < 0.01 and ***p < 0.001
Fig. 5
Fig. 5
Co-activation of IC and BLA neurons regulates taste memory allocation in the IC. a Experimental schema. b Data showing the mean quantity of saccharine solution consumed during the conditioning. c Data showing the aversion index in memory retrieval test (saline group, N = 16, CNO group, N = 17 animals). d Representative images showing expression of c-fos (green) after memory retrieval test and that of hM3Dq (magenta). Yellow arrows indicate double-labeled neurons (c-fos + and hM3Dq+). Scale bars = 100 um. e-f Probability of expression of c-fos in DAPI cells (e) and in the hM3Dq + neurons (f) in the IC and BLA (IC, saline group, N = 5, CNO group, N = 6 animals; BLA, saline group, N = 5, CNO group, N = 6 animals). Data are represented as mean ± SEM; *p < 0.05 and **p < 0.01 (saline-injected mice, black columns; CNO-injected mice, red columns)

References

    1. Yamamoto T. Taste responses of cortical neurons. Prog Neurobiol. 1984;23(4):273–315. - PubMed
    1. Peng Y, Gillis-Smith S, Jin H, Trankner D, Ryba NJ, Zuker CS. Sweet and bitter taste in the brain of awake behaving animals. Nature. 2015;527(7579):512–515. - PMC - PubMed
    1. Chen X, Gabitto M, Peng Y, Ryba NJ, Zuker CS. A gustotopic map of taste qualities in the mammalian brain. Science. 2011;333(6047):1262–1266. - PMC - PubMed
    1. Cechetto DF, Saper CB. Evidence for a viscerotopic sensory representation in the cortex and thalamus in the rat. J Comp Neurol. 1987;262(1):27–45. - PubMed
    1. Hanamori T, Kunitake T, Kato K, Kannan H. Responses of neurons in the insular cortex to gustatory, visceral, and nociceptive stimuli in rats. J Neurophysiol. 1998;79(5):2535–2545. - PubMed

Publication types

LinkOut - more resources