. 2020 Sep;158(3):710-718.
doi: 10.1016/j.ygyno.2020.05.030. Epub 2020 Jul 26.

Historical and projected hysterectomy rates in the USA: Implications for future observed cervical cancer rates and evaluating prevention interventions

Affiliations

Historical and projected hysterectomy rates in the USA: Implications for future observed cervical cancer rates and evaluating prevention interventions

Kate T Simms et al. Gynecol Oncol. 2020 Sep.

Abstract

Background: SEER-reported cervical cancer incidence rates reflect the total female population including women no longer at risk due to hysterectomy. Hysterectomy rates have been declining in the United States as alternative treatments have become available, which could result in an apparent increase in SEER-reported cervical cancer rates. We aimed to obtain nationally representative historical data on hysterectomy rates in USA, use trends analysis to project rates back to 1935 and forward to 2035, and then predict the impact of changing hysterectomy rates on SEER-reported cervical cancer rates.

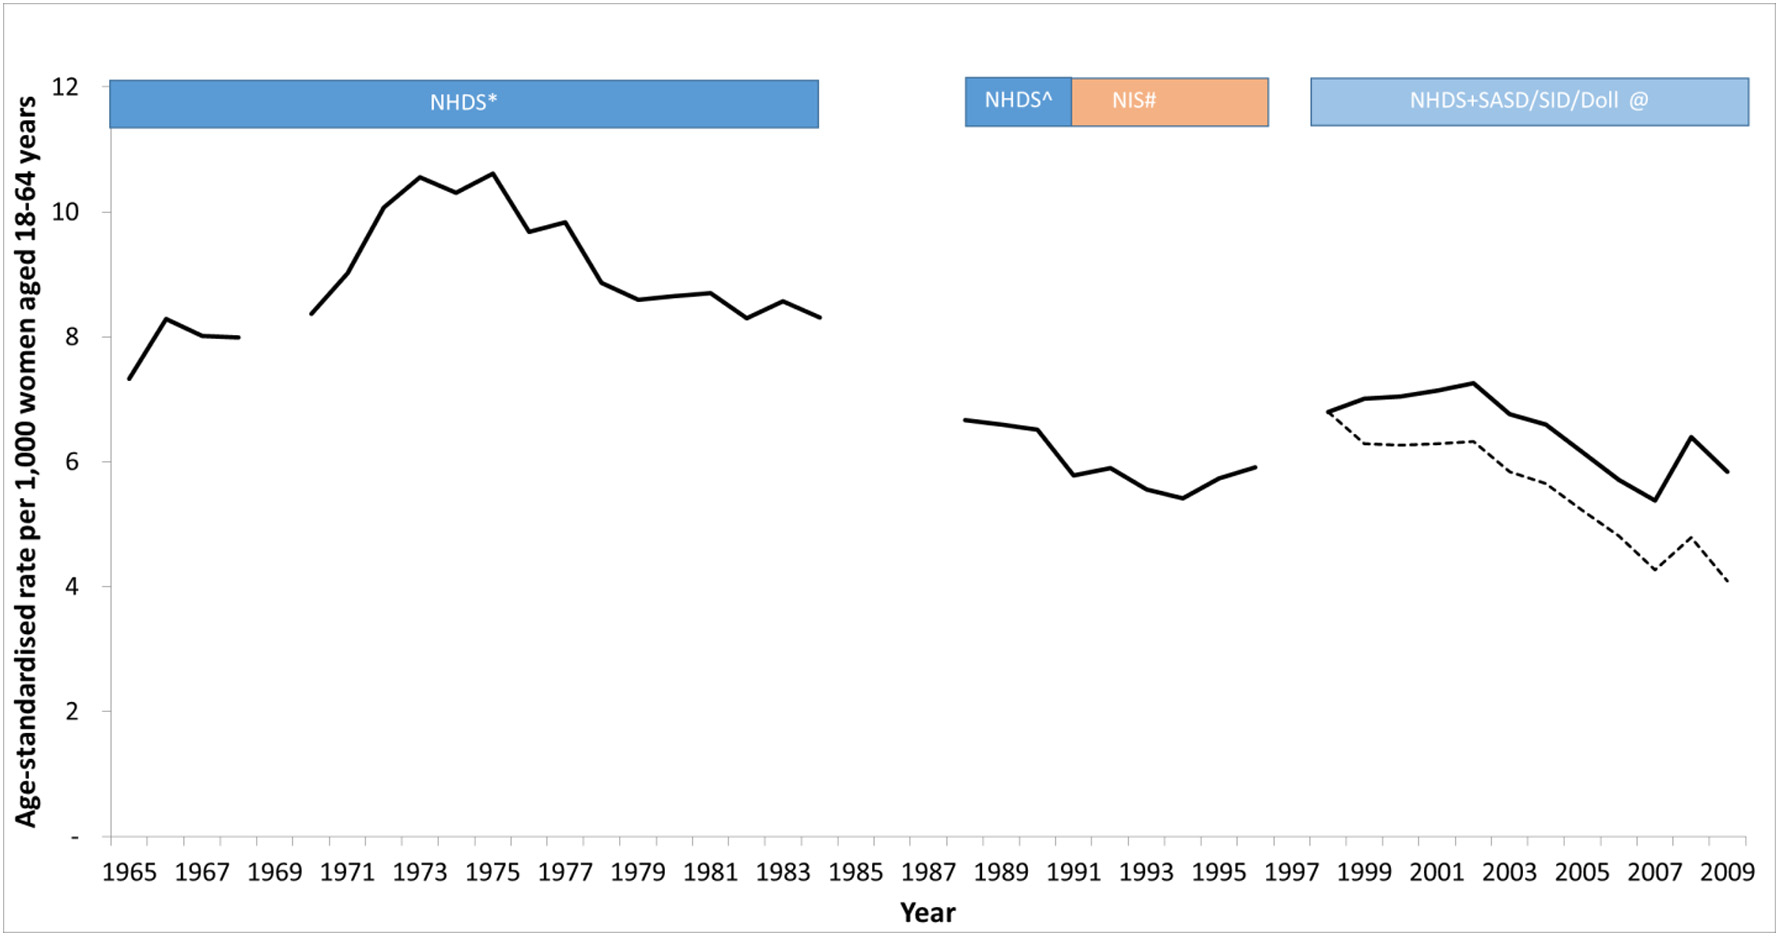
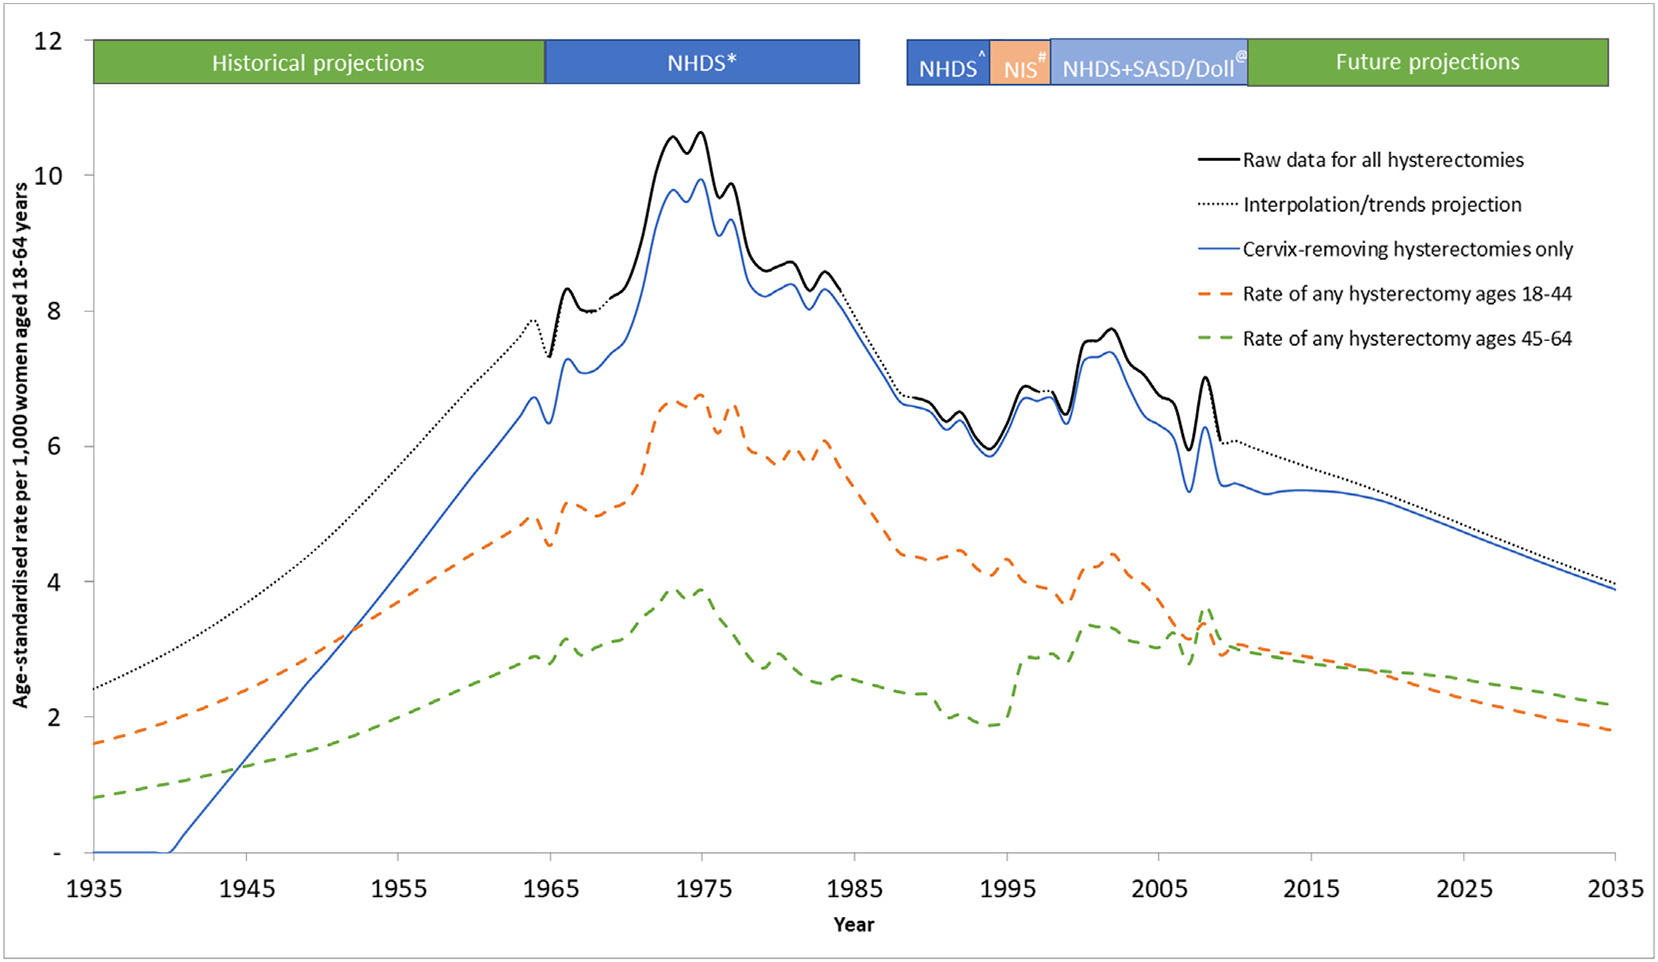
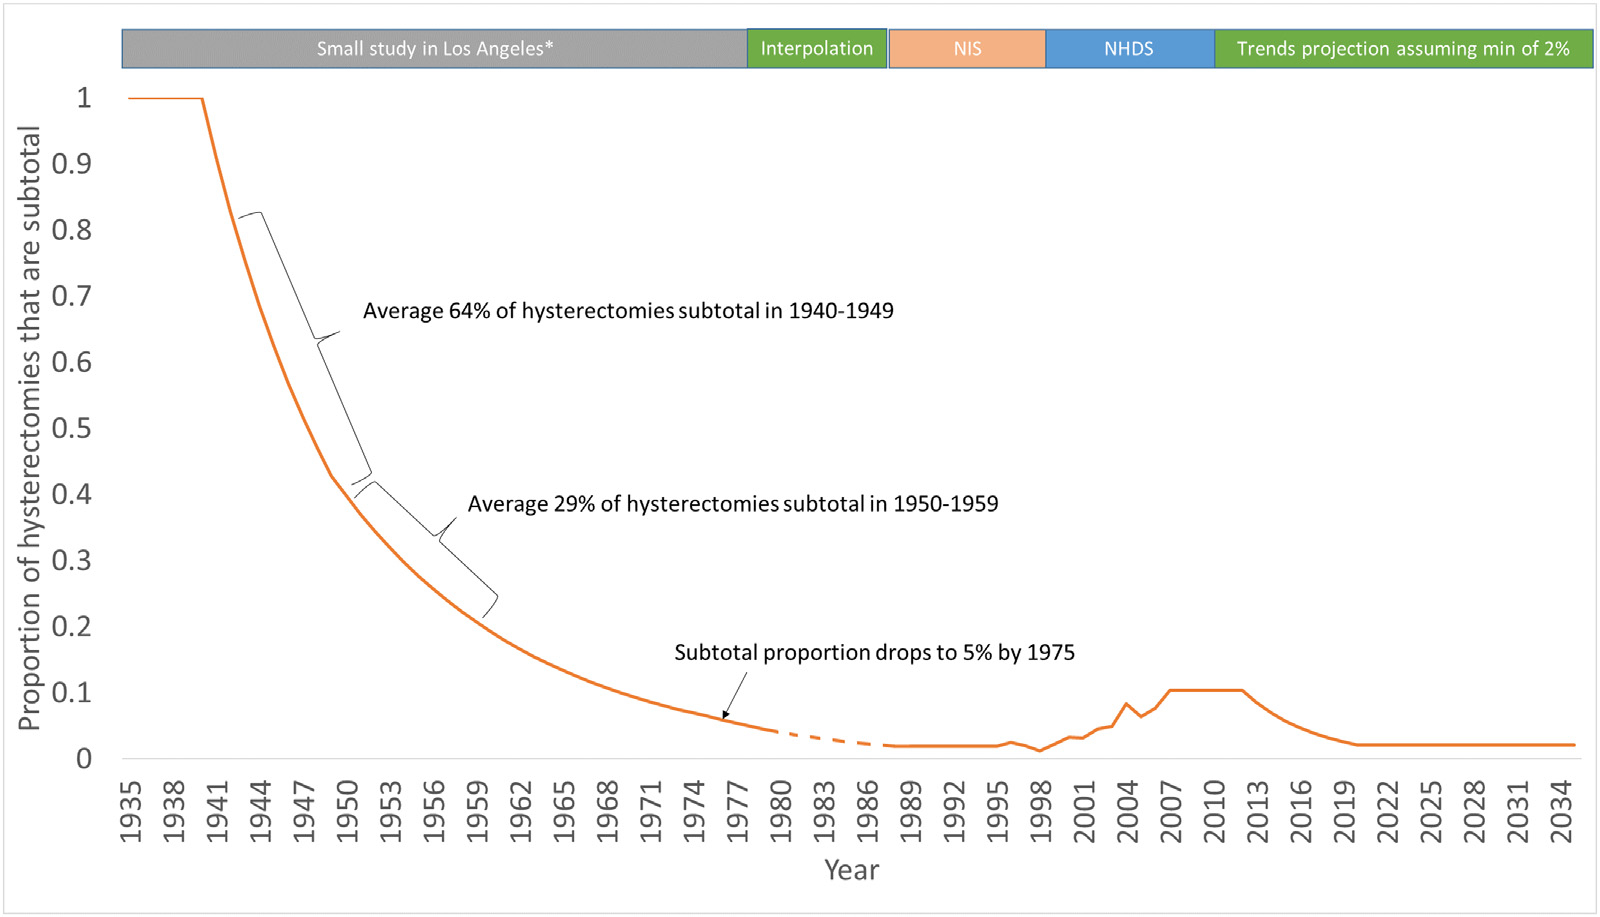
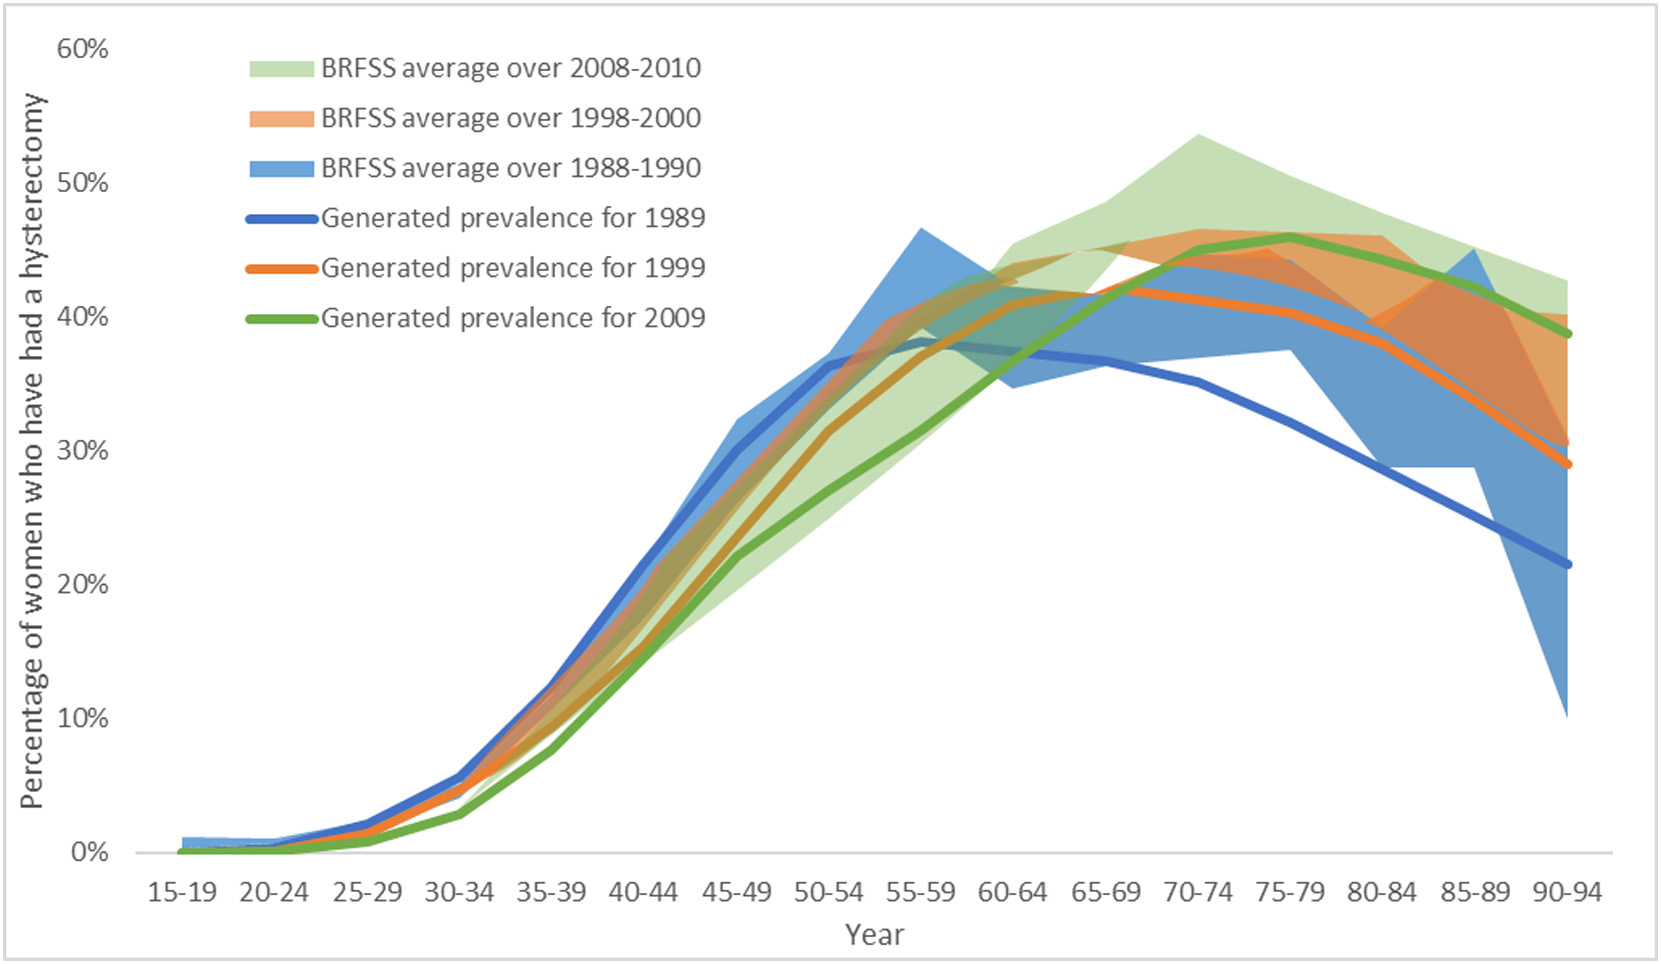
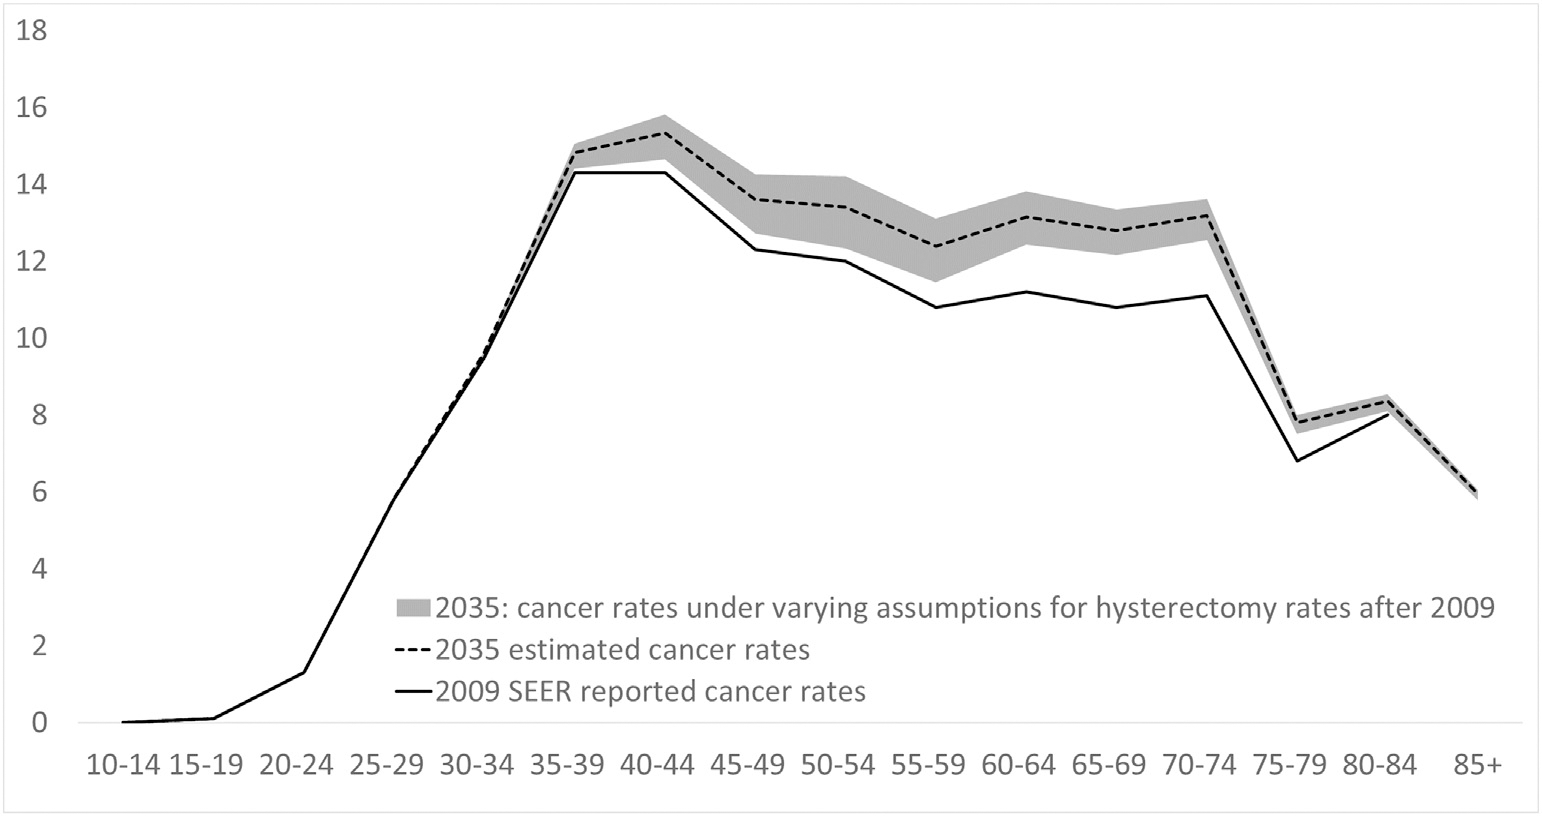
Methods: We performed a systematic search of Medline, Embase, Premedline, Cochrane Central databases and extracted nationally-representative hysterectomy incidence data from 1965 to 2009, including data on the number of cervix-preserving (subtotal) procedures. We then projected rates back to 1935, and forward to 2035 based on trends from joinpoint regression. These rates were then used to estimate hysterectomy prevalence out to 2035, and then to predict the impact of changing hysterectomy rates on SEER-reported cervical cancer rates to 2035. We examined alternative assumptions regarding projected hysterectomy incidence rates out to 2035, including a scenario in which rates decline no further from 2009 rates, and a scenario where rates decline at twice the baseline rate.

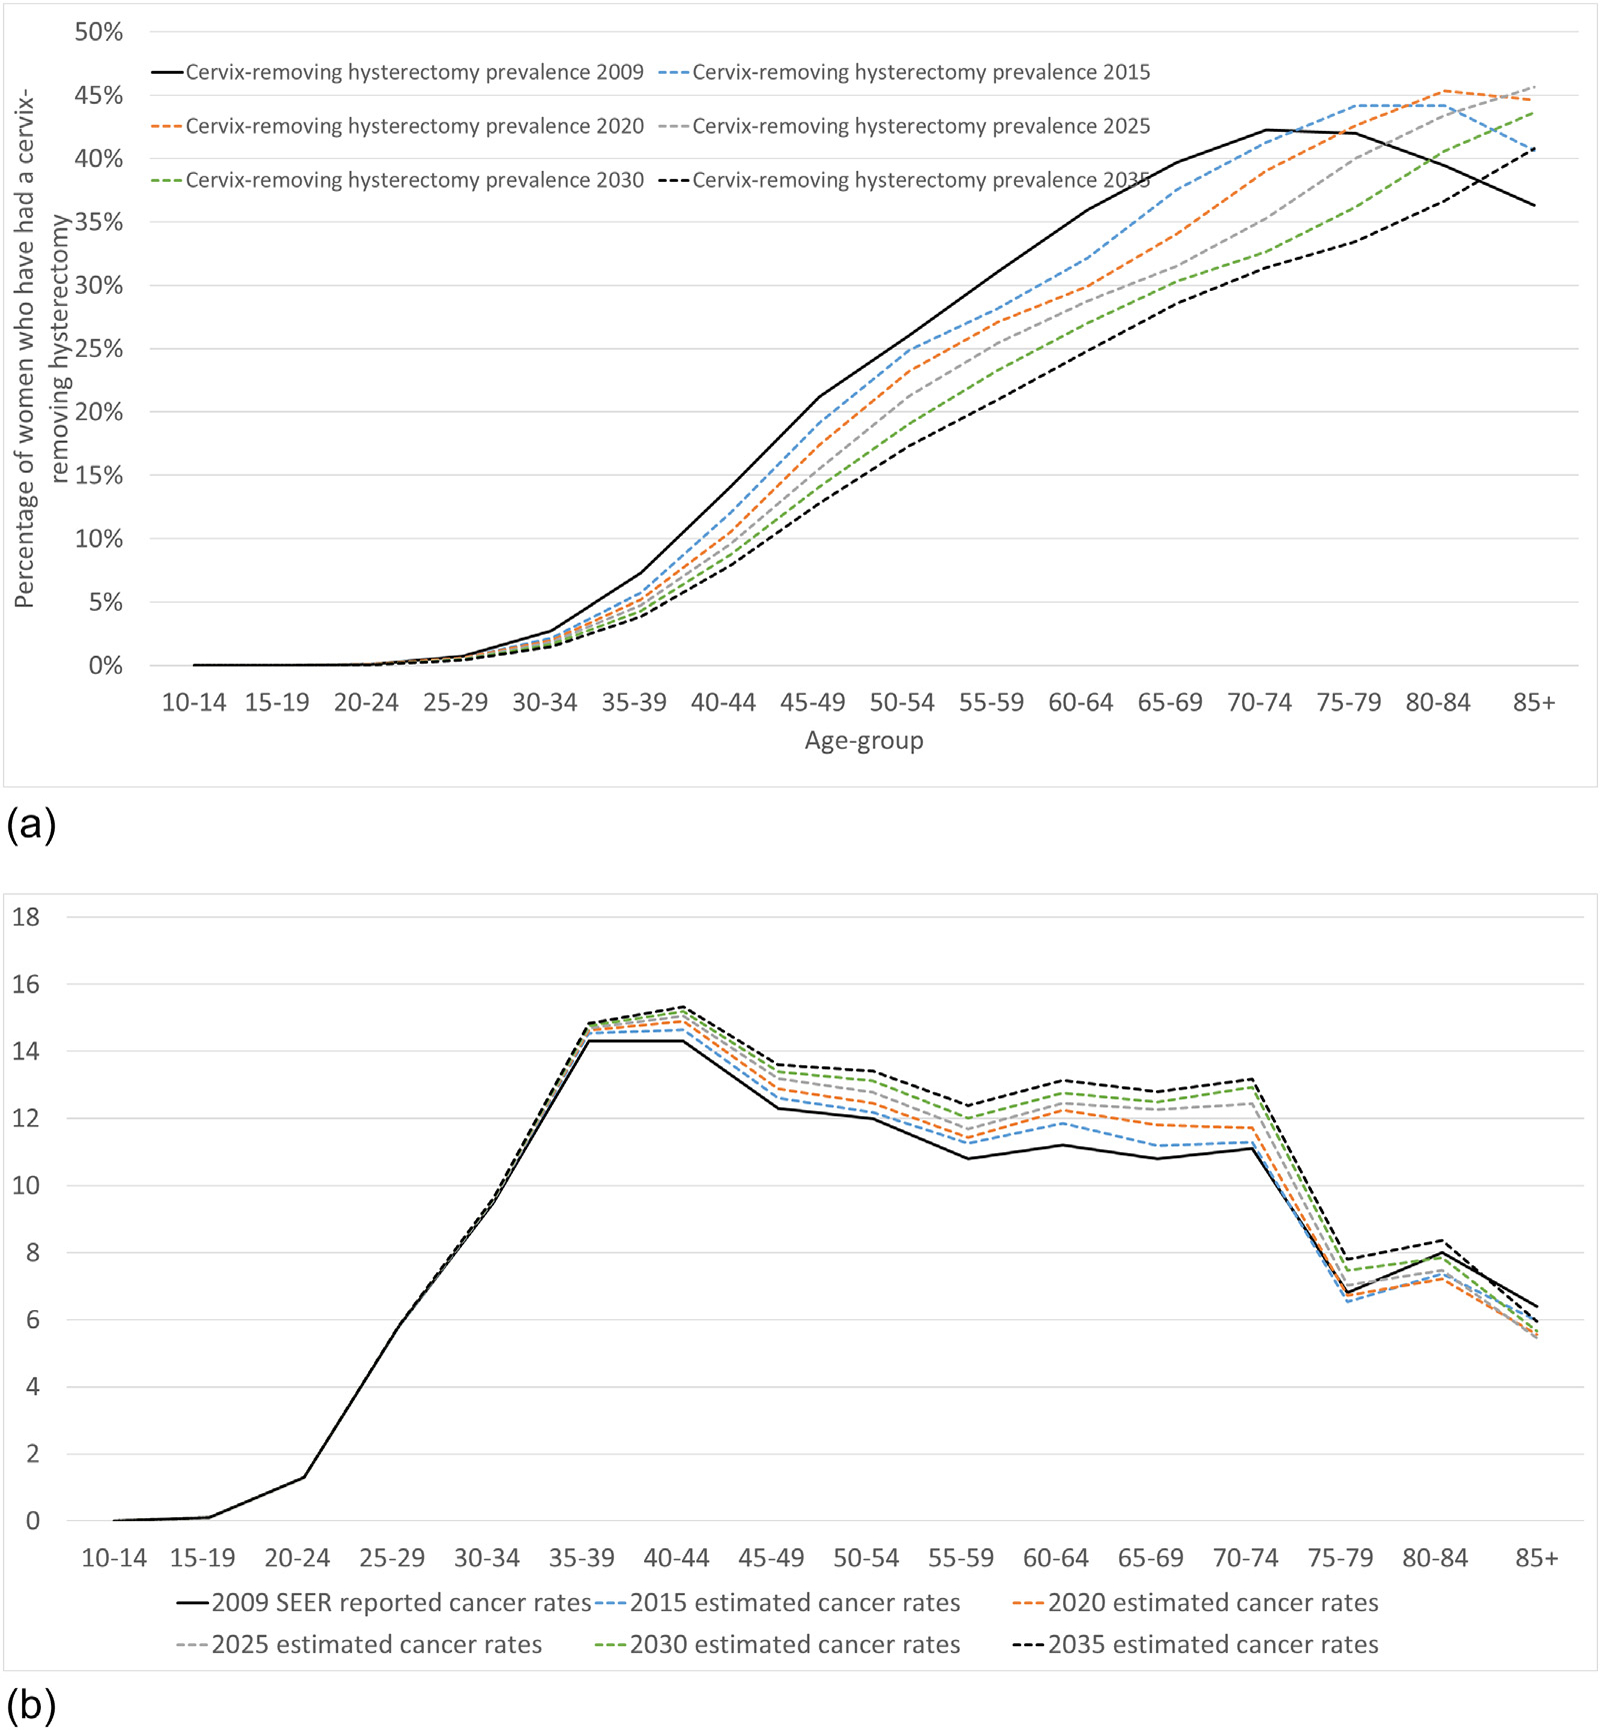
Results: Estimated age-standardized hysterectomy incidence increased from 2.4 to 10.6 per 1000 women between 1935 and 1975. Thereafter, rates are predicted to fall to 3.9 per 1000 by 2035. Subtotal hysterectomy procedures declined from being the predominant method in 1935 to less than 12% of procedures from 1970 onwards. Consequently, holding all else constant, an increase in SEER-reported age-standardized cervical cancer incidence rates (ages 0-85+) of 9% is expected from 2009 to 2035. The predictions were minimally impacted by alternative scenarios for future hysterectomy rates.

Conclusions: Declining hysterectomy rates have implications for the interpretation of SEER-reported cervical cancer rates. A background increase in cervical cancer rates due to decreasing population hysterectomy exposure may partially offset expected decreases from recent cervical screening changes recommended by the US Preventive Services Task Force. Evaluations of new cervical cancer prevention opportunities should consider the background impact of historical and projected hysterectomy rates.

Keywords: Cervical cancer; Hysterectomy; Trends; USA.


Conflict of interest statement

Declaration of competing interest KS receives salary support from the Cancer Institute. MAS receives salary support from the National Health and Medical Research Council (Australia) and the Cancer Institute NSW. KC is co-PI of an unrelated investigator-initiated trial of cytology and primary HPV screening in Australia (‘Compass’), which is conducted and funded by the VCS Foundation, a government-funded health promotion charity. In 2013, the VCS Foundation received equipment and a funding contribution for the Compass trial from Roche Molecular Systems and Ventana Inc. USA. However, neither KC nor her institution (Cancer Council NSW) receives direct funding from industry for this trial or any other project. All other authors declare no conflicts of interest.

Figures

Fig. 1.
Fig. 1.
Reported hysterectomy incidence rates (both subtotal and cervix-removing procedures) per 1000 women aged 18–64 years in USA. Data were obtained from analysis of national inpatient datasets from 1965 to 2009. For 2000–2009, the crude reported data from inpatient procedures is shown as the dashed black curve, and the scaled hysterectomy incidence rate after accounting for the under-reported proportion of outpatient procedures is shown as the solid black curve. *Obtained from published rates [22] reported by 5-year age-group and for each individual year from 1965 to 1984 but missing the year 1969. Ôbtained from published rates [23] reported over ages 15+ as one group and across years 1988–1990 as one group. We re-scaled the rates to represent rates for females aged 18–64 (with the assumption that all hysterectomy procedures were performed in this age-range) and assumed that the same number of procedures occurred over the period 1988–1990 each year. #Obtained from published rates [5] reported over ages 15+ as one age-group and for each individual year from 1990 to 1997. We re-scaled the rates to represent rates for females aged 18–64 (with the assumption that all hysterectomy procedures were performed in this age-range). @Obtained from publicly available datasets [27] reported for each year-of-age from 15 to 99 and for each individual year from 1998 to 2009. Raw hysterectomy incidence rates were obtained for inpatient procedures only, and these raw rates are shown as the dashed black curve for 2000–2009. Hysterectomy rates were further adjusted to account for the unreported proportion of hysterectomies that are performed in an outpatient setting, and these corrected rates are shown as the solid black curve.
Fig. 2.
Fig. 2.
Estimated incidence rate of hysterectomy procedures (both subtotal and cervix-removing procedures) per 1000 women aged 18–64 years in USA from 1935 to 2035^^ ^^ Rates for all hysterectomies are shown as the combined black-solid (real-world informed) and black-dashed (interpolated/trends projection) line. The national datasets used to inform the real-world data segments are listed in the coloured region above the graph. Hysterectomy procedures that are cervix-removing are shown on the graph in the blue solid line. Hysterectomy procedures of any type in females aged 18–44 and 44–64 are shown as the dashed orange and dashed green lines respectively. *Obtained from published rates [28] reported by 5-year age-group and for each individual year from 1965 to 1984, but missing the year 1969. Ôbtained from published rates [29] reported over ages 15+ as one group and across years 1988–1990 as one group. We re-scaled the rates to represent rates for females aged 18–64 (with the assumption that all hysterectomy procedures were performed in this age-range) and assumed that the same number of procedures occurred over the period 1988–1990 each year. #Obtained from published rates [3] reported over ages 15+ as one group and for each individual year from 1990 to 1997. We re-scaled the rates to represent rates for females aged 18–64 (with the assumption that all hysterectomy procedures were performed in this age-range). @Obtained from the publicly available datasets [27] reported for each year-of-age from 15 to 99 and for each individual year from 1998 to 2009. Hysterectomy rates were further adjusted to account for the unreported proportion of hysterectomies that are performed in an outpatient setting.
Fig. 3.
Fig. 3.
Estimated proportion of hysterectomies that are subtotal. *A small Los-Angeles study [16] reported a declining proportion of subtotal hysterectomies from 100% in 1940, to 64% of procedures between 1940–1949, 39% of procedures over 1950–1959 and dropping to 5% in 1975. @ NIS data was used to inform hysterectomy procedures from 1992–1995 [30]. ** NHDS data was used to directly inform the proportion of hysterectomies that are subtotal for the years 1997–2009 with data obtained from publicly available datasets [27] reported for each year-of-age from 15 to 99 and for each individual year. ^ Data from the NIS was used to inform the proportion of hysterectomies that are subtotal from 2009 to 2013. The proportion of hysterectomies that are subtotal during 1990–1993 was based on NIS data.
Fig. 4.
Fig. 4.
Age-specific hysterectomy prevalence estimates (including subtotal and cervix-removing procedures) as reported by BRFSS (a) for the years shown in shaded regions for 1988–1990 (blue), 1998–2000 (orange) and 2008–2010 (green), and (b) for the year 2016. Estimated historical hysterectomy incidence rates were used to produce cross-sectional prevalence, shown as the solid lines for years 1998 (blue), 1999 (orange) and 2009 (green).
Fig. 4.
Fig. 4.
Age-specific hysterectomy prevalence estimates (including subtotal and cervix-removing procedures) as reported by BRFSS (a) for the years shown in shaded regions for 1988–1990 (blue), 1998–2000 (orange) and 2008–2010 (green), and (b) for the year 2016. Estimated historical hysterectomy incidence rates were used to produce cross-sectional prevalence, shown as the solid lines for years 1998 (blue), 1999 (orange) and 2009 (green).
Fig. 5.
Fig. 5.
(a) Estimated prevalence of cervix-removing hysterectomies between 2009 and 2035 and (b) projected age-specific rate of cervical cancer incidence from 2009 to 2035.
Fig. 6.
Fig. 6.
Age-specific cervical cancer incidence rates projected for the year 2035, assuming baseline trends (solid black curve) and taking into account alternative assumptions for projections after 2009 (shaded grey regions) ^The re-estimated cancer incidence rates are based on changing hysterectomy prevalence alone. *shaded grey area represents the potential range of cervical cancer rates under a wide range of trends assumptions (0% change from 2009 versus double the rate of decline in hysterectomy rates from 2009 to 2035 with no lower bound). The dashed black line represents the baseline estimate of cancer rates in 2035. The black solid line represents SEER reported cancer rates for 2009.

References

    1. Agency for Healthcare Research and Quality R, MD, HCUP Nationwide Inpatient Sample (NIS). Healthcare Cost and Utilization Project (HCUP), https://www.hcupus.ahrq.gov/nisoverview.jsp. (Accessed 9 October 2017).
    1. Reich H, Decaprio J, McGlynn F, Laparoscopic hysterectomy J Gynecol. Surg. 5 (1989) 213–216.
    1. Farquhar CM, Steiner CA, Hysterectomy rates in the United States 1990–1997, Obstet. Gynecol. 99 (2) (2002) 229–234. - PubMed
    1. Wright JD, Ananth CV, Lewin SN, et al., Robotically assisted vs laparoscopic hysterectomy among women with benign gynecologic disease, Jama. 309 (7) (2013) 689–698. - PubMed
    1. Wright JD, Herzog TJ, Tsui J, et al., Nationwide trends in the performance of inpatient hysterectomy in the United States, Obstet. Gynecol. 122 (201) (2013) 233–241. - PMC - PubMed

Publication types