. 2020 Jul 28;13(642):eaaz8240.
doi: 10.1126/scisignal.aaz8240.

The mitophagy effector FUNDC1 controls mitochondrial reprogramming and cellular plasticity in cancer cells

Affiliations

The mitophagy effector FUNDC1 controls mitochondrial reprogramming and cellular plasticity in cancer cells

Jie Li et al. Sci Signal. .

Abstract

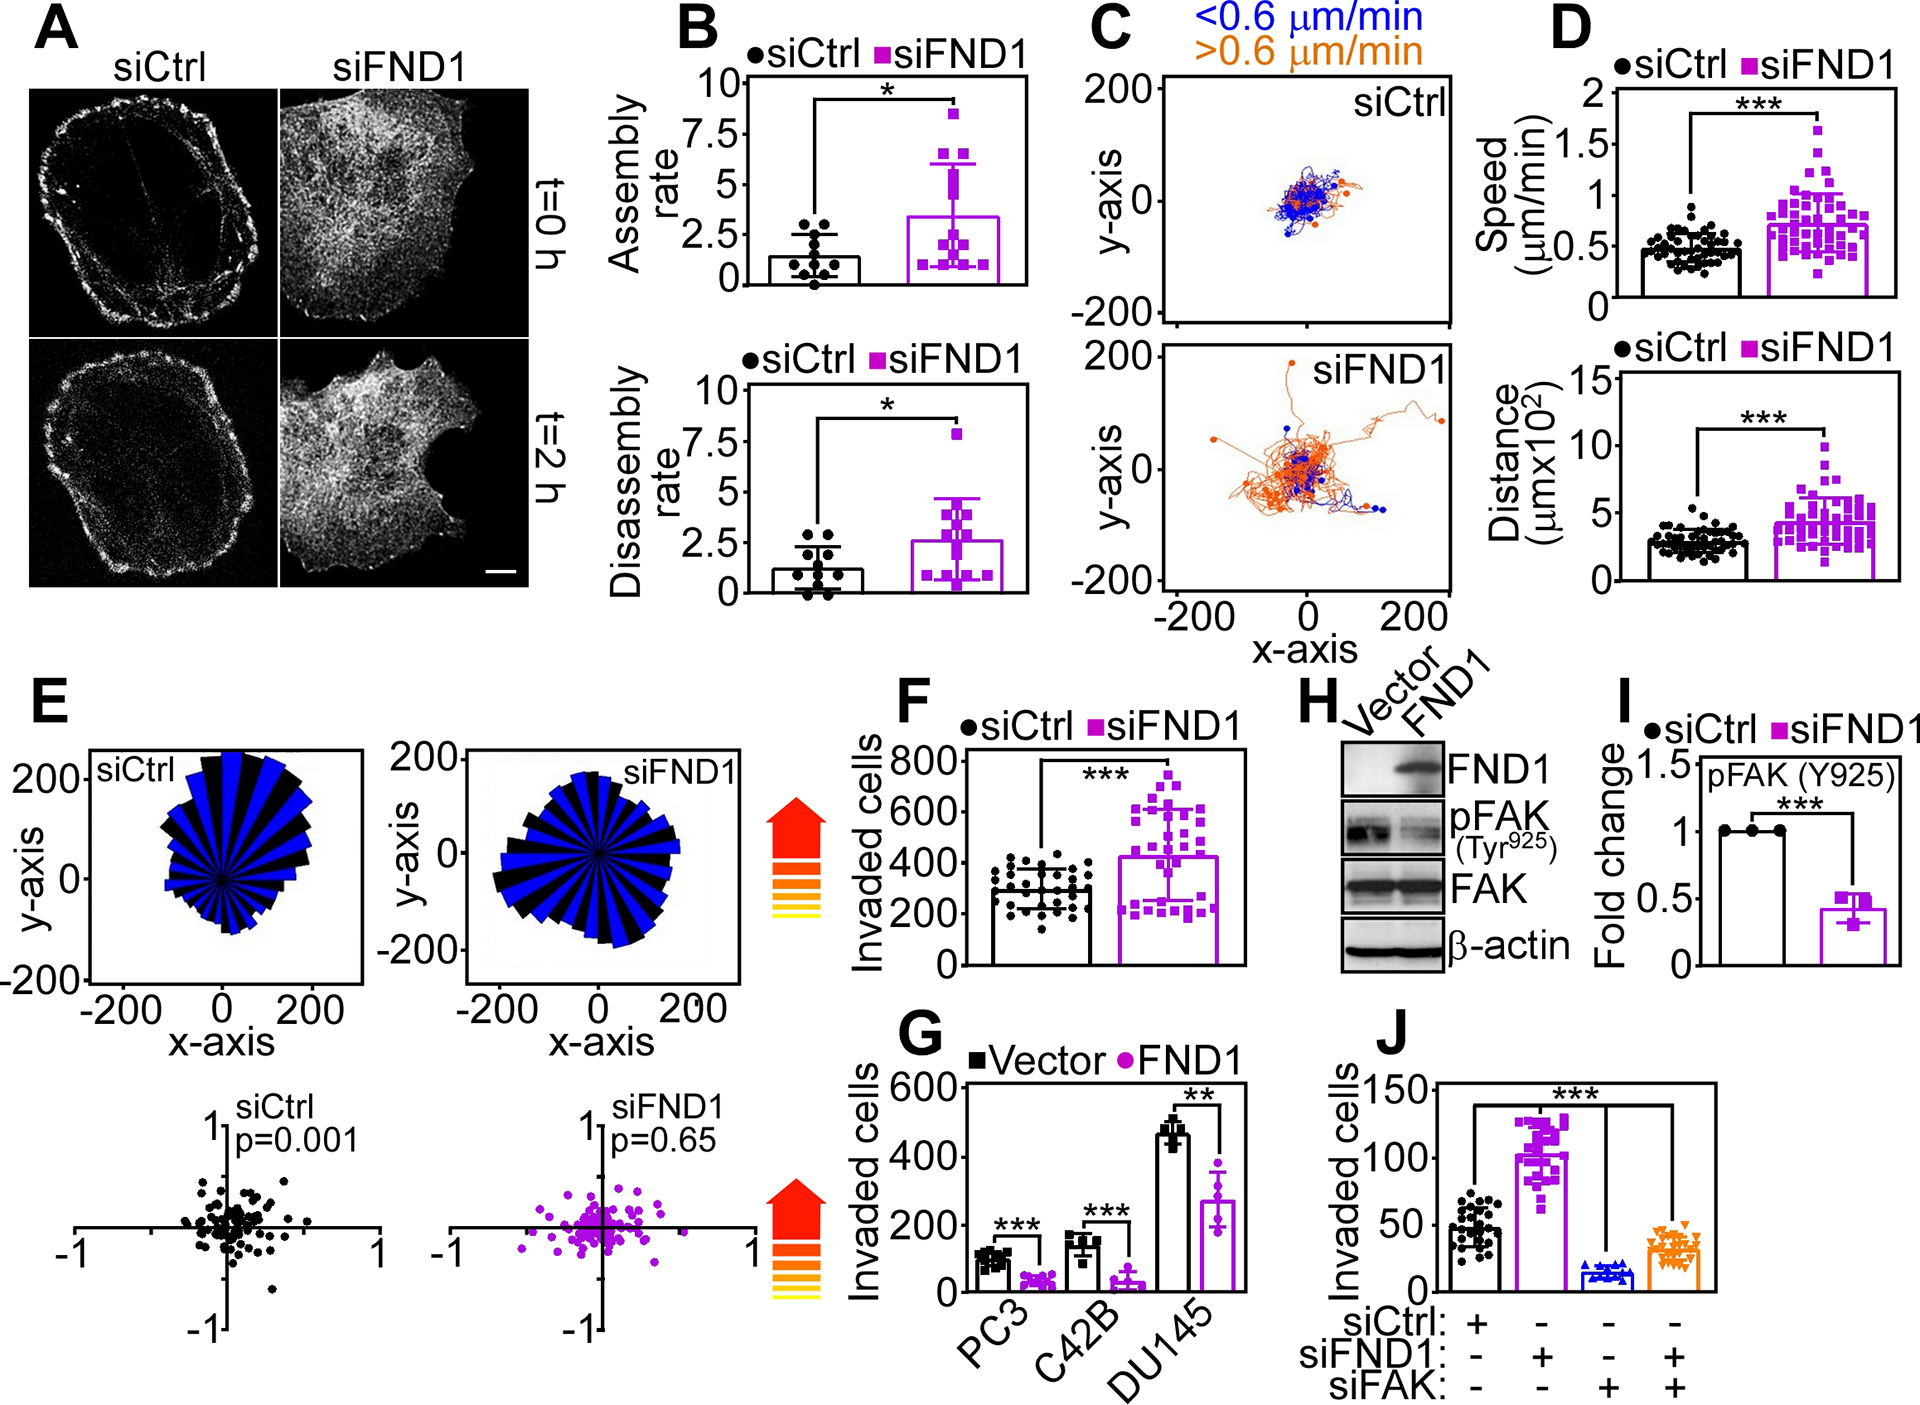
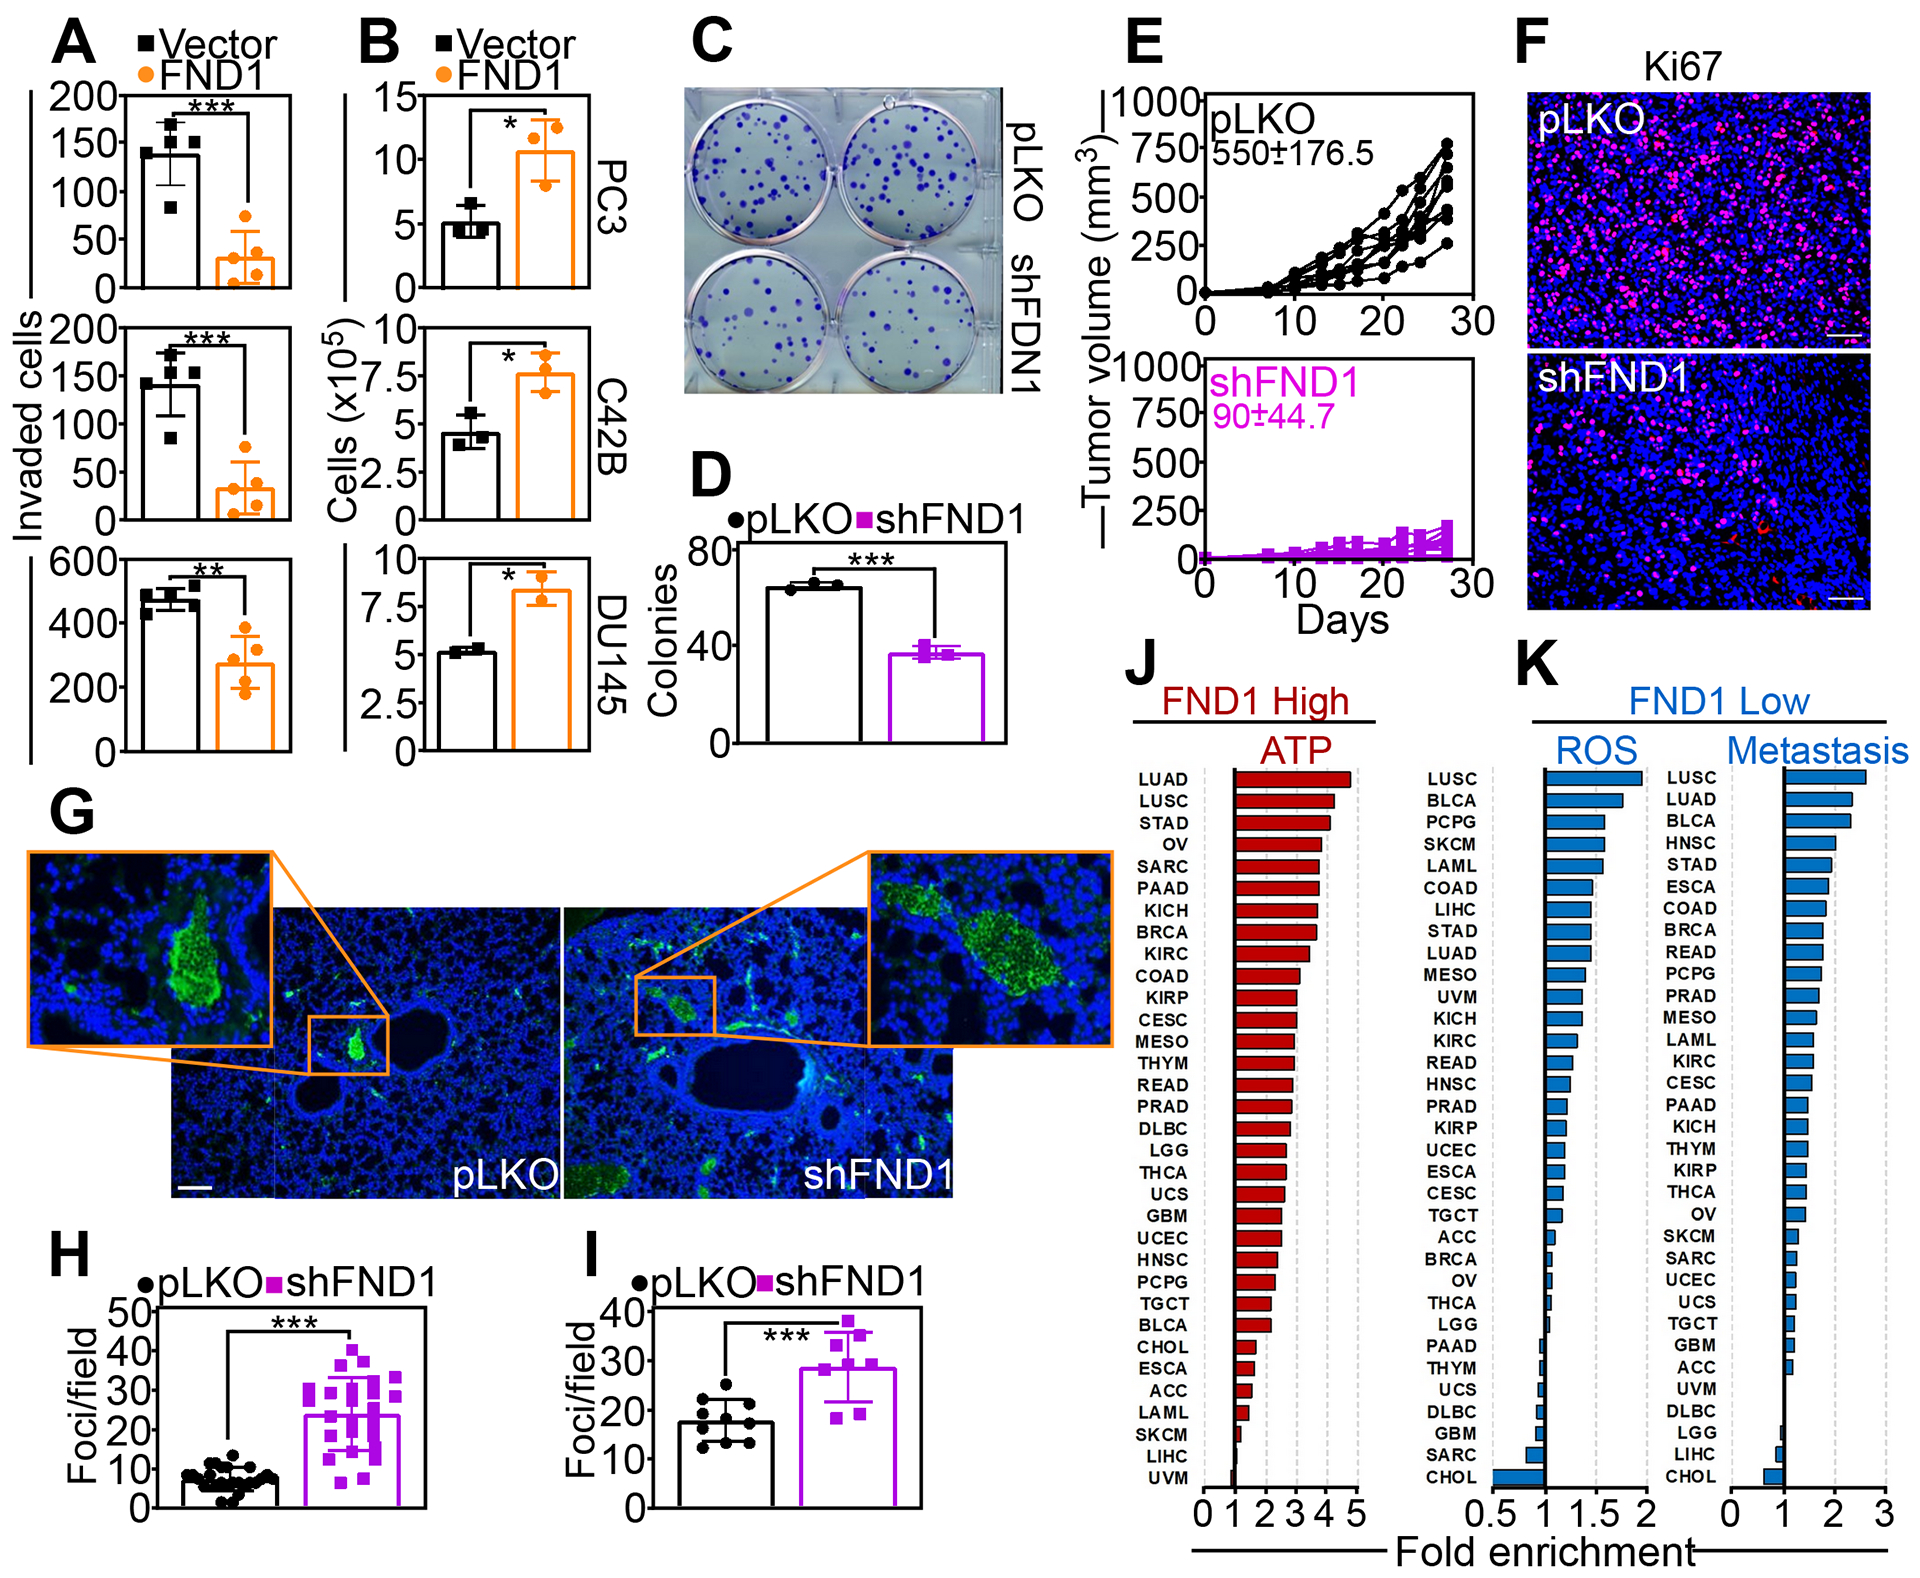
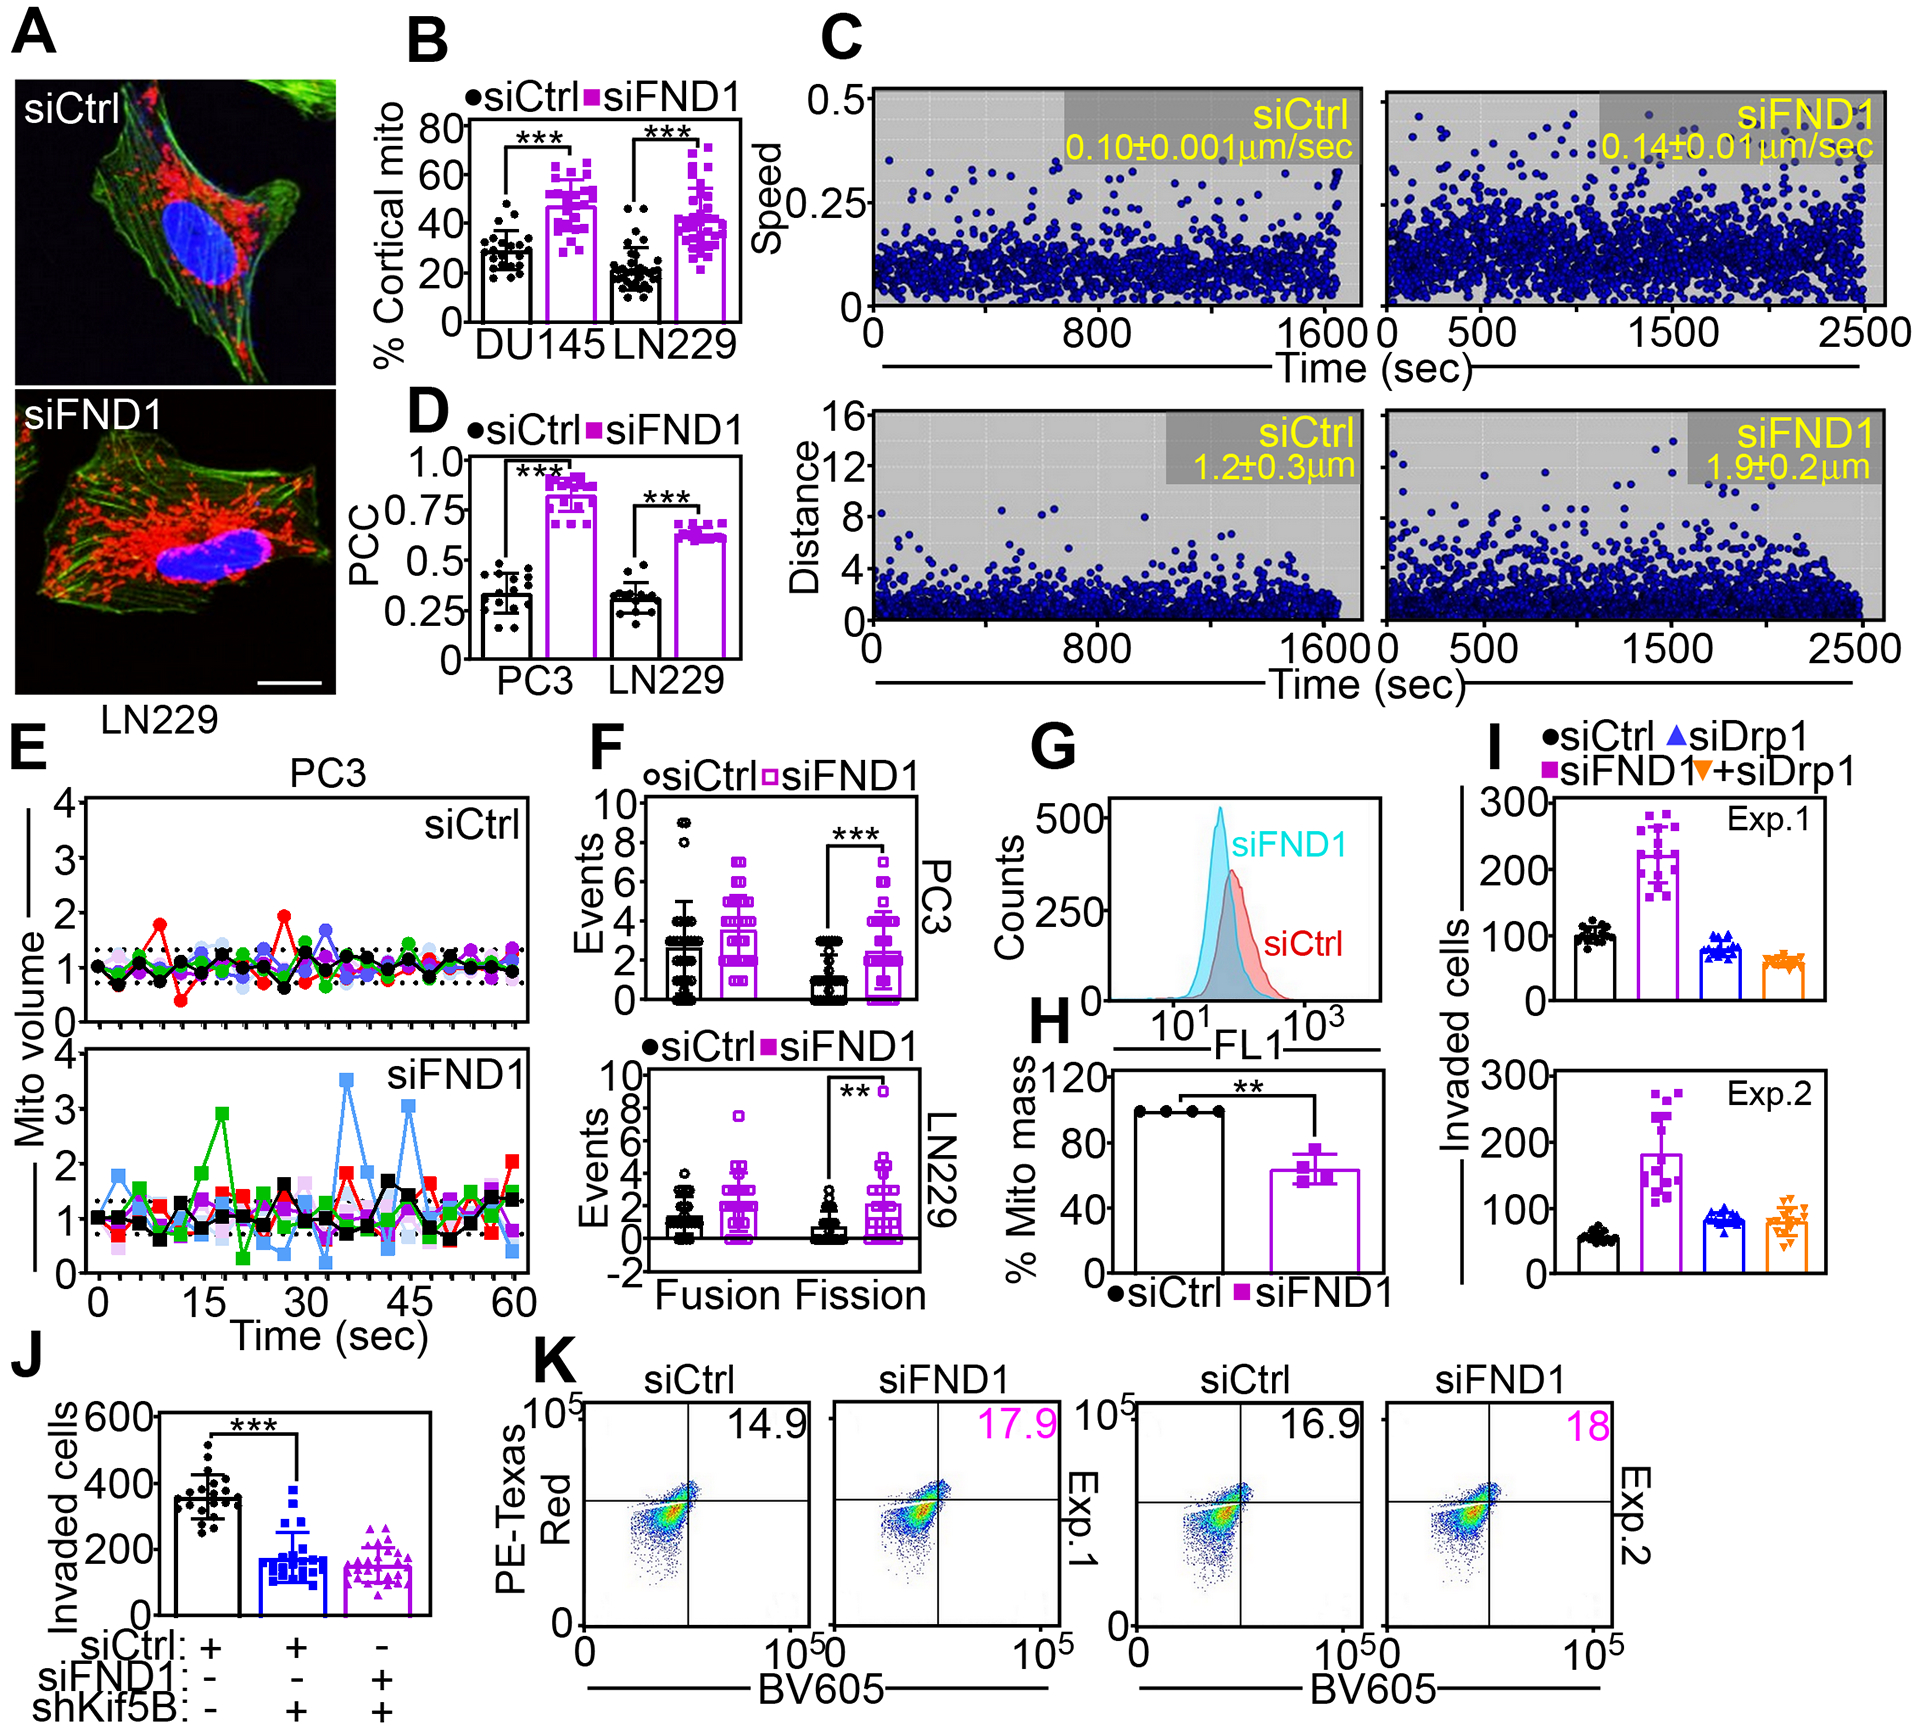
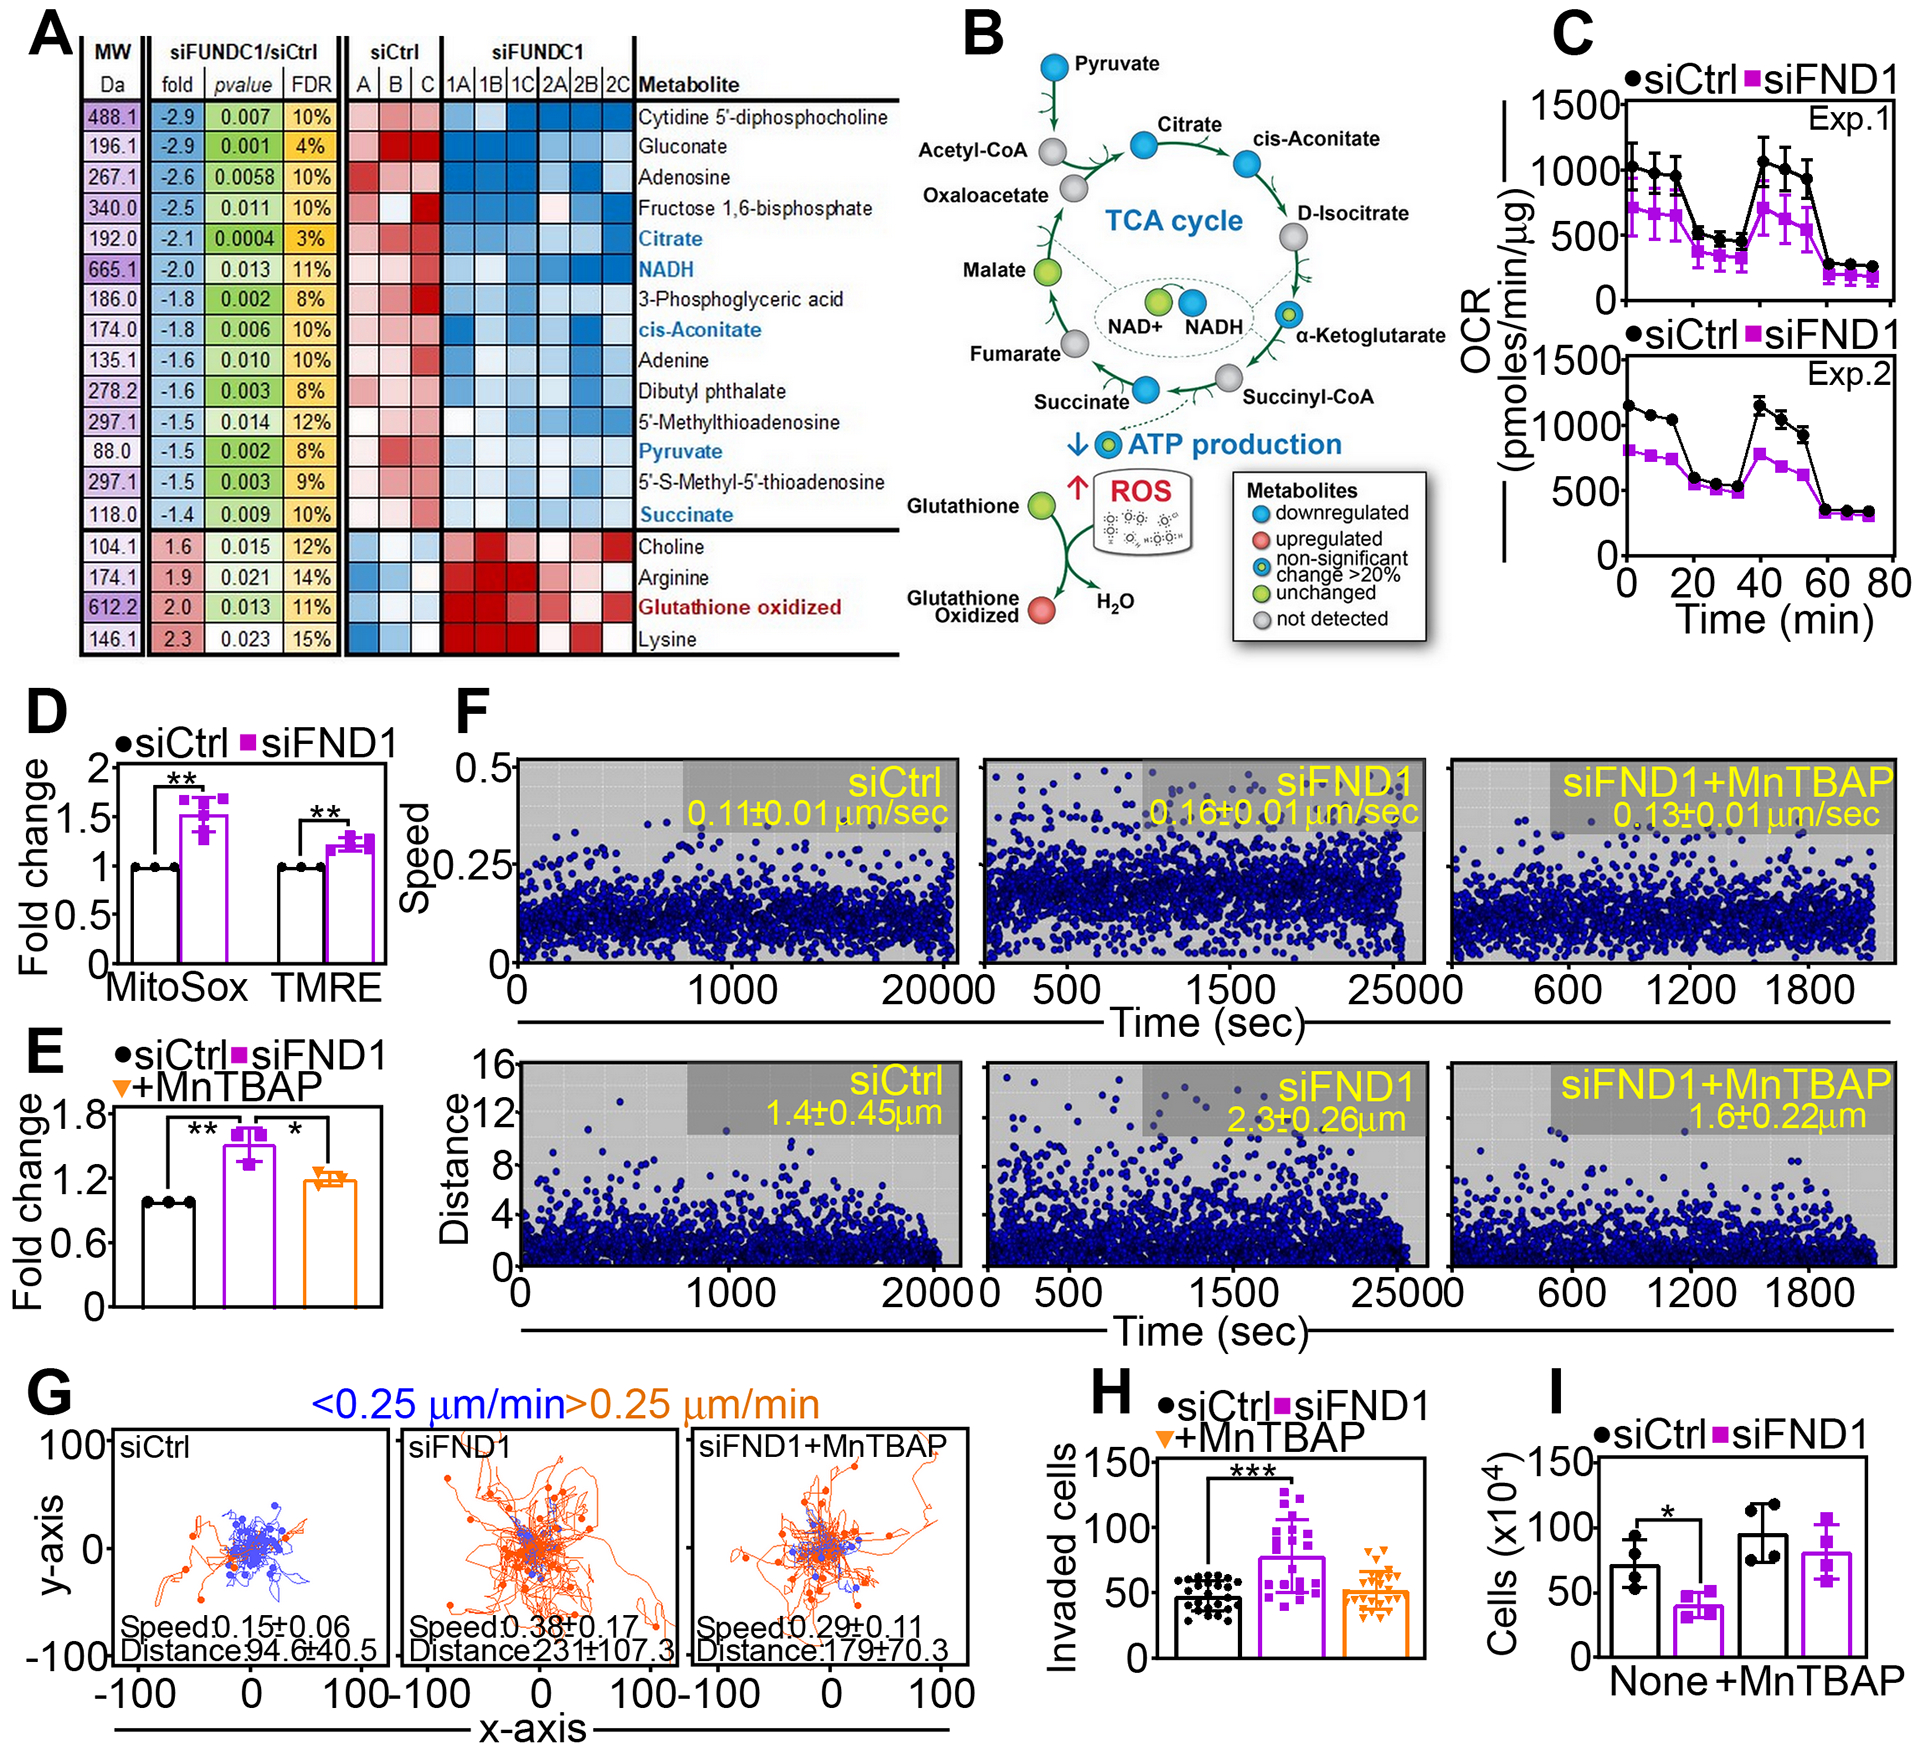
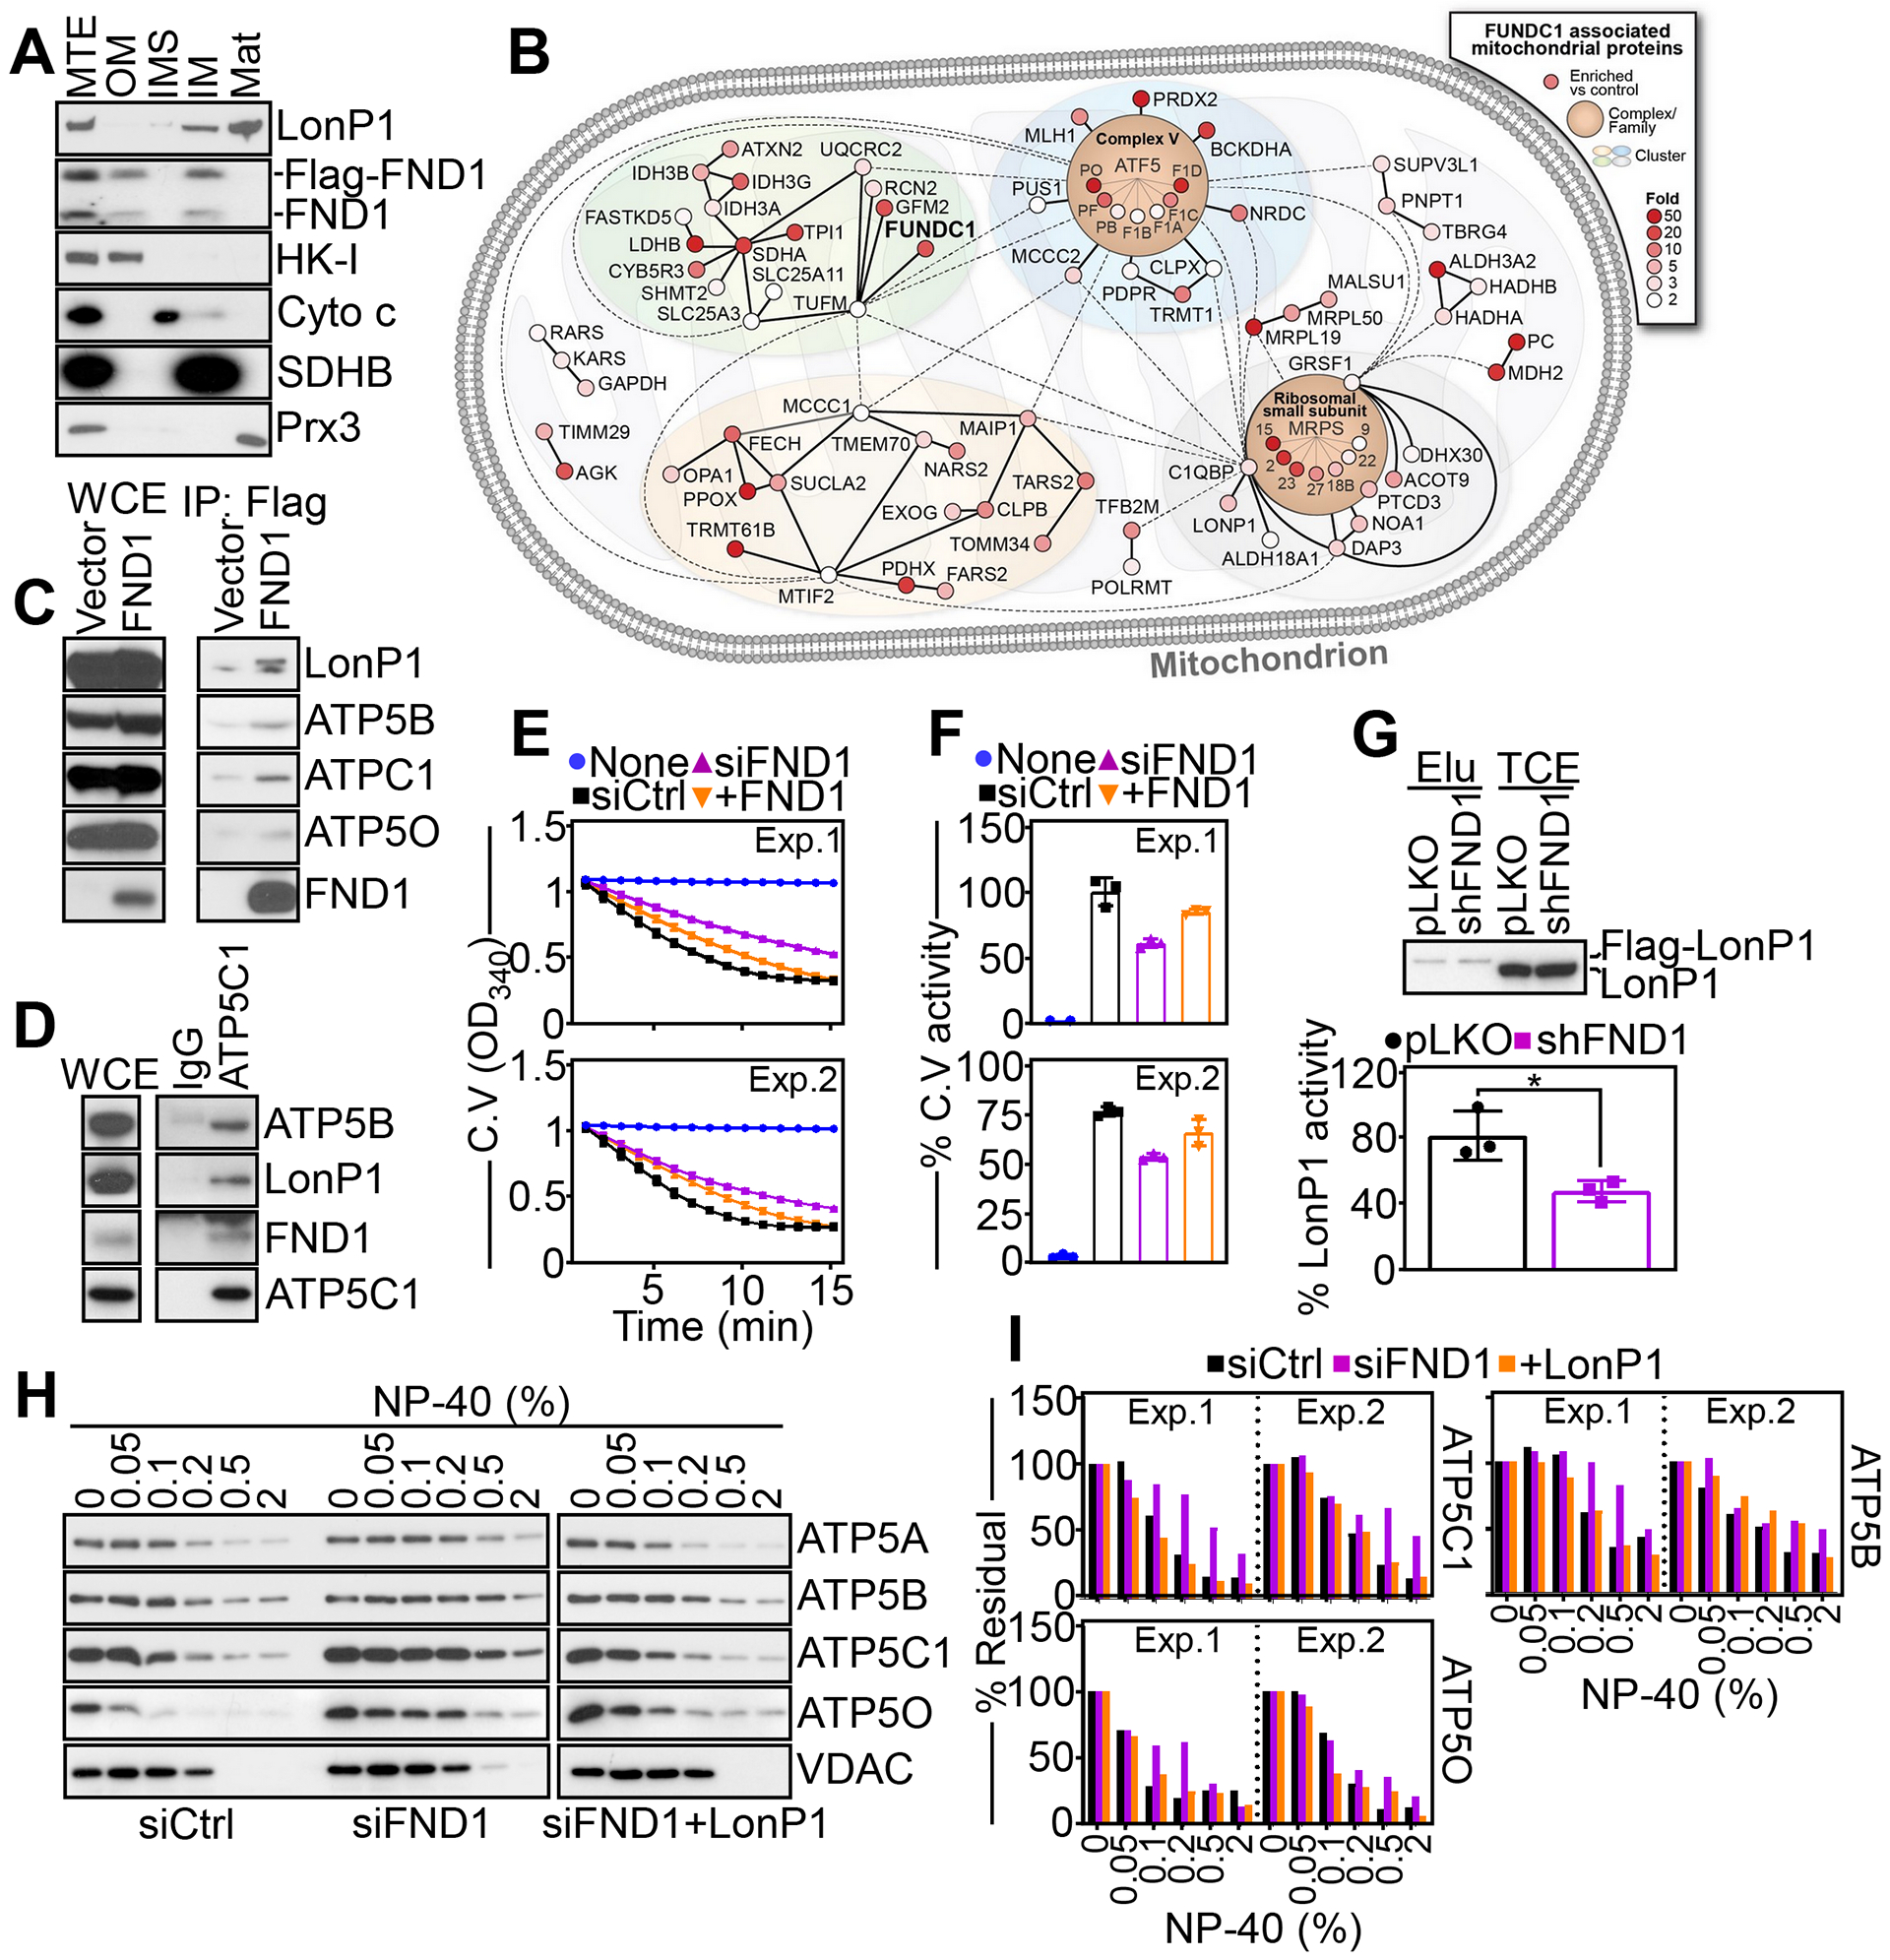
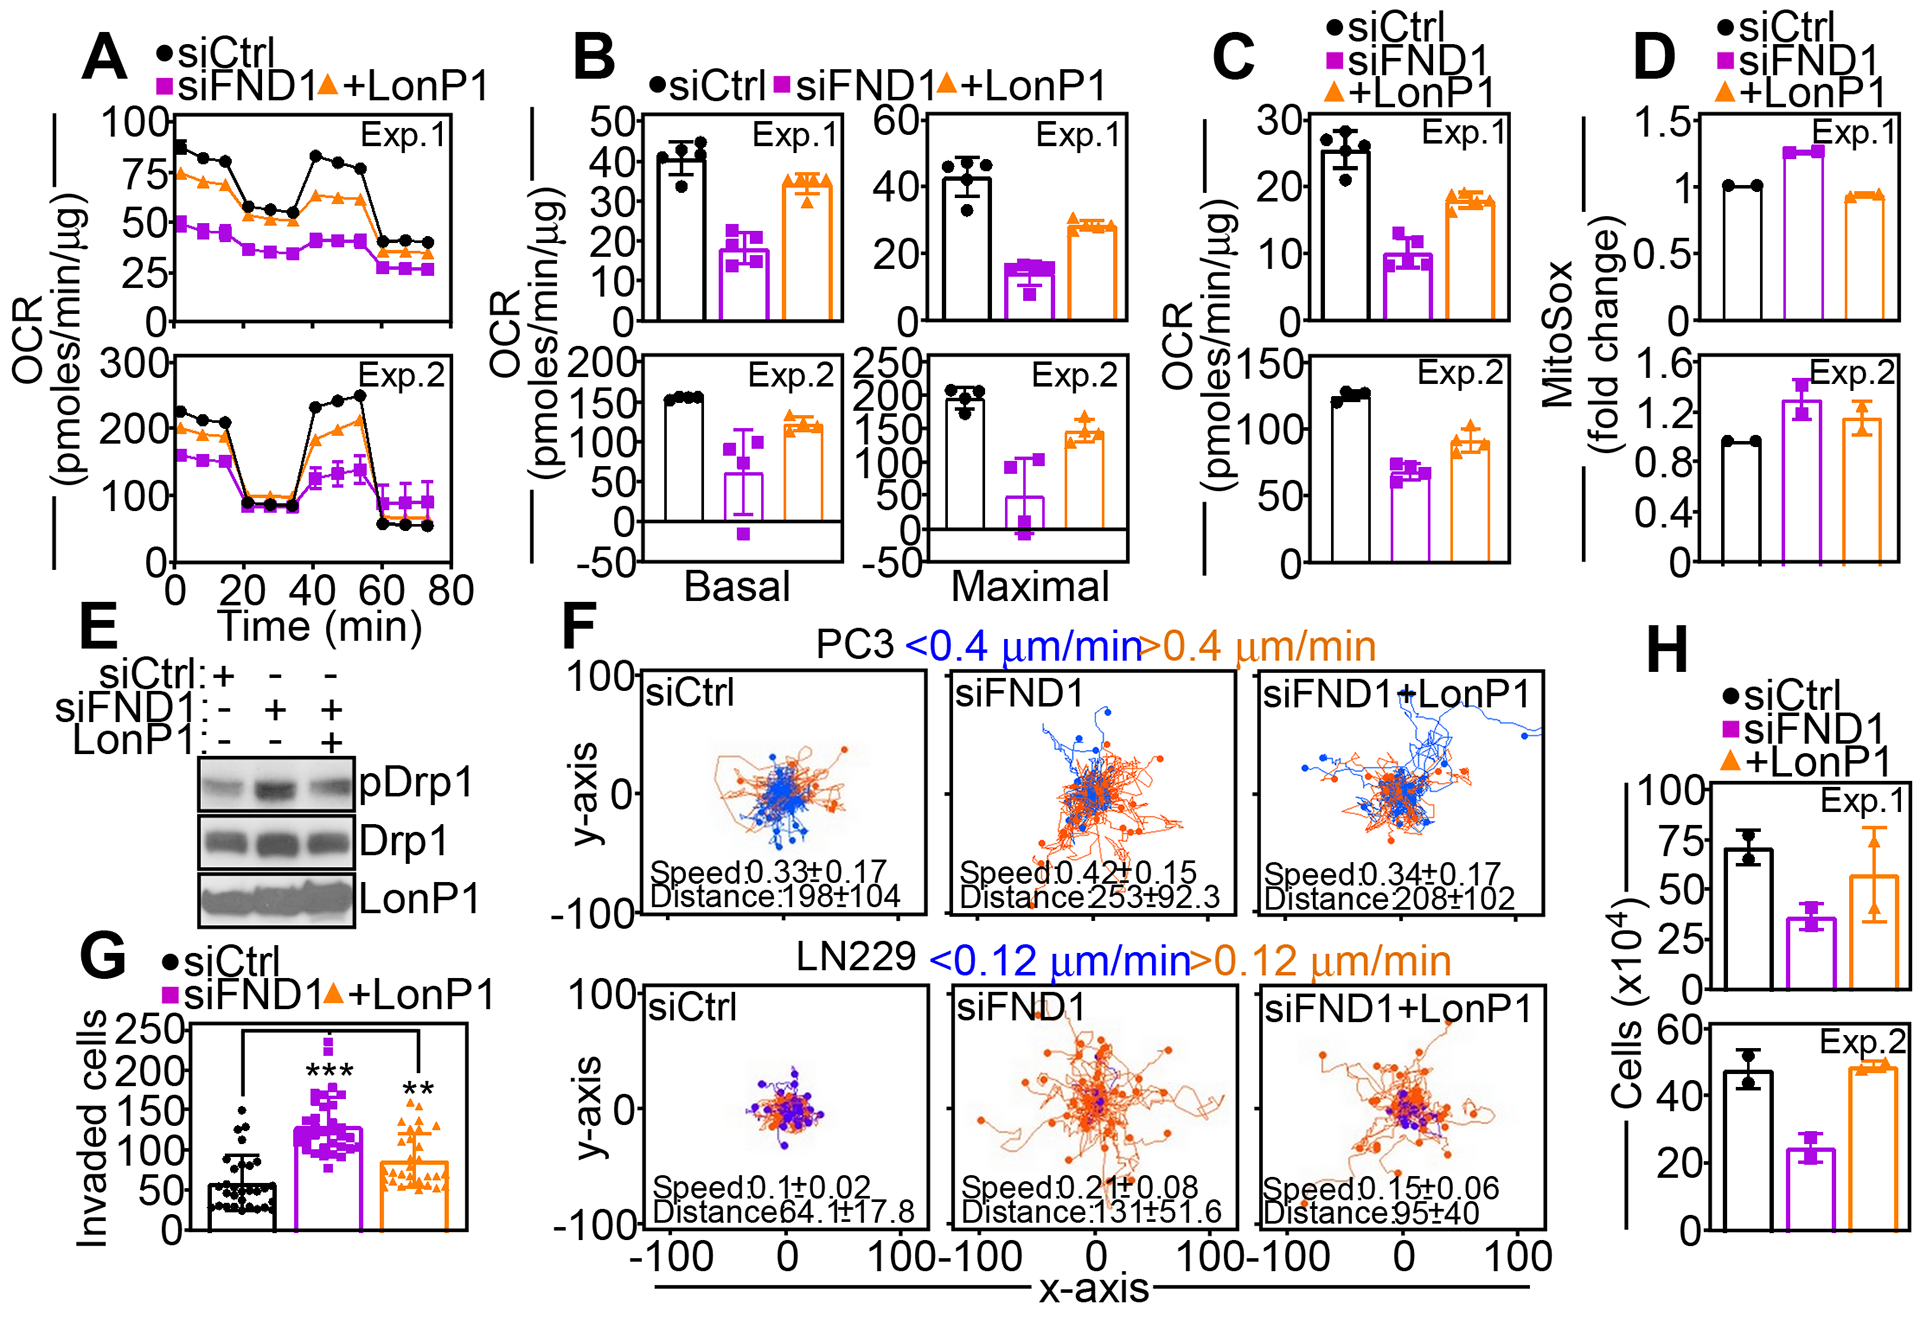
Mitochondria are signaling hubs in eukaryotic cells. Here, we showed that the mitochondrial FUN14 domain-containing protein-1 (FUNDC1), an effector of Parkin-independent mitophagy, also participates in cellular plasticity by sustaining oxidative bioenergetics, buffering ROS production, and supporting cell proliferation. Targeting this pathway in cancer cells suppressed tumor growth but rendered transformed cells more motile and invasive in a manner dependent on ROS-mediated mitochondrial dynamics and mitochondrial repositioning to the cortical cytoskeleton. Global metabolomics and proteomics profiling identified a FUNDC1 interactome at the mitochondrial inner membrane, comprising the AAA+ protease, LonP1, and subunits of oxidative phosphorylation, complex V (ATP synthase). Independently of its previously identified role in mitophagy, FUNDC1 enabled LonP1 proteostasis, which in turn preserved complex V function and decreased ROS generation. Therefore, mitochondrial reprogramming by a FUNDC1-LonP1 axis controls tumor cell plasticity by switching between proliferative and invasive states in cancer.


Conflict of interest statement

COMPETING INTERESTS

The authors declare that they have no competing interests.

Figures

Fig. 1.
Fig. 1.. FUNDC1 regulates tumor cell movements.
(A) PC3 cells transfected with control non-targeting siRNA (siCtrl) or FUNDC1-directed pooled siRNA (siFND1) were labeled with Talin-RFP and analyzed for focal adhesion (FA) dynamics by time-lapse videomicroscopy. Representative images at 0 h and 2 h from 3 independent experiments are shown. (B) The rate (events/h) of FA assembly (top) or disassembly (bottom) was quantified from the cells in (A). Each point corresponds to FA events in an individual cell (11–14 cells per condition). Mean±SD (N=3 independent experiments per group). *, p=0.02–0.04. (C and D) PC3 cells transfected with siCtrl or siFND1 were analyzed for cell motility in 2D contour plots by time-lapse video microscopy (C) with quantification of speed of cell movements (D, top) and distance traveled by individual cells (D, bottom). Each tracing in (C) corresponds to the movements of an individual cell (49 cells per condition) in a representative experiment. The cutoff velocities for slow (blue, <0.6 μm/min)- or fast (orange, >0.6 μm/min)-moving cells are indicated. Mean±SD (N=3 independent experiments per group). ***, p<0.0001. (E) PC3 cells transfected with siCtrl or siFND1 were analyzed for 2D chemotaxis in a rose plot (top) with quantification of the forward migration index (bottom). Arrows indicate the direction of the chemotactic gradient. Each point corresponds to an individual cell (89 cells per condition; N=3 independent experiments per group). (F) PC3 cells transfected with siCtrl or siFND1 were analyzed for invasion across Matrigel-coated Transwell inserts. Each point corresponds to an individual determination. Mean±SD (N=3 independent experiments per group). ***, p=0.0001. (G) The indicated prostate cancer cell lines were transfected with vector or FND1 cDNA and analyzed for Matrigel invasion. Mean±SD (N=3 independent experiments per group). **, p=0.001; ***, p <0.0001 – 0.0005. (H and I) PC3 cells transfected with vector or FND1 cDNA were analyzed by Western blotting (H, representative blot of three independent experiments) and the intensity of phosphorylated (p) FAK protein band was quantified by densitometry (I). Mean±SD (N=3 independent experiments per group). ***, p=0.0008. (J) PC3 cells transfected with siCtrl or siFND1 were analyzed for Matrigel invasion in the presence or absence of FAK-directed siRNA (siFAK). Mean±SD (N=3 independent experiments per group). ***, p<0.0001.
Fig. 2.
Fig. 2.. Dual regulation of primary and metastatic tumor growth by FUNDC1.
(A and B) PC3 (top), C42B (middle) or DU145 (bottom) cells were transfected with vector or FND1 cDNA and analyzed for Matrigel invasion (A) or cell proliferation by direct cell counting (B). Mean±SD (N=3 or 5 independent experiments per condition). **, p=0.001; ***, p <0.0001–0.0005. (C and D) PC3 cells stably transduced with pLKO or FUNDC1-directed shRNA (shFND1) were analyzed for colony formation (C) and quantified after 14 d (D). Mean±SD (N=3 independent experiments per group). ***, p<0.0001. (E) PC3 cells transduced with pLKO or shFND1 were engrafted subcutaneously onto the flanks of immunocompromised mice (N=10 animals/group) and tumor growth was quantified at the indicated time intervals. Each line corresponds to an individual tumor. The mean±SD tumor size (mm3) for each animal group harvested at day 27 is indicated, p<0.0001. (F) Representative tumor samples from each animal group in (E) were excised at the end of the experiment and analyzed for Ki67 staining by immunohistochemistry. Representative images are shown. Scale bar, 100 μm. (G and H) Representative lung samples isolated from each animal group in (E) were stained with an antibody to human mitochondria by immunohistochemistry (G, representative images) and the number of lung metastatic foci was quantified (H). Scale bar, 100 μm. Mean±SD (N=25 determinations per group). ***, p<0.0001. (I) PC3 cells stably transduced with pLKO or shFND1 were injected into the spleen of immunocompromised mice (N=5 animals per group) and metastatic foci to the liver were quantified after 11 days by histology. Mean±SD (N=8–10 determinations per group). ***, p=0.0009. (J and K) RNA-seq expression data from 33 cancer types (TCGA) for genes (Spearman r>0.2; p<0.05) positively (J, GO:0046034, ATP metabolism) or negatively (K, GO:0000302, response to ROS; GO:0048870, cell motility; GO:0008283, cell proliferation) correlated with FUNDC1 (FND1) expression.
Fig. 3.
Fig. 3.. FUNDC1 controls mitochondrial dynamics.
(A and B) DU145 or LN229 cells transfected with siCtrl or siFND1 were imaged for subcellular mitochondrial localization (A, representative images for LN229 cells) and mitochondrial accumulation at the cortical cytoskeleton was quantified (B). Each point corresponds to the percentage of cortical mitochondria in an individual cell. Scale bar, 20 μm. Mean±SD (N=3 independent experiments per group). ***, p<0.0001. (C) PC3 cells transfected with siCtrl or siFND1 were analyzed for mitochondrial motility with quantification of speed of mitochondrial movements (top) and distance traveled by individual mitochondria (bottom). Each symbol corresponds to the tracked movement of an individual mitochondrion. Data are representative of 3 independent experiments per group. The mean±SD of mitochondrial speed (siCtrl compared to siFND1, p<0.0001) or distance traveled (siCtrl compared to siFND1, p=0.0008) is indicated. (D) Co-localization of Ser616-phosphorylated Drp1 and MitoTracker was quantified in PC3 or LN229 cells transfected with siCtrl or siFND1. Each point corresponds to an individual cell. PCC, Pearson Correlation Coefficient. Mean±SD (N=3 independent experiments per group). ***, p<0.0001. (E) PC3 cells transfected with siCtrl or siFND1 were analyzed for changes in mitochondrial (Mito) volume representative of mitochondrial fusion (>1.3-fold) or fission (<0.7-fold) by time-lapse videomicroscopy. Each tracing corresponds to an individual cell (6 cells in a representative experiment). Data are representative of 3 independent experiments per group. The cutoff lines are indicated. (F) Mitochondrial fusion or fission events for PC3 (top, 32–33 cells analyzed) or LN229 (bottom, 22–23 cells analyzed) cells were quantified over a 60-sec interval. Each point corresponds to the number of events per cell. Mean±SD (N=3 independent experiments per group). **, p=0.008; ***, p=0.001. (G and H) PC3 cells transfected with siCtrl or siFND1 were analyzed for mitochondrial mass by MitoTracker staining and flow cytometry (G, tracings are from a representative experiment) and quantified (H). Mean±SD (N=4 independent experiments per group). **, p=0.004. (I) PC3 cells transfected with siCtrl or siFND1 were analyzed for Matrigel invasion in the presence or absence of siDrp1. Two independent experiments (Exp) are shown. Mean±SD of 15 technical replicates per experiment. (J) PC3 cells transfected with siCtrl or siFND1 were analyzed for Matrigel invasion in the presence or absence of Kif5B-directed siRNA (siKif5B). Mean±SD (N=3 independent experiments per group). ***, p<0.0001. (K) DU145 cells expressing mitochondrial Keima-Red fluorescence reporter were transfected with siCtrl or siFND1 and analyzed by flow cytometry. The percentage of PE-Texas Red+ cells in the two upper quadrants corresponding to mitophagy are indicated. Two independent experiments (Exp) are shown.
Fig. 4.
Fig. 4.. Control of mitochondrial bioenergetics and oxidative stress by FUNDC1.
(A) Heatmap of changes in metabolite levels in PC3 cells transfected with siCtrl or siFND1. Fold changes, p values and false discovery rate (FDR) are indicated. Data are from a representative experiment (siCtrl) or two independent experiments in triplicate (siFND1, 1A-C; 2A-C). (B) Schematic diagram of mitochondrial bioenergetics and ROS pathways affected by FUNDC1 silencing as in (A). (C) PC3 cells transfected with siCtrl or siFND1were analyzed for oxygen consumption rates (OCR) on a Seahorse XFe96 Bioenergetics Flux Analyzer. Tracings from two independent experiments (Exp) are shown. Mean±SD of 3 technical replicates per experiment. (D) PC3 cells transfected with siCtrl or siFND1were analyzed for MitoSox reactivity and mitochondrial membrane potential (TMRE) by flow cytometry. Mean±SD (N=3–4 independent experiments per group). **, p=0.001. (E) PC3 cells transfected with siCtrl or siFND1were analyzed for MitoSox reactivity in the presence or absence of the superoxide scavenger, MnTBAP, by flow cytometry. Mean±SD (N=3 independent experiments per group). **, p=0.005; *, p=0.03. (F) PC3 cells transfected with siCtrl or siFND1were analyzed for speed of mitochondrial movements (top) or distance traveled by individual mitochondria (bottom) with or without MnTBAP. Each symbol corresponds to the tracked movement of an individual mitochondrion. Data are representative of 3 independent experiments. The mean±SD of mitochondrial speed (siCtrl compared to siFND1, p<0.0001; siFND1 compared to siFND1+MnTBAP, p=0.002) and distance traveled (siCtrl compared to siFND1, p=0.001; siFND1 compared to siFND1+MnTBAP, p=0.0005) are indicated. (G) siCtrl- or siFND1-transfected PC3 cells were analyzed for cellular motility in 2D contour plots in the presence or absence of MnTBAP. Each tracing corresponds to the movements of an individual cell. The cut-off velocities for slow (<0.25 μm/min)- or fast (>0.25 μm/min)-moving cells are indicated. Data are representative of 3 independent experiments per group. The speed (μm/min) of cell motility (siCtrl compared to siFND1, p<0.0001; siFND1 compared to siFND1+MnTBAP, p=0.006) and distance (μm) traveled (siCtrl compared to siFND1, p<0.0001; siFND1 compared to siFND1+MnTBAP, p=0.006) are indicated. (H) PC3 cells transfected with siCtrl or siFND1 were analyzed for Matrigel invasion in the presence or absence of MnTBAP. Mean±SD (N=3 independent experiments per group). ***, p<0.0001. (I) PC3 cells transfected with siCtrl or siFND1 were analyzed for cell proliferation in the presence or absence of MnTBAP by direct cell counting. Mean±SD (N=4 independent experiments per group). **, p=0.03.
Fig. 5.
Fig. 5.. A FUNDC1-LonP1 complex regulates mitochondrial complex V activity.
(A) PC3 cells were fractionated in submitochondrial compartments and analyzed by Western blotting. MTE, mitochondrial extracts; OM, outer membrane; IM, inner membrane; IMS, intermembrane space; Mat, matrix. Data are representative of 2 independent experiments. (B) Ingenuity pathway analysis of a mitochondrial FUNDC1 interactome identified by LC-MS/MS proteomics (N=1 independent experiment). The fold-induction for FUNDC1-associated proteins compared to Flag-vector are indicated with red color intensity. (C) PC3 cells transfected with Flag-vector or Flag-FND1 cDNA were immunoprecipitated (IP) with an antibody to Flag and immune complexes were analyzed by Western blotting. Data are representative of 2 independent experiments. WCE, whole cell extracts. (D) PC3 cells were immunoprecipitated with non-binding IgG or an antibody to endogenous ATP5C1 and immune complexes were analyzed by Western blotting. Data are representative of 2 independent experiments. WCE, whole cell extracts. (E) PC3 cells transfected with siCtrl or siFND1 were reconstituted with FND1 cDNA and analyzed for complex V (C.V) activity. Tracings from two independent experiments (Exp) are shown. Mean±SD of 3 technical replicates per experiment. (F) Citrate synthase-normalized complex V (C.V) activity as in (E) was quantified. Two independent experiments (Exp) are shown. Mean±SD of 3 technical replicates per experiment. (G) PC3 cells stably transduced with pLKO or shFND1 were reconstituted with Flag-LonP1 cDNA, and Flag-eluted LonP1 immune complexes (Elu) (top, representative blot of 3 independent experiments) were analyzed for LonP1 proteolytic activity (bottom). TCE, total cell extracts. Mean±SD (N=3 independent experiments per group). (H and I) PC3 cells transfected with siCtrl or siFND1 were reconstituted with LonP1 cDNA, extracted at increasing concentrations of NP-40 and detergent-insoluble protein bands corresponding to complex V subunits, ATP5C1, ATP5O and ATP5B were analyzed by Western blotting (H, representative blot of 2 independent experiments) and quantified by densitometry (I). VDAC was a control. Two independent experiments (Exp) are shown (I).
Fig. 6.
Fig. 6.. A FUNDC1-LonP1 complex regulates tumor plasticity.
(A) PC3 cells transfected with siCtrl or siFND1 were reconstituted with LonP1 cDNA and analyzed for oxygen consumption rates (OCR) on a Seahorse XFe96 Bioenergetics Flux Analyzer. Tracings from two independent experiments (Exp) are shown. Mean±SD of 5 technical replicates per experiment. (B) PC3 cells reconstituted as in (A) were analyzed for basal (left) and maximal (right) respiration. Two independent experiments (Exp) are shown. Mean±SD of 5 technical replicates per experiment. (C and D) PC3 cells reconstituted as in (A) were analyzed for rates of ATP production (C) or MitoSox reactivity (D). Two independent experiments (Exp) per condition are shown. Mean±SD of 5 (C) or 2 (D) technical replicates per experiment. (E) PC3 cells reconstituted as in (A) were analyzed by Western blotting. p, phosphorylated. Data are representative of 2 independent experiments. (F) PC3 (top) or LN229 (bottom) cells transfected with siCtrl or siFND1 and reconstituted with LonP1 cDNA were analyzed for cellular motility in 2D contour plots. Each tracing corresponds to the movements of an individual cell. The cut-off velocities for slow (<0.4 or <0.12 μm/min)- or fast (>0.4 or > 0.12 μm/min)-moving cells are indicated. Data are representative of 2 independent experiments. The mean±SD of speed of cell movements (μm/min) and distance traveled (μm) are indicated. (G and H) siRNA-transfected PC3 cells reconstituted with LonP1 cDNA were analyzed for Matrigel invasion (G, Mean±SD of 3 independent experiments per group. *, p=0.01; **, p=0.002; ***, p<0.0001) or cell proliferation by direct cell counting (H, Mean±SD of 2 technical replicates per experiment). Two independent experiments (Exp) are shown.

References

    1. Chandel NS, Evolution of Mitochondria as Signaling Organelles. Cell Metab 22, 204–206 (2015). - PubMed
    1. Bahat A, Gross A, Mitochondria Plasticity in Cell Fate Regulation. J Biol Chem, (2019). - PMC - PubMed
    1. Yuan S, Norgard RJ, Stanger BZ, Cellular Plasticity in Cancer. Cancer Discov 9, 837–851 (2019). - PMC - PubMed
    1. Kim IS, Heilmann S, Kansler ER, Zhang Y, Zimmer M, Ratnakumar K, Bowman RL, Simon-Vermot T, Fennell M, Garippa R, Lu L, Lee W, Hollmann T, Xavier JB, White RM, Microenvironment-derived factors driving metastatic plasticity in melanoma. Nat Commun 8, 14343 (2017). - PMC - PubMed
    1. Tait SW, Green DR, Mitochondria and cell death: outer membrane permeabilization and beyond. Nat Rev Mol Cell Biol 11, 621–632 (2010). - PubMed

Publication types