. 2020 Oct;31(10):2457-2474.
doi: 10.1681/ASN.2020030320. Epub 2020 Jul 28.

Coordinated Circulating T Follicular Helper and Activated B Cell Responses Underlie the Onset of Antibody-Mediated Rejection in Kidney Transplantation

Affiliations

Coordinated Circulating T Follicular Helper and Activated B Cell Responses Underlie the Onset of Antibody-Mediated Rejection in Kidney Transplantation

Kevin Louis et al. J Am Soc Nephrol. 2020 Oct.

Abstract

Background: Although antibody-mediated rejection (ABMR) has been long recognized as a leading cause of allograft failure after kidney transplantation, the cellular and molecular processes underlying the induction of deleterious donor-specific antibody (DSA) responses remain poorly understood.

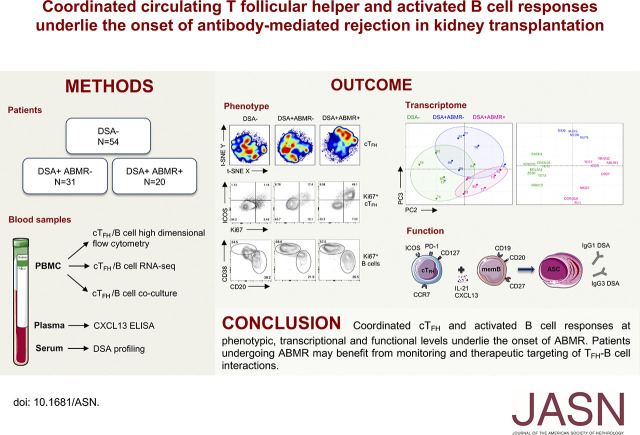
Methods: Using high-dimensional flow cytometry, in vitro assays, and RNA sequencing, we concomitantly investigated the role of T follicular helper (TFH) cells and B cells during ABMR in 105 kidney transplant recipients.

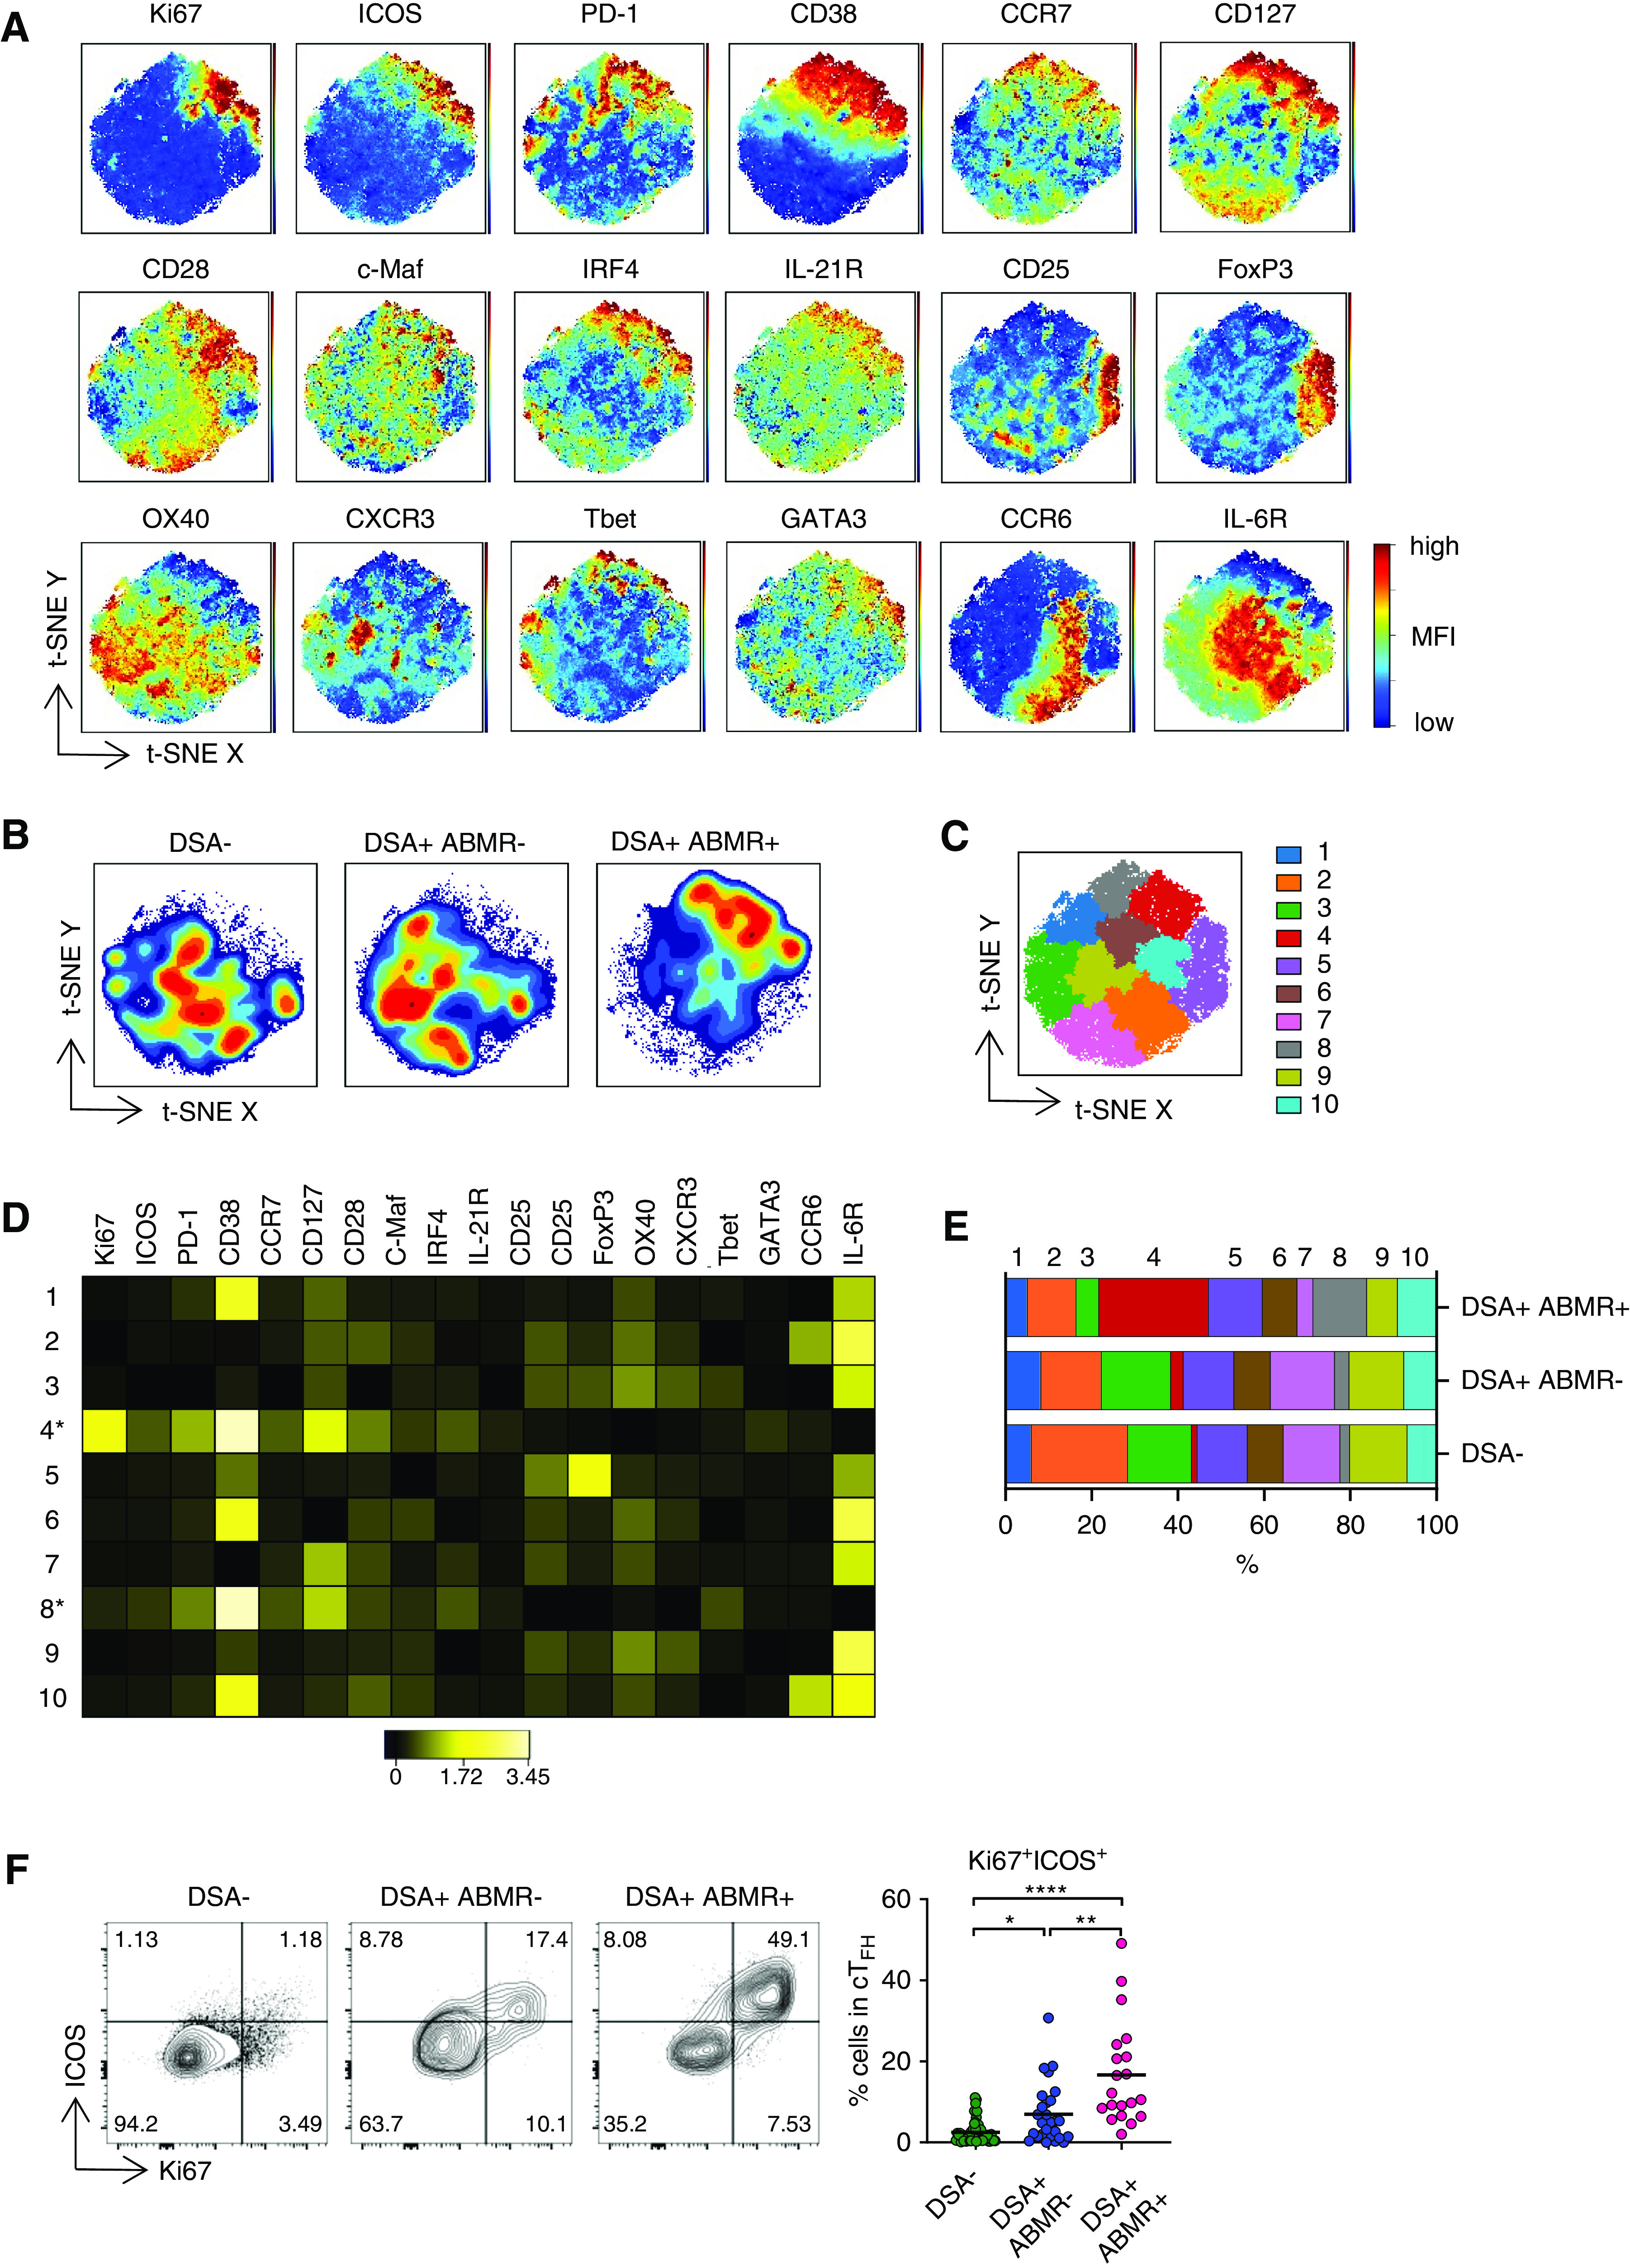
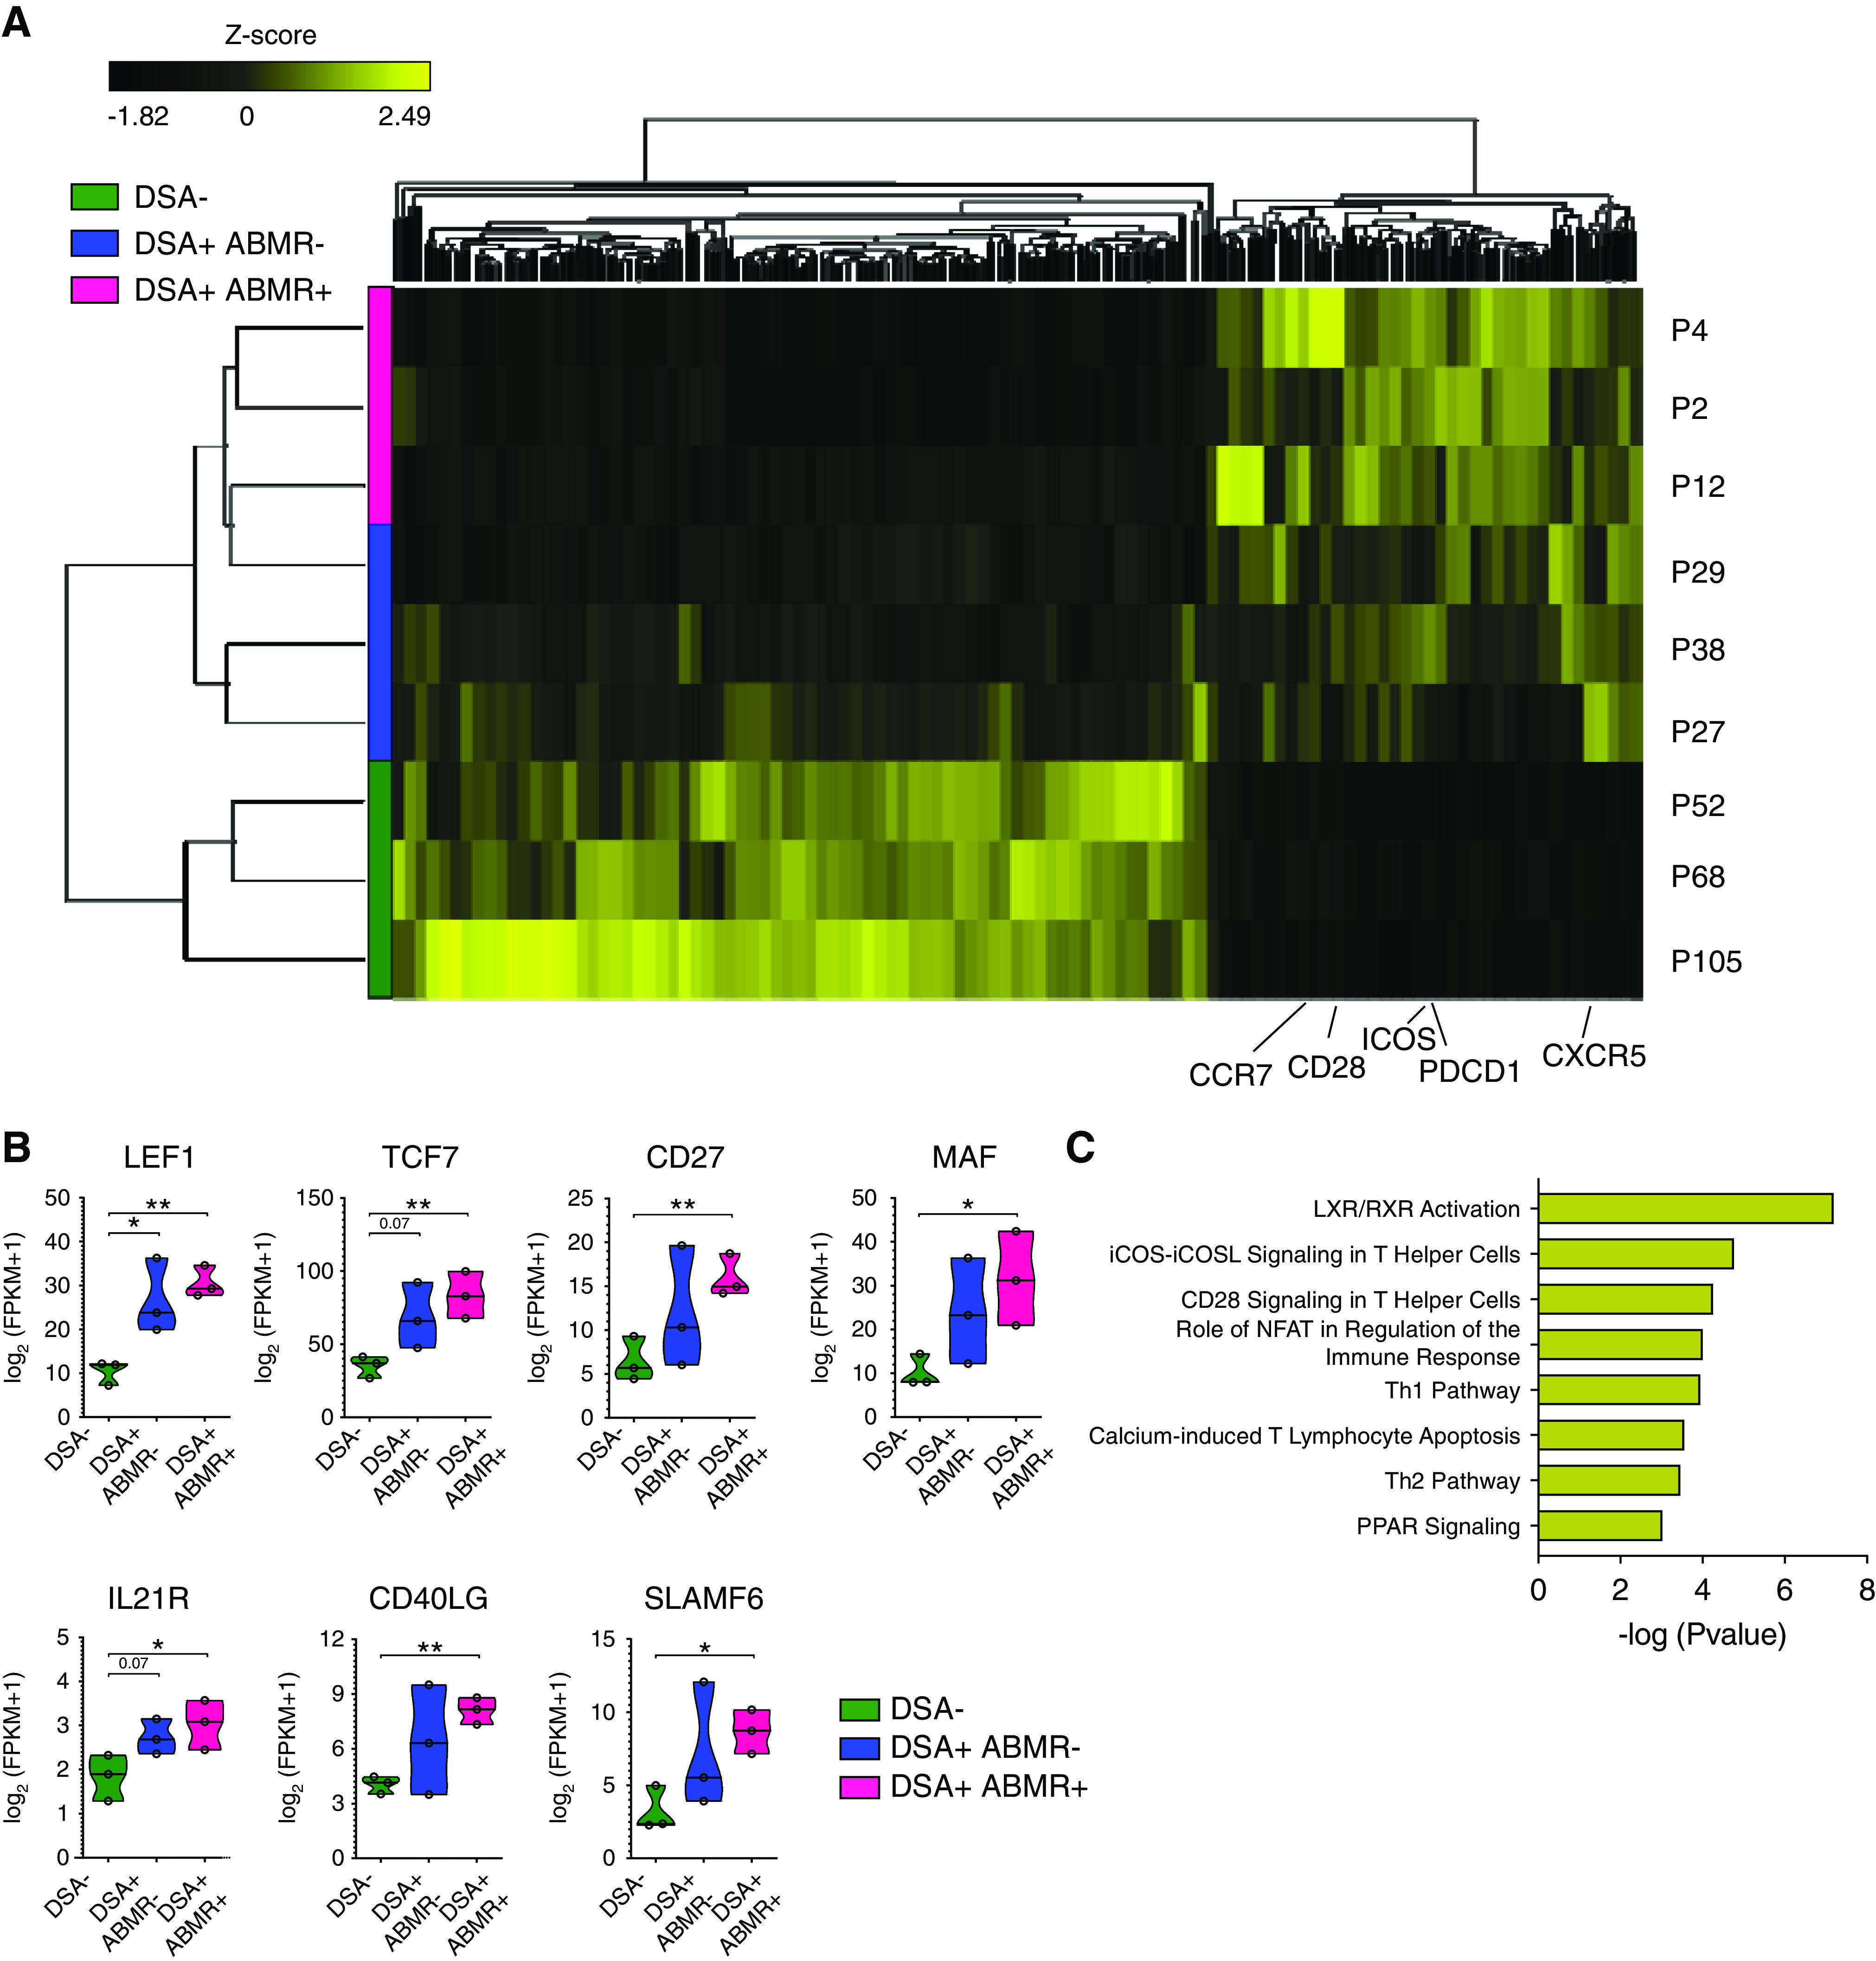
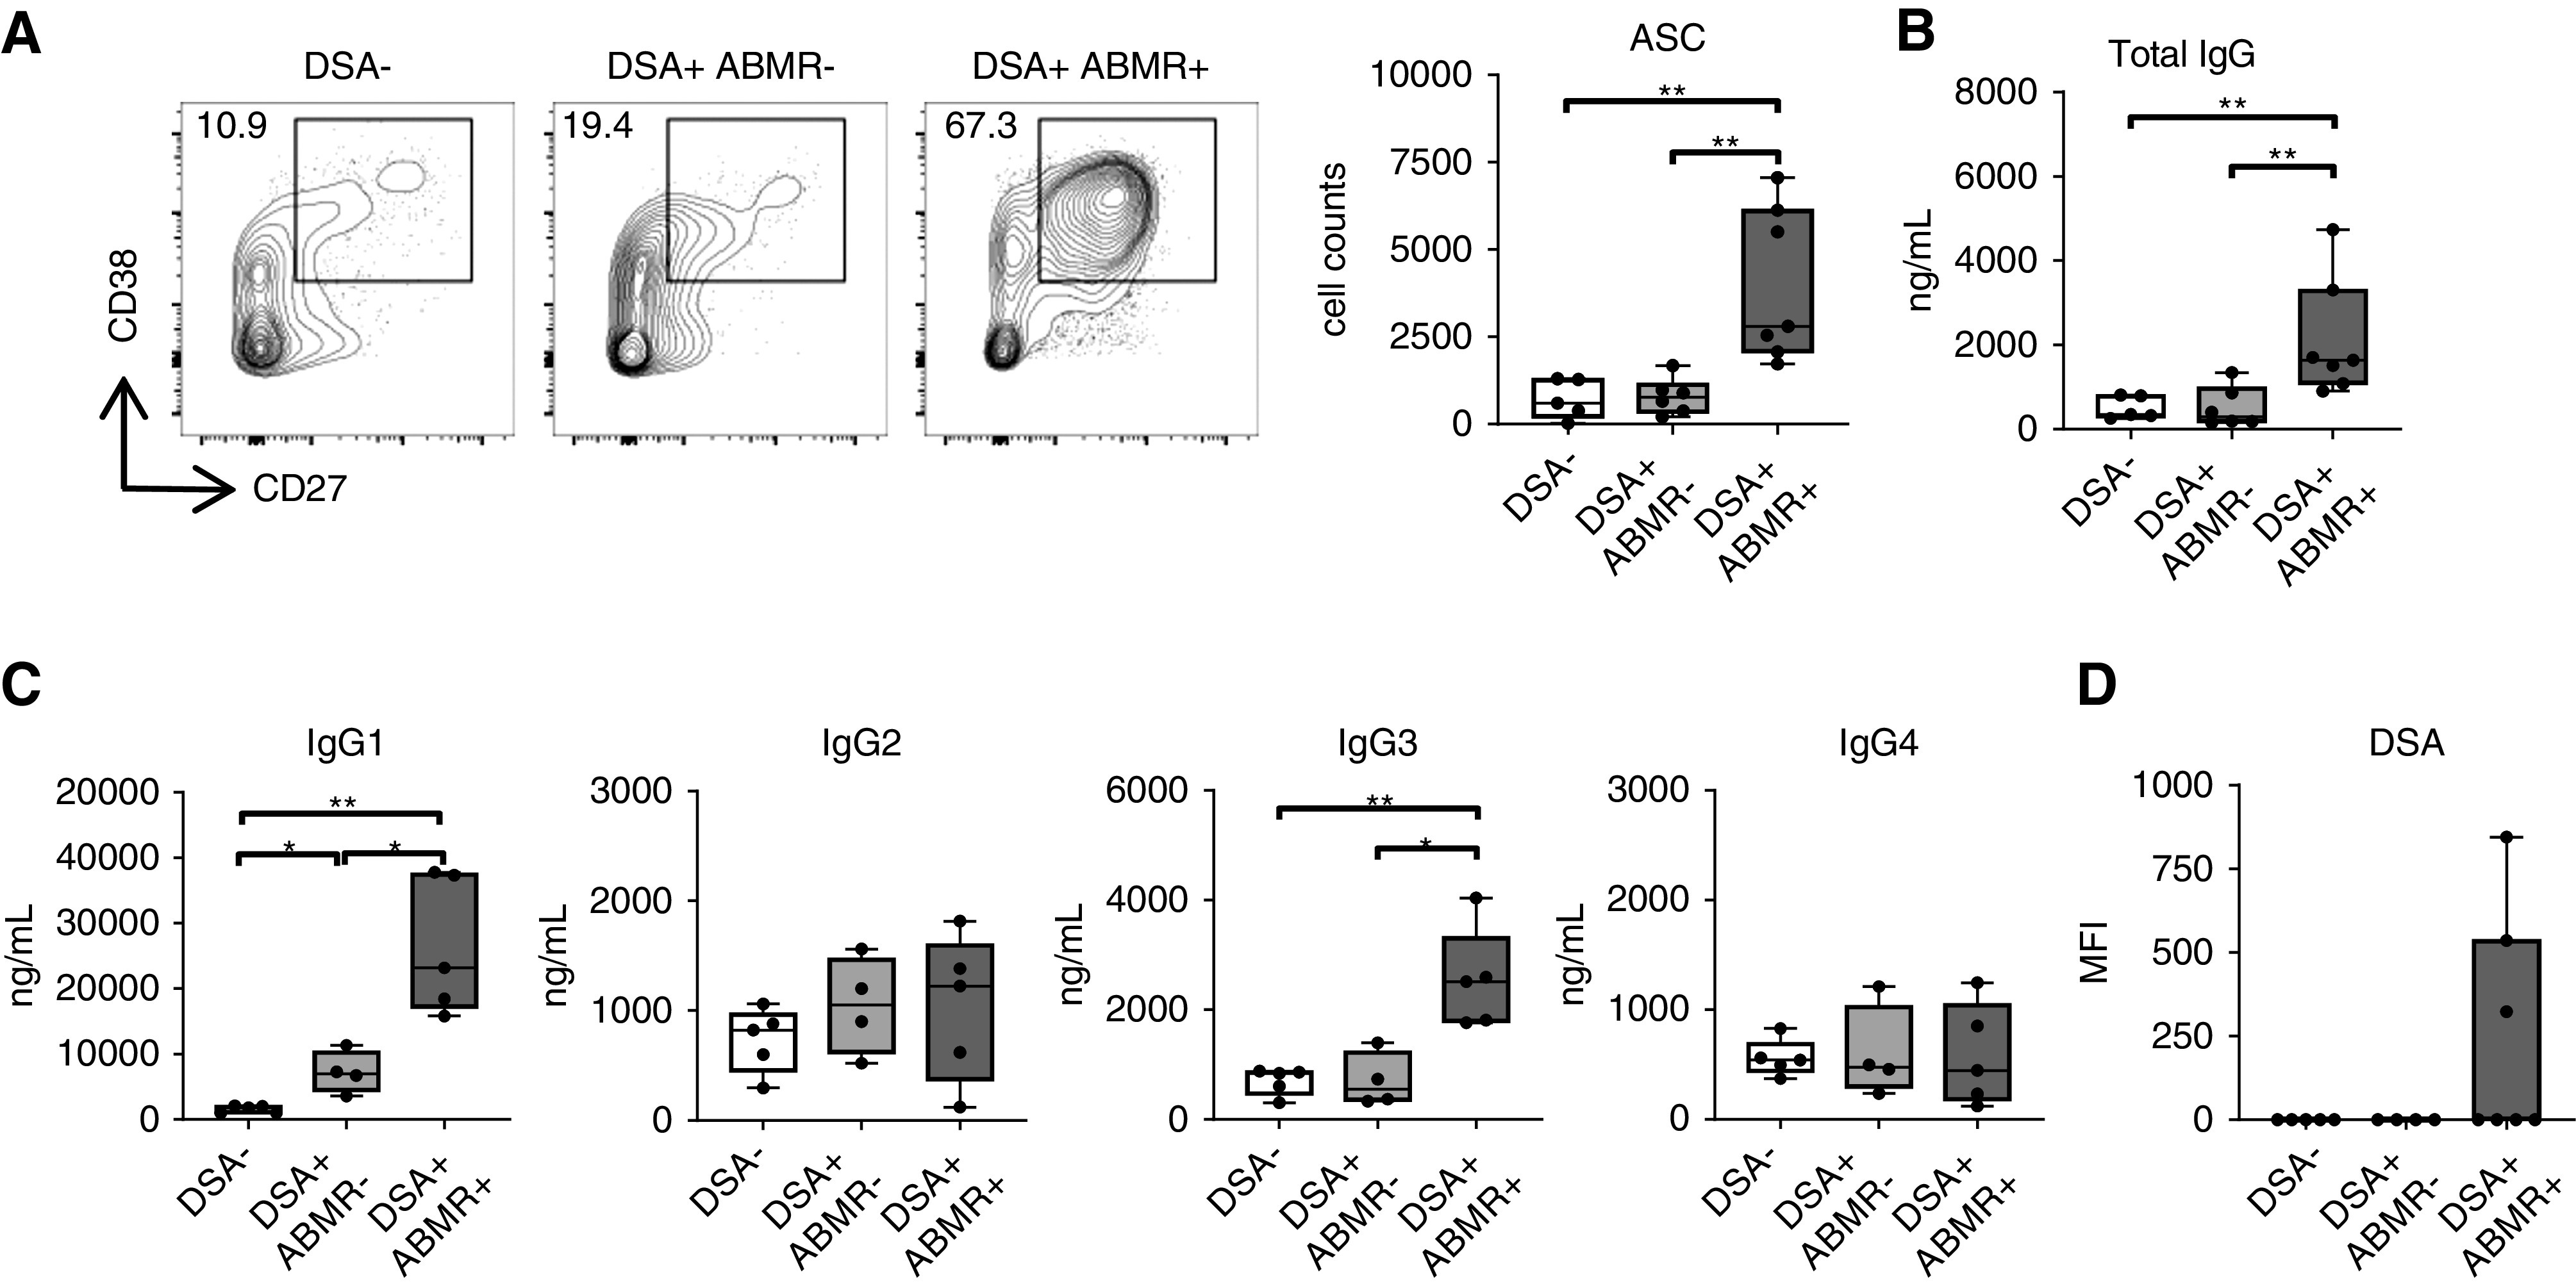
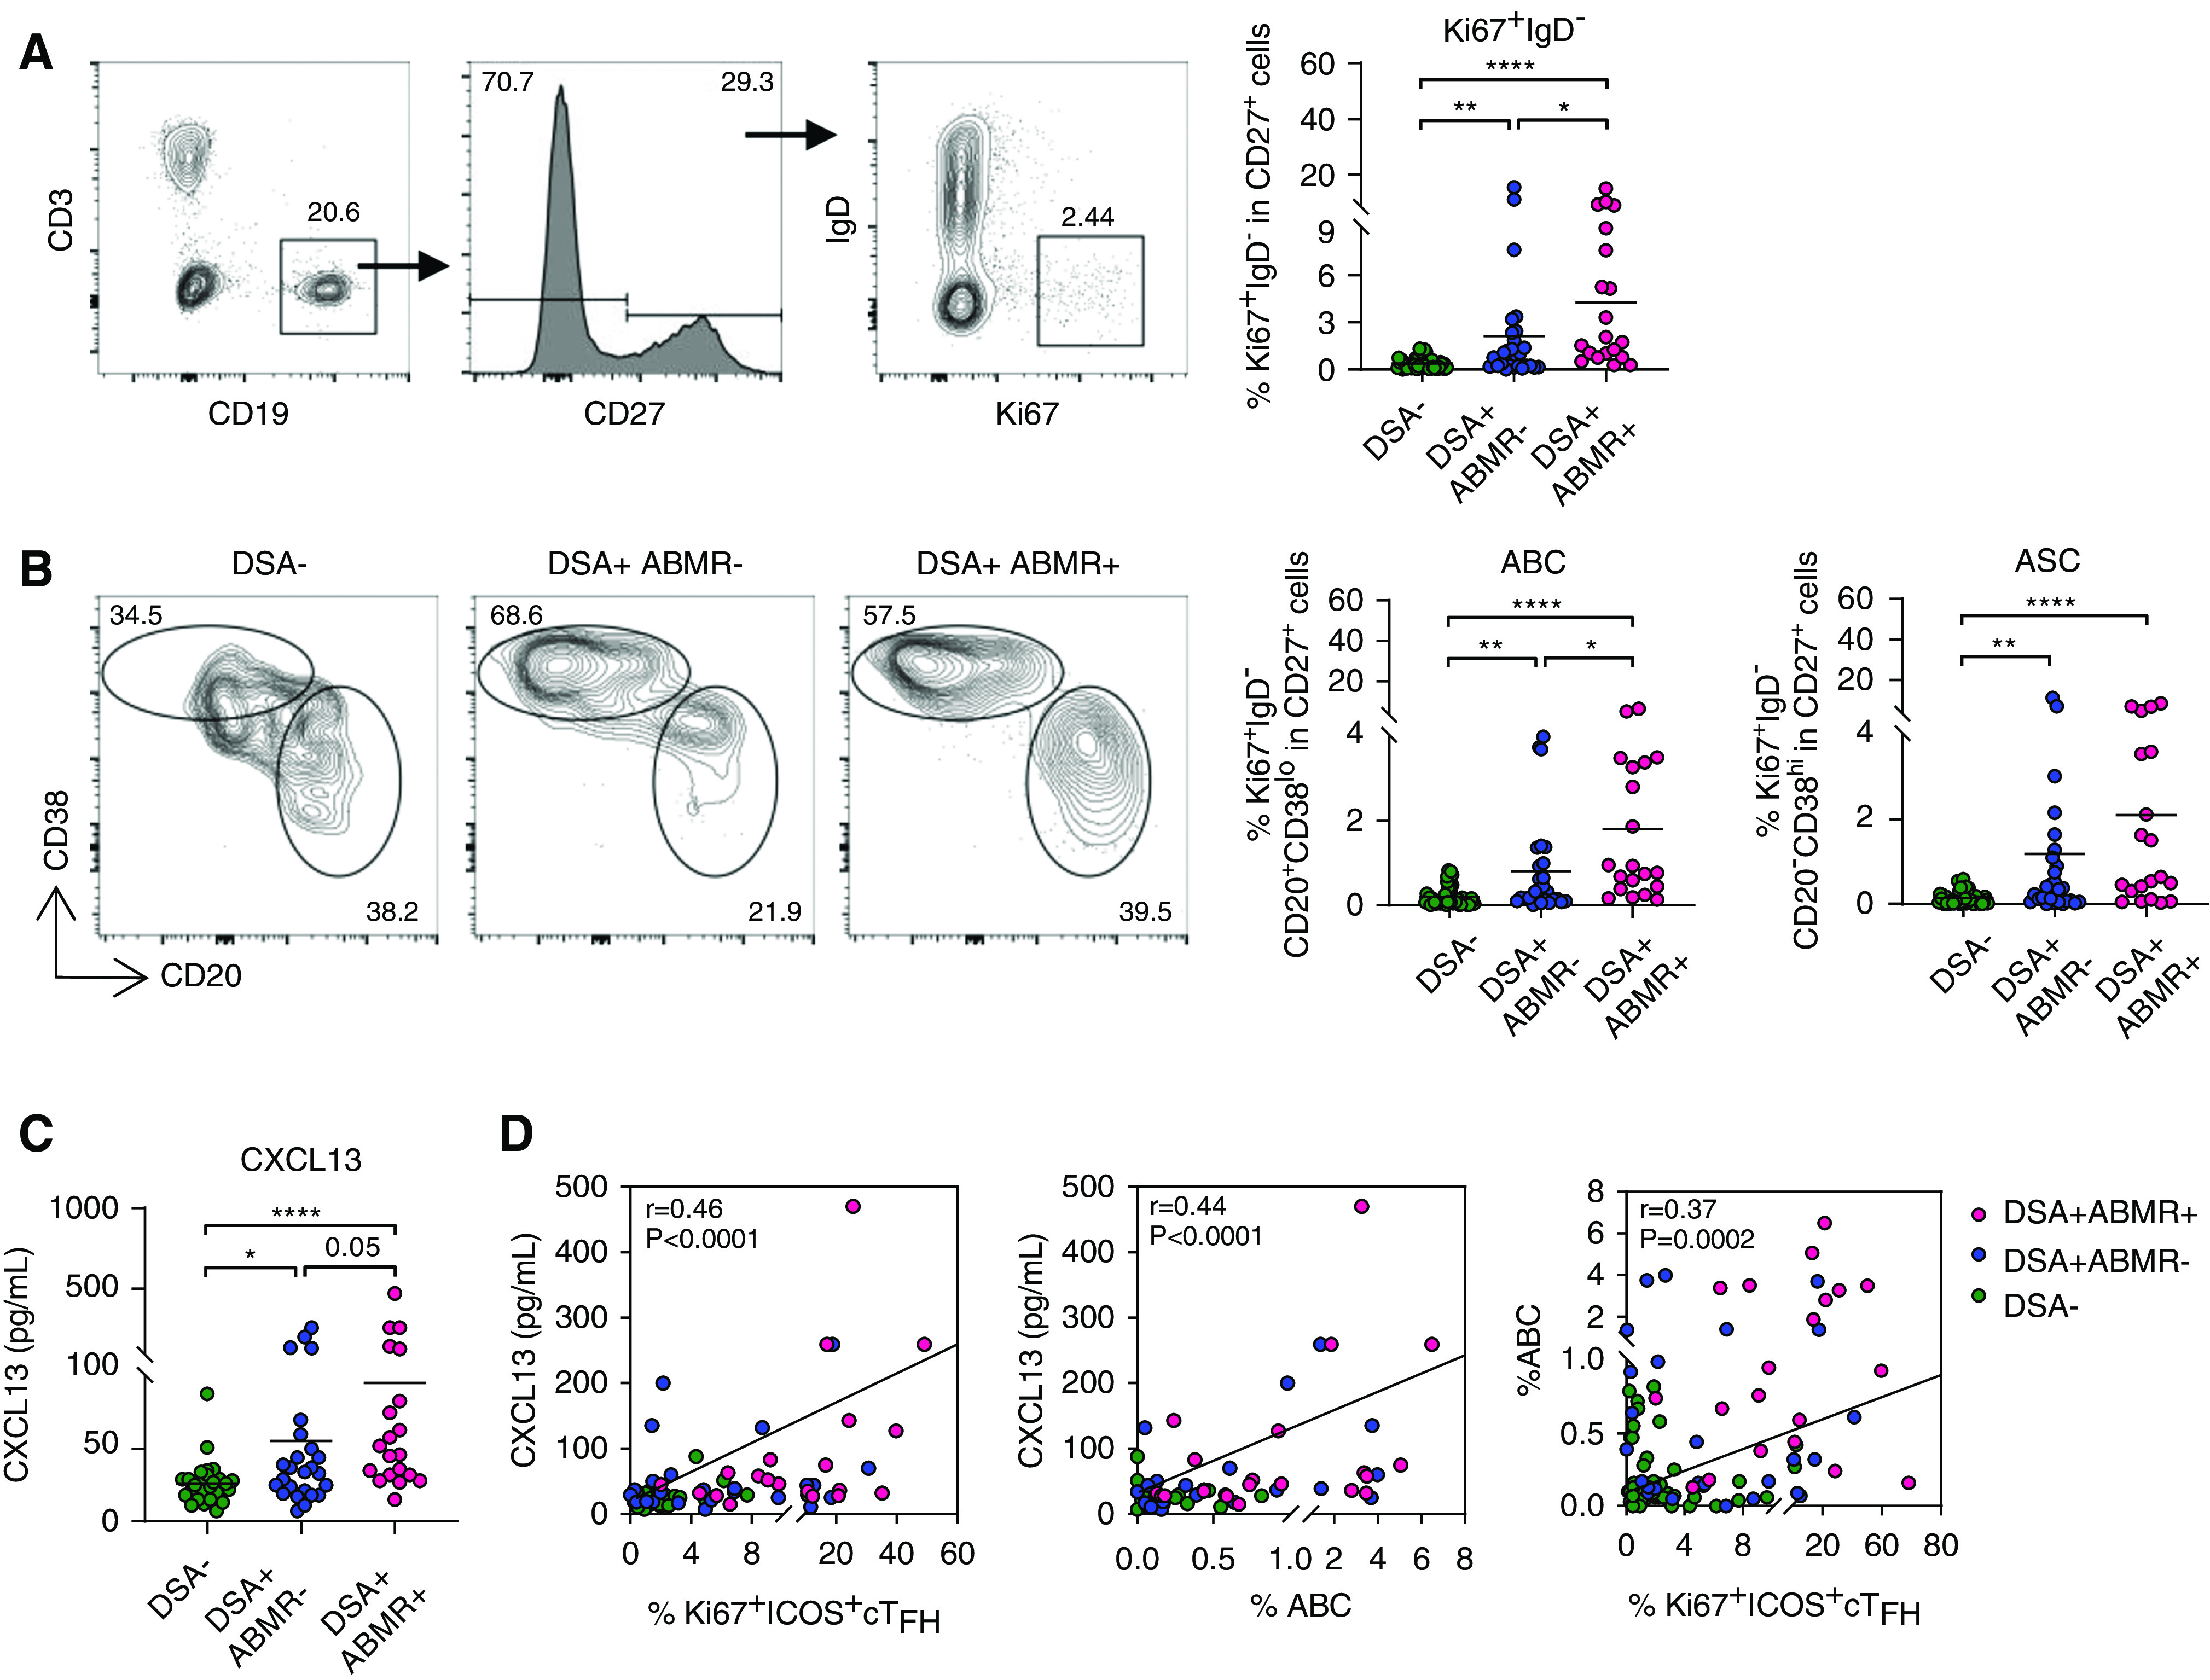
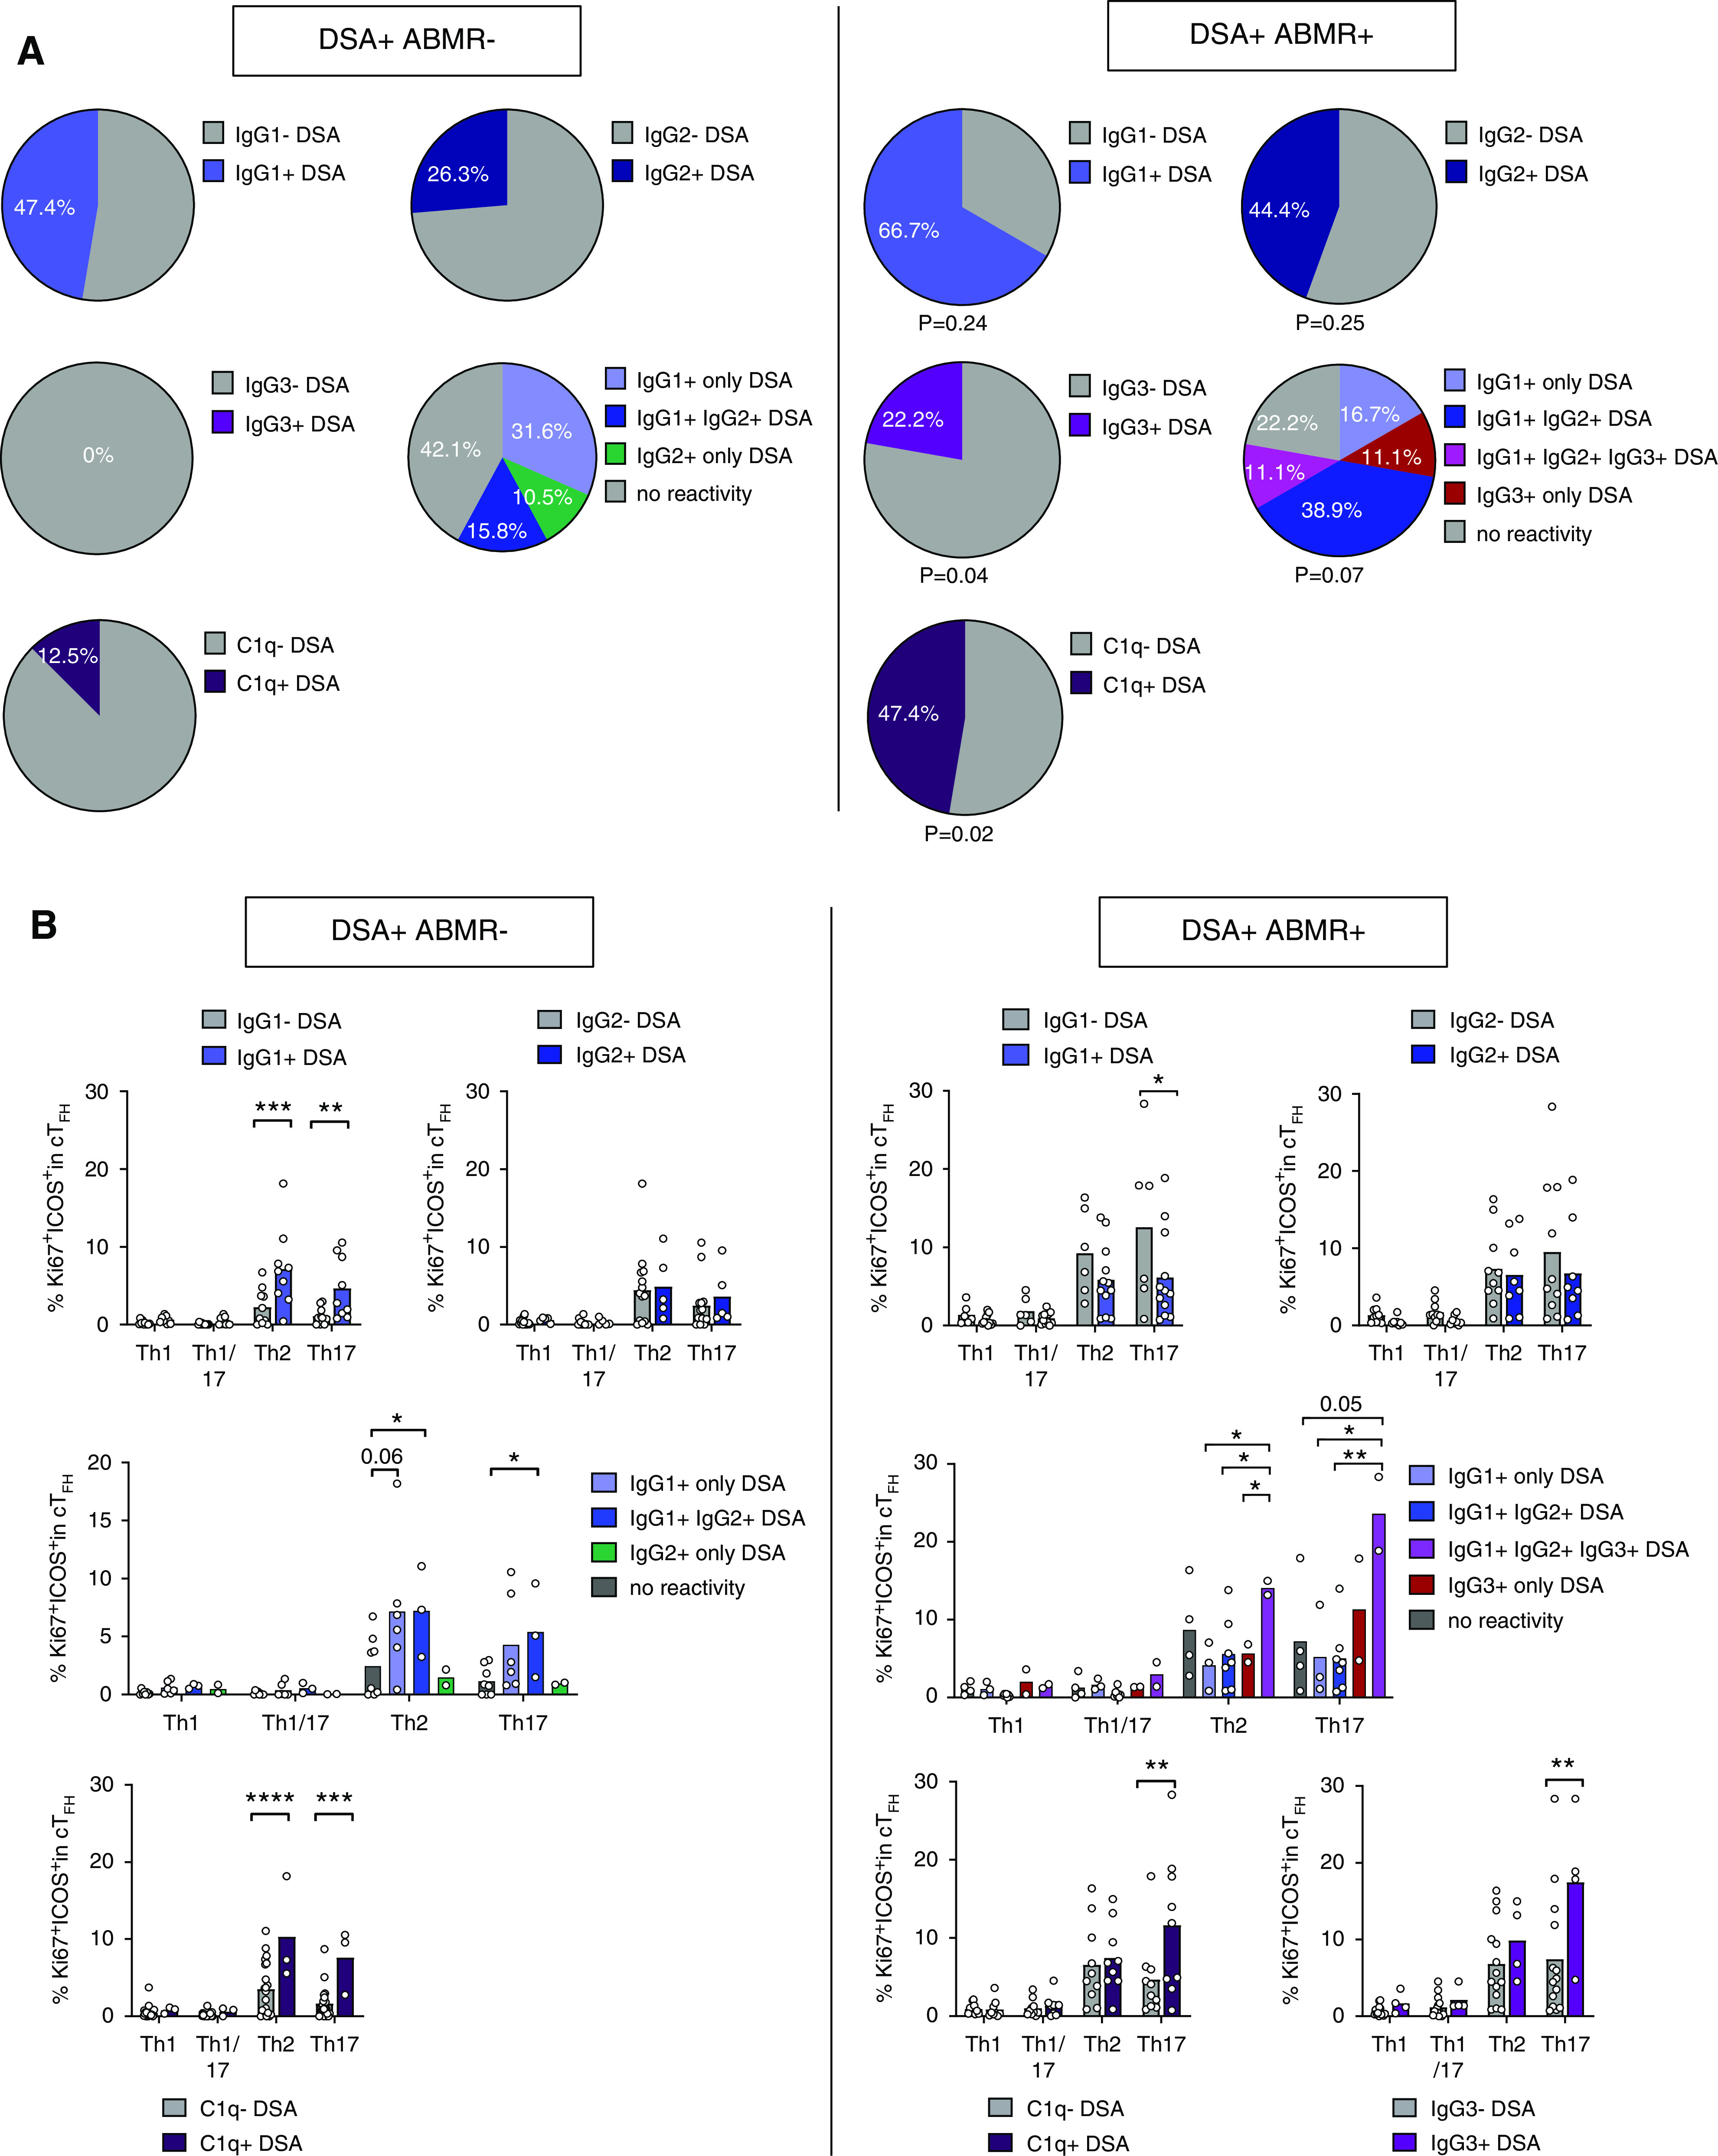
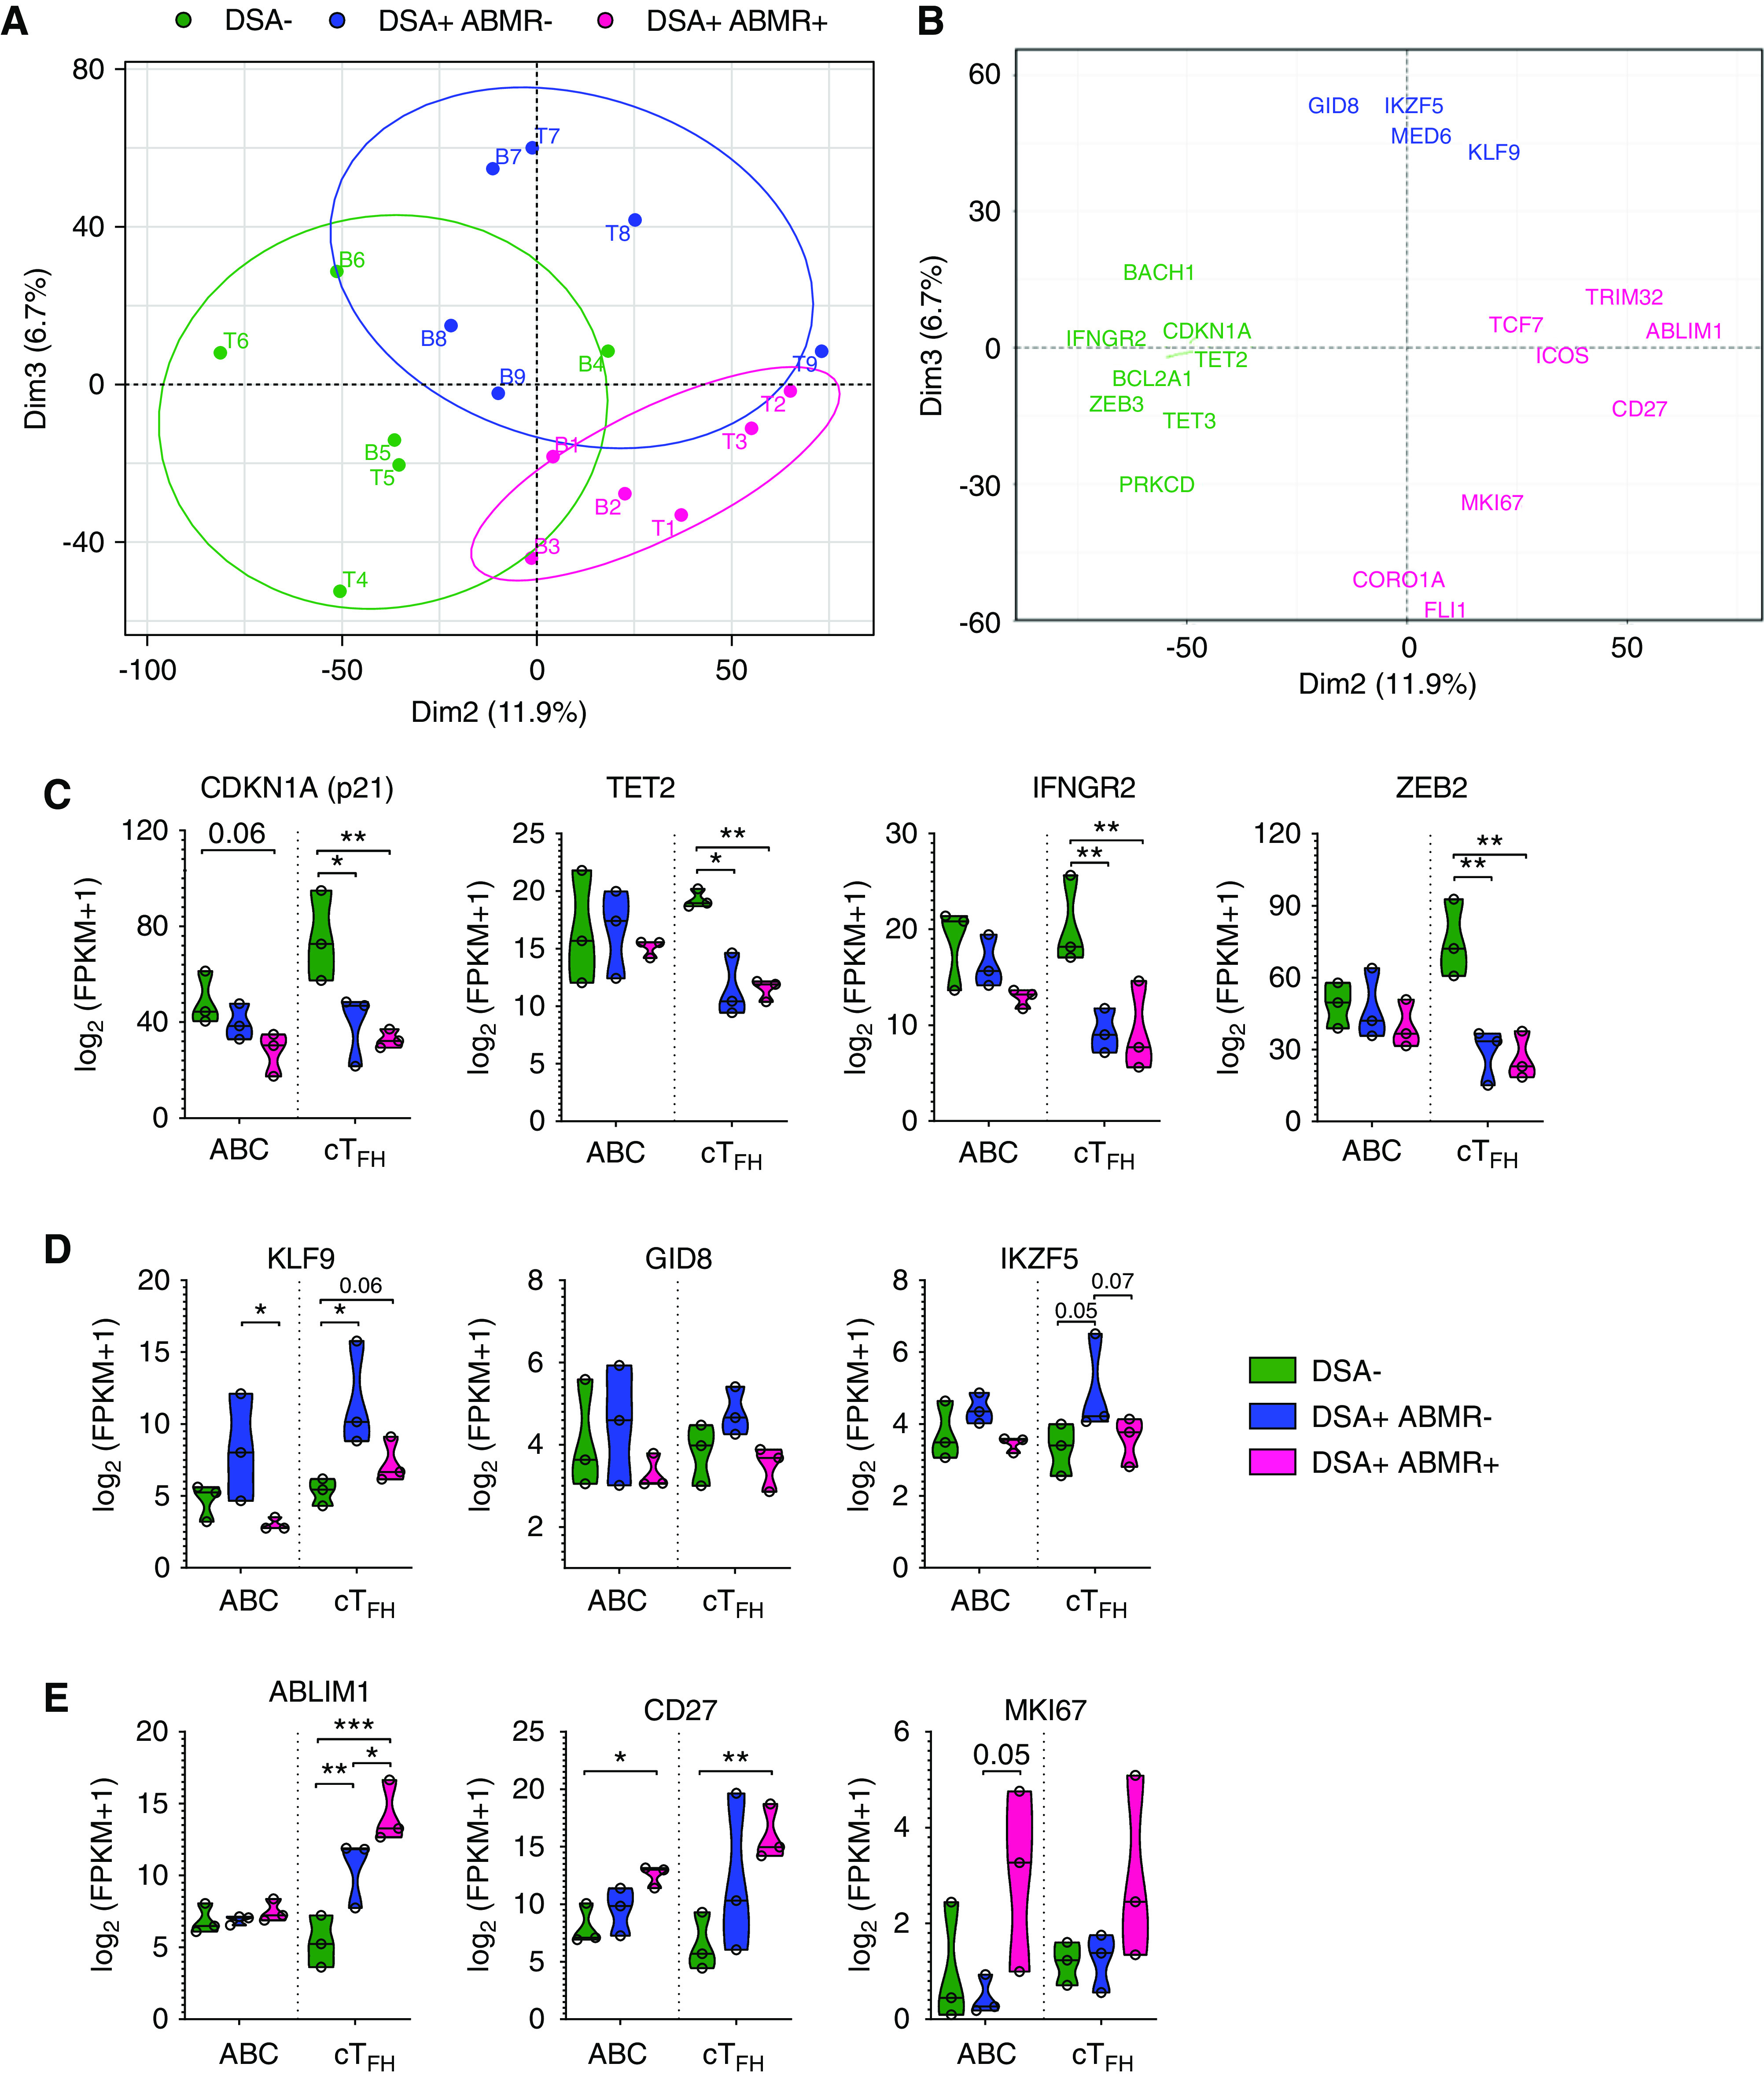
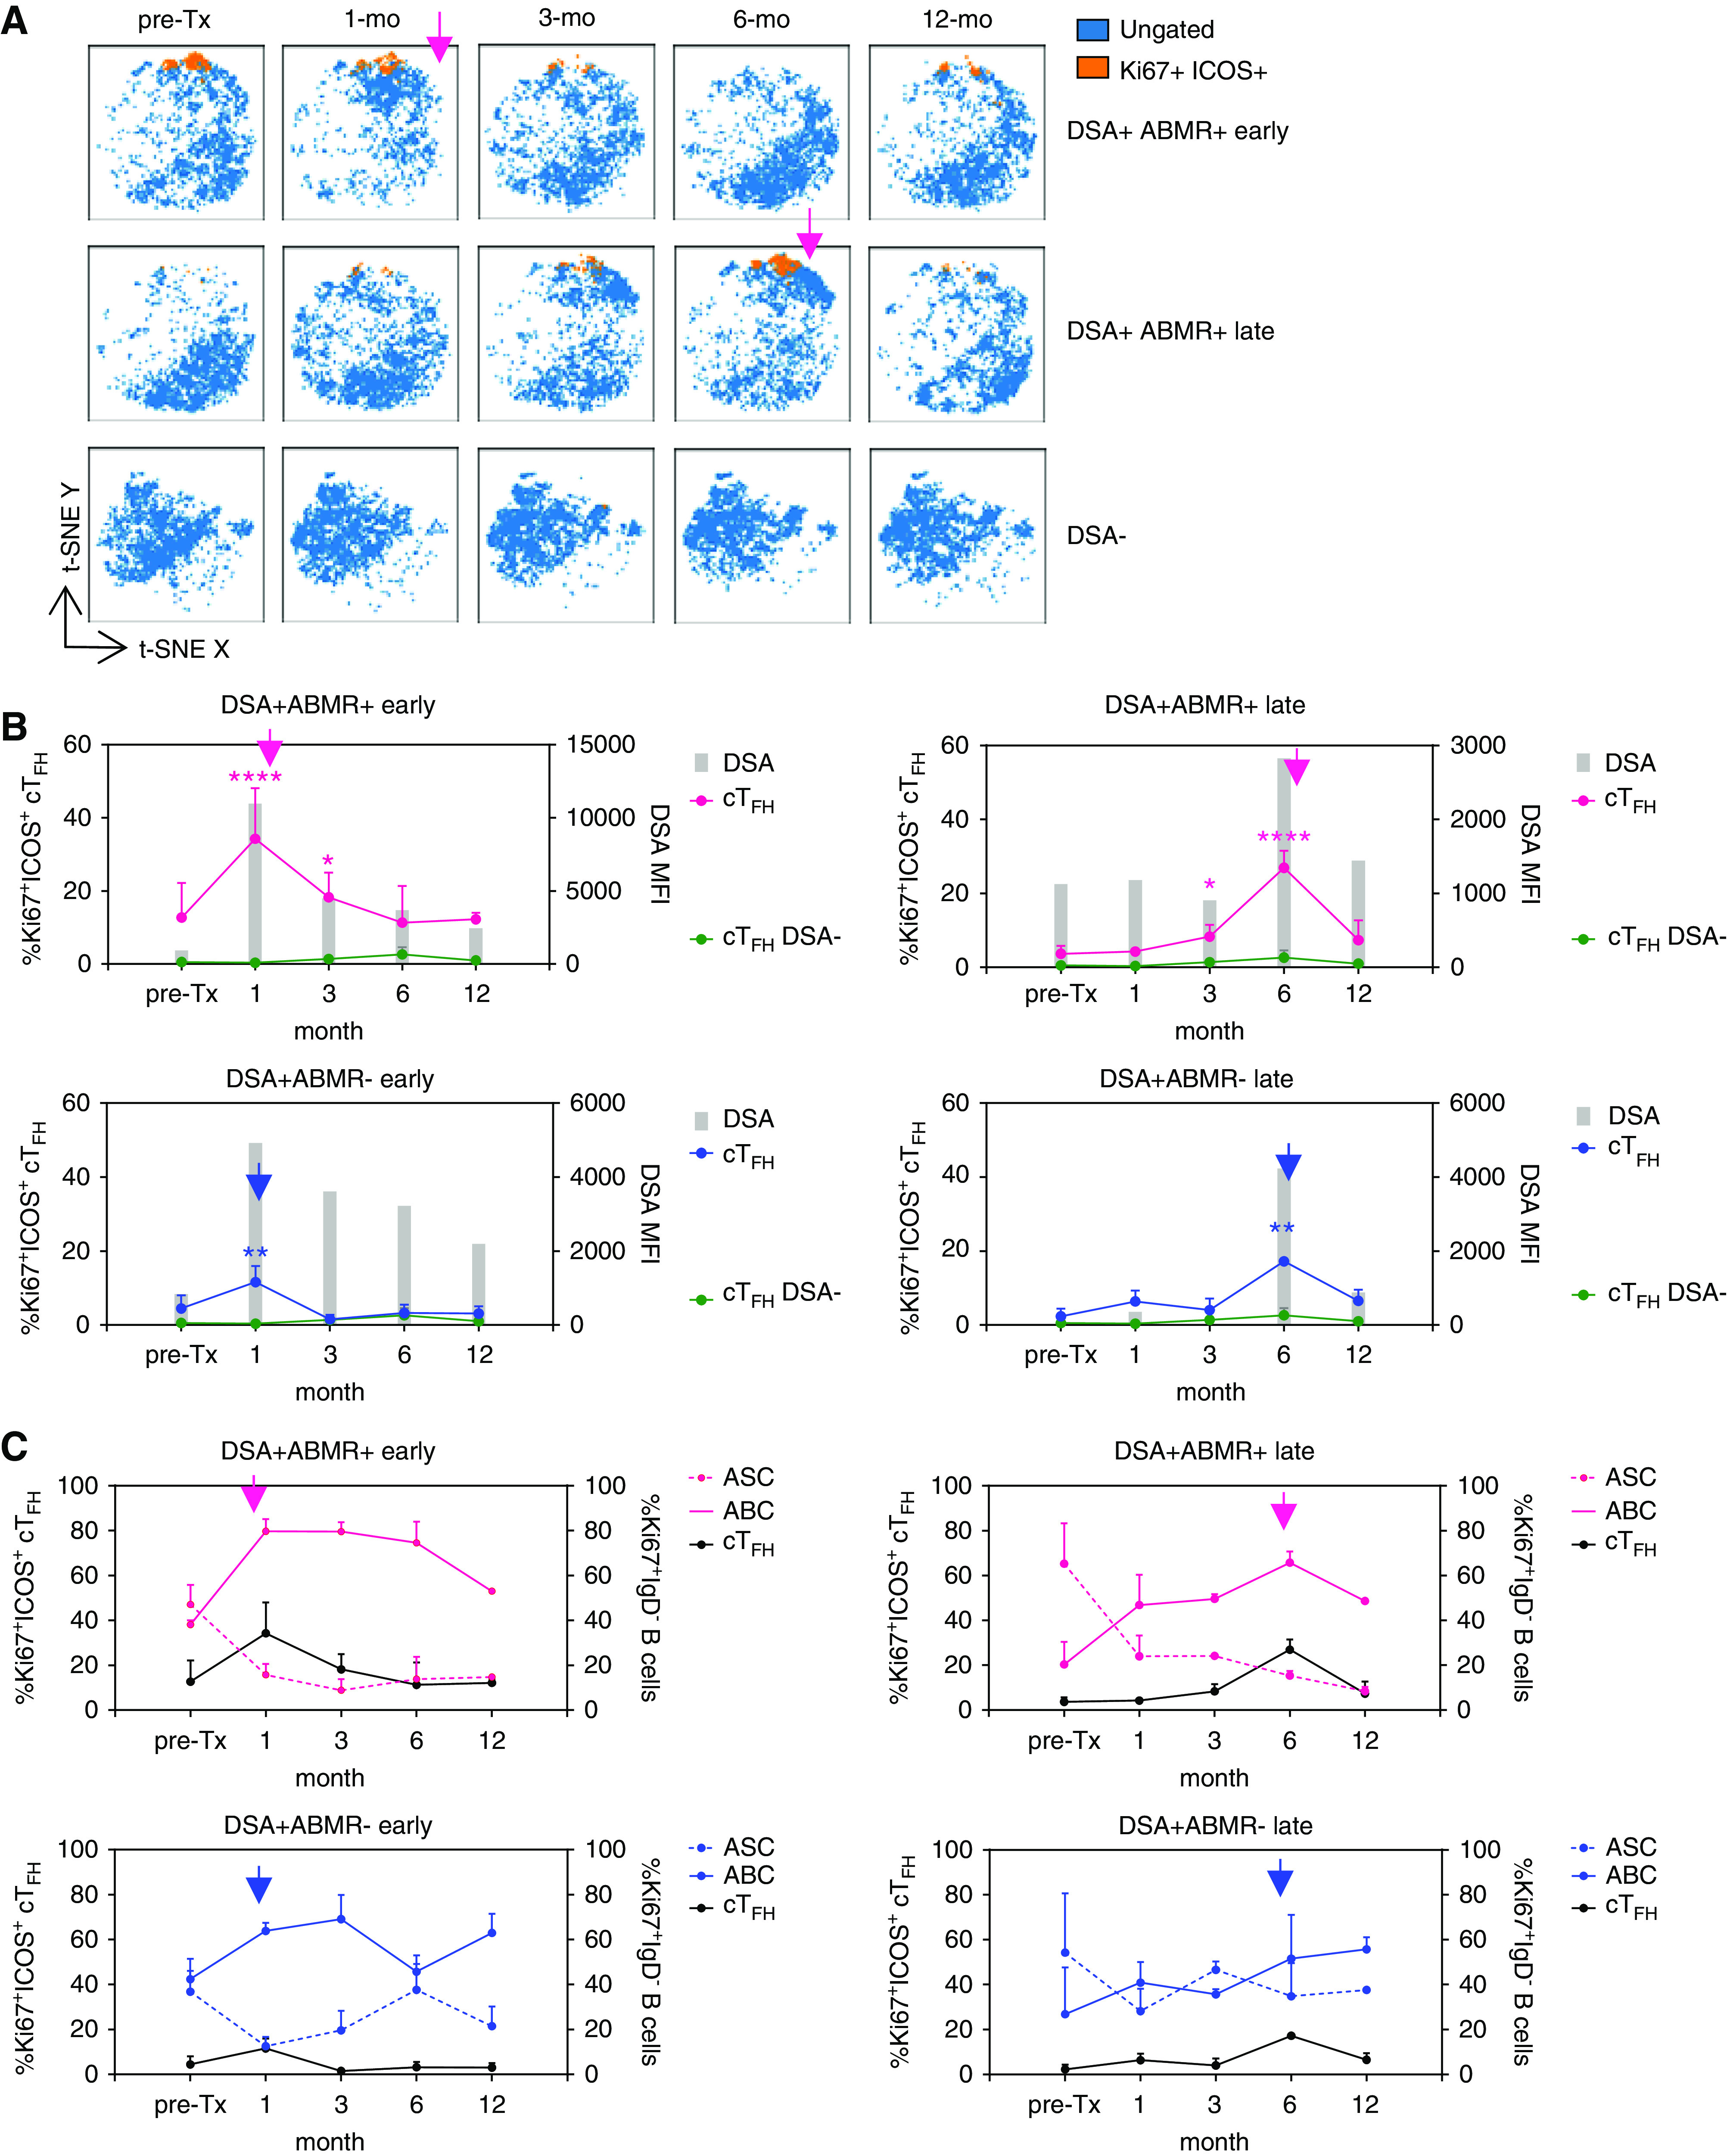
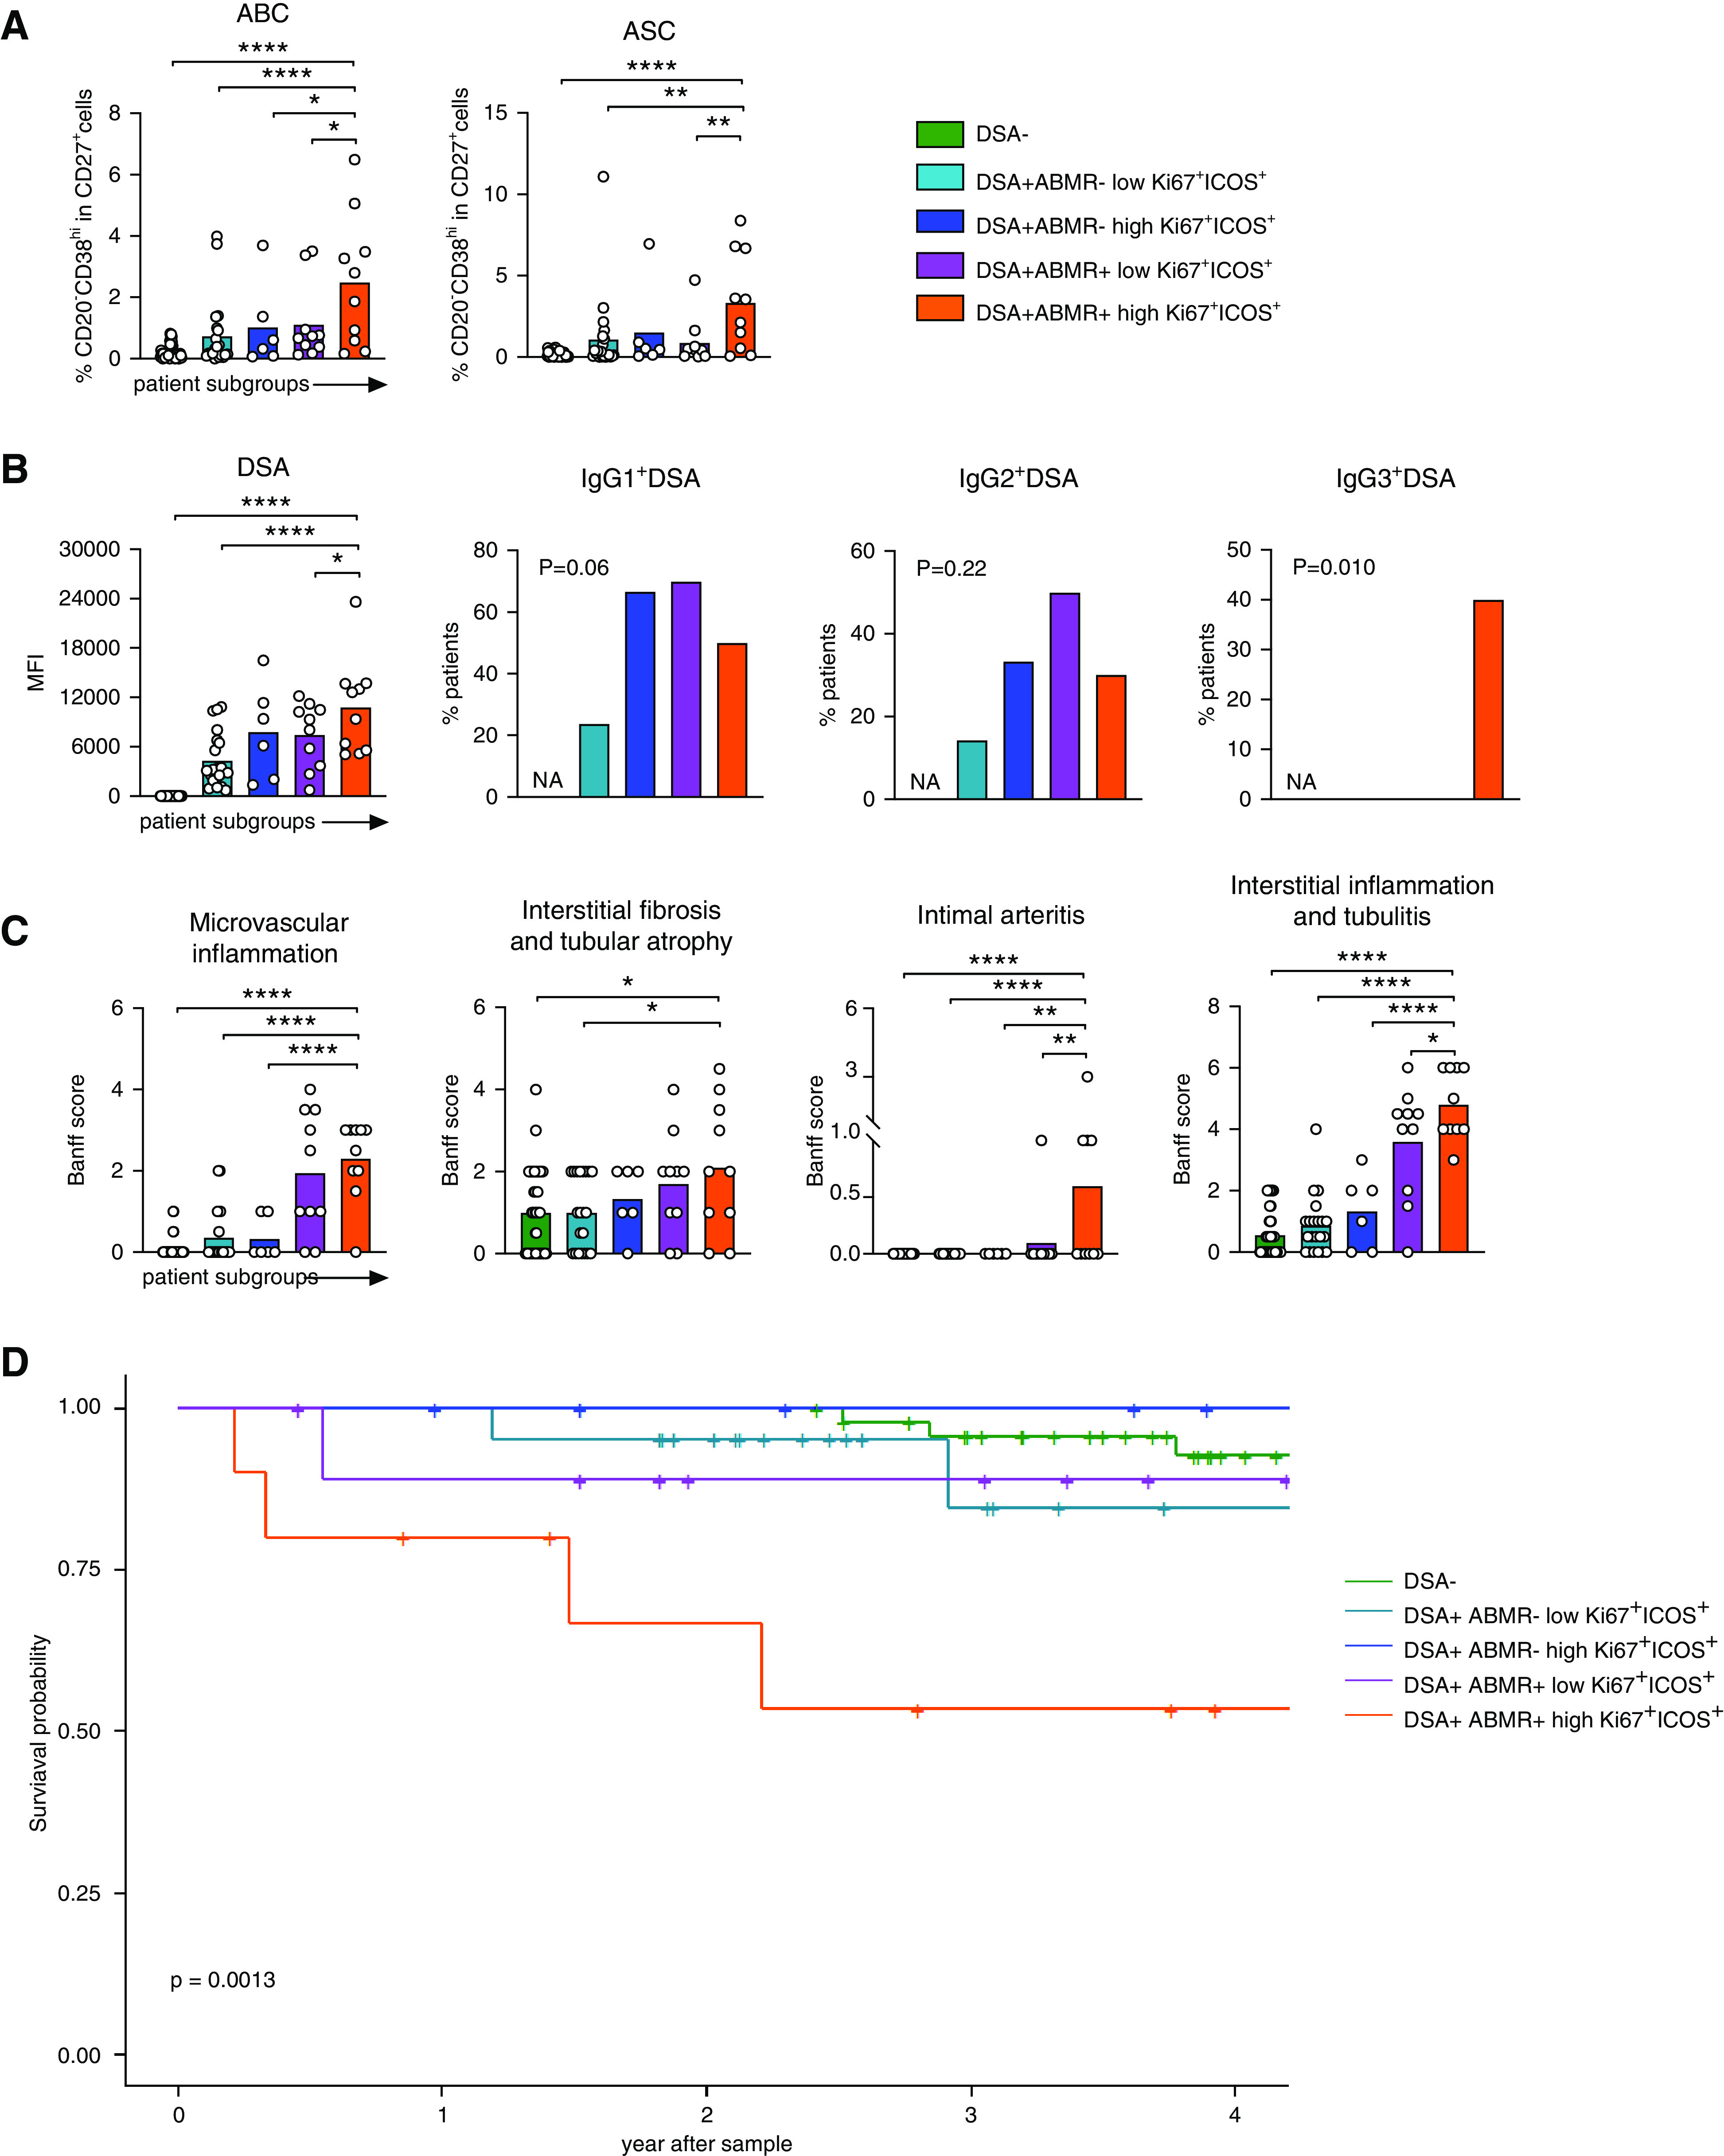
Results: There were 54 patients without DSAs; of those with DSAs, ABMR emerged in 20 patients, but not in 31 patients. We identified proliferating populations of circulating TFH cells and activated B cells emerging in blood of patients undergoing ABMR. Although these circulating TFH cells comprised heterogeneous phenotypes, they were dominated by activated (ICOS+PD-1+) and early memory precursor (CCR7+CD127+) subsets, and were enriched for the transcription factors IRF4 and c-Maf. These circulating TFH cells produced large amounts of IL-21 upon stimulation with donor antigen and induced B cells to differentiate into antibody-secreting cells that produced DSAs. Combined analysis of the matched circulating TFH cell and activated B cell RNA-sequencing profiles identified highly coordinated transcriptional programs in circulating TFH cells and B cells among patients with ABMR, which markedly differed from those of patients who did not develop DSAs or ABMR. The timing of expansion of the distinctive circulating TFH cells and activated B cells paralleled emergence of DSAs in blood, and their magnitude was predictive of IgG3 DSA generation, more severe allograft injury, and higher rate of allograft loss.

Conclusions: Patients undergoing ABMR may benefit from monitoring and therapeutic targeting of TFH cell-B cell interactions.

Keywords: acute allograft rejection; immunology; kidney transplantation; lymphocytes; transcriptional profiling; transplant outcomes.


Figures

None
Graphical abstract
Figure 1.
Figure 1.
cTFH associated with ABMR are heterogeneous and display activated and early memory features. (A) t-SNE projections were generated using a concatenated file of 56,100 cTFH cells from DSA (n=20), DSA+ABMR (n=20), and DSA+ABMR+ (n=20) patients; panels display expression levels of indicated markers (MFI). (B) t-SNE projections of cTFH cell densities in the three patient groups using 18,700 cells from each group, shown in (A). (C) t-SNE map overlaid with 10 cTFH cell clusters delineated by SPADE clustering of the concatenated file, as in (A). (D) Heatmap showing the expression of markers for each cTFH cell cluster according to transformed MFI ratio. Cell clusters 4 and 8 (*) are distinct from others. (E) Stacked bar plot showing cTFH cell cluster distribution on the basis of SPADE clustering as in (C). Clusters 2, 3, 4, 7, 8, and 9 are significantly different in their proportions across the indicated groups. (F) Representative examples of flow cytometry analysis and dot plot of percentages of Ki67+ICOS+ cells in cTFH are displayed for DSA (n=48), DSA+ABMR (n=27), and DSA+ABMR+ (n=20) patients. Kruskal–Wallis with Dunn post-test for panel (E and F). *P<0.05; **P<0.01; ****P<0.001. Each dot represents one patient and horizontal lines are mean values.
Figure 2.
Figure 2.
cTFH associated with ABMR display a distinctive GC-precursor transcriptional profile. RNA-sequencing analysis of sorted cTFH was performed in three patient groups: DSA (n=3), DSA+ABMR (n=3) and DSA+ABMR+ (n=3). (A) Heatmap generated by hierarchical clustering of genes and the three types of patient samples. Genes used for clustering were differentially expressed (fold change >2, false discovery rate P value <0.05). (B) Violin plots showing the expression levels of displayed genes in cTFH for indicated patient groups. Multiple t test with Holm–Sidak correction. *P<0.05; **P<0.01. (C) Bar plot of significantly upregulated canonical pathways (on the basis of differentially expressed genes between cTFH from the DSA+ABMR+ group versus the DSA group) aligned by adjusted –log(P value) as predicted by IPA, using Fisher exact test.
Figure 3.
Figure 3.
cTFH from ABMR patients promote memory B cells to generate DSAs. Coculture of sorted cTFH with autologous memory B cells in presence of SEB (6 days). (A) Representative examples of individual experiments by flow cytometry analysis and dot plot of CD27+CD38hi ASCs as cell counts in cocultures are displayed for DSA (n=5), DSA+ABMR (n=6) and DSA+ABMR+ (n=7) groups. (B and C) Box plots of total IgG and IgG subclasses measured by ELISA in supernatants after 6 days of coculture: (B) DSA (n=5), DSA+ABMR (n=6), and DSA+ABMR+ (n=7); and (C) DSA (n=5), DSA+ABMR (n=4) and DSA+ABMR+ (n=5). Mann–Whitney U test for (A–C). *P<0.05; **P<0.01. (D) Luminex analysis of DSAs in supernatants after 6 days of coculture for DSA (n=5), DSA+ABMR (n=4) and DSA+ABMR+ (n=7) groups.
Figure 4.
Figure 4.
Concomitant emergence of activated cTFH and B cells in blood is reflective of increased GC activity.ctivated B cells emerge concomitantly in blood and reflect active GC responses. Flow cytometry analysis of blood B cells in patients analyzed for cTFH in Figure 1F. (A) Representative examples of flow cytometry analysis and dot plots of percentages of Ki67+IgD among CD27+ cells are displayed for DSA (n=48), DSA+ABMR (n=27) and DSA+ABMR+ (n=20) groups. (B) Representative flow cytometry analysis and percentages of Ki67+IgDCD20+CD38lo ABCs and Ki67+IgDCD20CD38hi ASCs among CD27+ cells are displayed for DSA (n=48), DSA+ABMR (n=27) and DSA+ABMR+ (n=20) groups. (C) Plasma CXCL13 levels measured by ELISA for DSA (n=28), DSA+ABMR (n=25), and DSA+ABMR+ (n=20) groups. (D) Spearman correlation analysis of Ki67+ICOS+ cTFH and ABCs with plasma CXCL13 levels for DSA (n=28), DSA+ABMR (n=25), and DSA+ABMR+ (n=20) groups. Mann-Whitney U test was used for (A–C). *P<0.05; **P<0.01; ****P<0.001. Each dot represents one patient.
Figure 5.
Figure 5.
Altered cTFH polarization correlates with differential DSA pathogenicities. (A) Proportions of patients that were positive for the indicated DSA IgG isotypes in the two patient groups are displayed for DSA+ABMR (n=19, left panel) and DSA+ABMR+ (n=18, right panel). C1q-binding analysis was performed using DSA+ABMR (n=24, left panel) and DSA+ABMR+ (n=19, right panel) patient serum samples. P values of chi-squared test for the comparison between patient groups are shown. (B) Flow cytometry analysis of percentages of Ki67+ICOS+ Th1, Th1/17, Th2, and Th17 cells among cTFH from DSA+ABMR and DSA+ABMR+ patients are shown. Sample size as in (A). Kruskal–Wallis test with Dunn post-test. *P<0.05; **P<0.01; ****P<0.001. Each dot represents one patient and horizontal lines are mean values.
Figure 6.
Figure 6.
Coordinated transcriptional programs in cTFH and ABCs of patients with ABMR. (A) PCA of the cTFH and ABC RNA-sequencing patterns for each patient group (n=3 patients per group) are depicted. PC2 and PC3 delineate the cTFH (T1–9) and ABCs (B1–9) from DSA (green), DSA+ABMR (blue), and DSA+ABMR+ (pink) patients as separate clusters. (B) Genes that drive PC2 and PC3 (selected from the top 60 genes contributing to each PC, along with biologically relevant others) are displayed. (C–E) Violin plots of expression levels of indicated genes that covary in cTFH and ABCs in the three patient groups. Multiple t test with Holm–Sidak correction for (C–E). *P<0.05; **P<0.01; ***P<0.001. Each dot represents one patient.
Figure 7.
Figure 7.
Dynamics of cTFH and ABC responses correlate with timing of ABMR onset. Patients were sampled longitudinally from pretransplant to the indicated intervals. (A) t-SNE projections of cTFH cells from three individual patients, overlaid with those that are Ki67+ICOS+. Each t-SNE map is on the basis of n=3000 cells per time point. Pink arrows indicate the time point of onset of ABMR. (B) Kinetics of emergence of Ki67+ICOS+ cTFH (connecting lines) and DSAs (gray bars) in indicated patient groups: DSA (n=5), DSA+ABMR early (n=5), DSA+ABMR late (n=2), DSA+ABMR+ early (n=2), and DSA+ABMR+ late (n=2). Mixed-effects model for comparison of %Ki67+ICOS+ cTFH between DSA+ABMR+ or DSA+ABMR groups with the DSA group. *P<0.05; **P<0.01; ****P<0.001. (C) Kinetics of cTFH, ABCs, and ASCs in patient groups, as in (B). Blue arrows indicate the time of DSA emergence post-transplant and pink arrows indicate the time point of ABMR onset. cTFH, ABC, and ASC data are shown as percentage±SEM and DSA bars represent mean values.
Figure 8.
Figure 8.
High frequencies of activated cTFH are associated with increased B cell and DSA responses, more allograft injury, and decreased allograft survival. DSA+ABMR and DSA+ABMR+ patients were stratified into subgroups on the basis of the median percentage of Ki67+ICOS+ cTFH <11.4% (low) and >11.4% (high) in the DSA+ABMR+ group, as shown in Figure 1F. Data shown from indicated patient subgroups: DSA+ABMR low (n=21), DSA+ABMR high (n=6), DSA+ABMR+ low (n=10), DSA+ABMR+ high (n=10), and DSA (n=48) are displayed. (A and B) Dot plots of percentages of ABCs and ASCs by flow cytometry, levels of DSAs, and proportions of patients that were positive for IgG1, IgG2, and IgG3 DSA by Luminex analysis, evaluated at the time of flow cytometry analysis of the cTFH, are displayed for DSA+ABMR low (n=21), DSA+ABMR high (n=6), DSA+ABMR+ low (n=10), DSA+ABMR+ high (n=10), and DSA (n=48) patients. (C) Histologic Banff scores of kidney allograft lesions evaluated at the time of flow cytometry analysis of the cTFH. Microvascular inflammation indicated by glomerulitis+peritubular capillaritis Banff score and interstitial fibrosis and tubular atrophy indicated by IF/TA Banff score. One-way ANOVA with Dunnett post-test for (A–C). *P<0.05; **P<0.01; ****P<0.001. Each dot represents one patient and horizontal lines of bars are mean values. (D) Kaplan–Meier of allograft survival rate in each subgroup of patients; sample size as in (A). Log-rank test.

References

    1. Loupy A, Lefaucheur C: Antibody-mediated rejection of solid-organ allografts. N Engl J Med 379: 1150–1160, 2018. - PubMed
    1. Louis K, Hertig A, Taupin J-L, Buob D, Jamme M, Brocheriou I, et al. .: Markers of graft microvascular endothelial injury may identify harmful donor-specific anti-HLA antibodies and predict kidney allograft loss. Am J Transplant 19: 2434–2445, 2019. - PubMed
    1. Lefaucheur C, Viglietti D, Bentlejewski C, Duong van Huyen J-P, Vernerey D, Aubert O, et al. .: IgG donor-specific anti-human HLA antibody subclasses and kidney allograft antibody-mediated injury. J Am Soc Nephrol 27: 293–304, 2016. - PMC - PubMed
    1. Valenzuela NM, Reed EF: Antibody-mediated rejection across solid organ transplants: Manifestations, mechanisms, and therapies. J Clin Invest 127: 2492–2504, 2017. - PMC - PubMed
    1. Crotty S: T follicular helper cell differentiation, function, and roles in disease. Immunity 41: 529–542, 2014. - PMC - PubMed

Publication types