. 2020 Jul 28;11(4):e00986-20.
doi: 10.1128/mBio.00986-20.

A Cytoplasmic Heme Sensor Illuminates the Impacts of Mitochondrial and Vacuolar Functions and Oxidative Stress on Heme-Iron Homeostasis in Cryptococcus neoformans

Affiliations

A Cytoplasmic Heme Sensor Illuminates the Impacts of Mitochondrial and Vacuolar Functions and Oxidative Stress on Heme-Iron Homeostasis in Cryptococcus neoformans

Gaurav Bairwa et al. mBio. .

Abstract

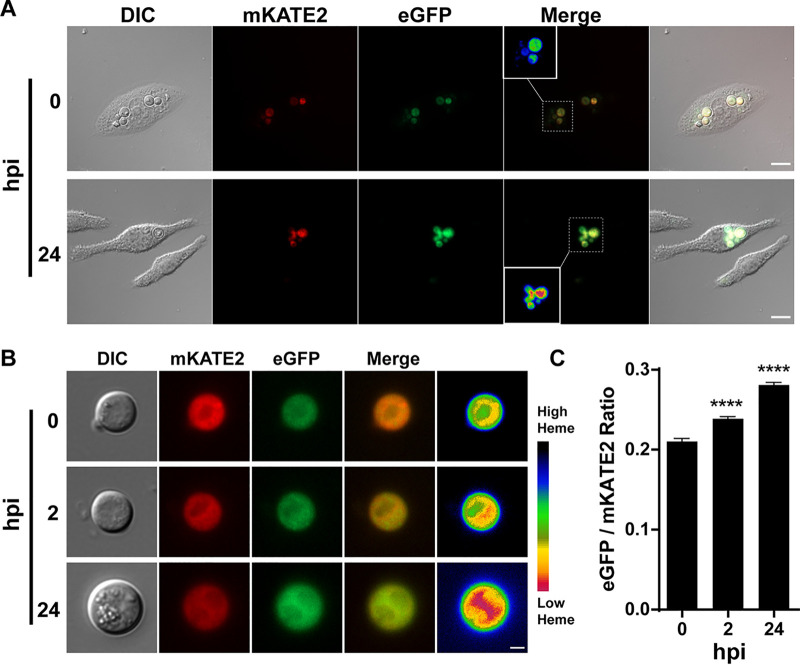
Pathogens must compete with hosts to acquire sufficient iron for proliferation during pathogenesis. The pathogenic fungus Cryptococcus neoformans is capable of acquiring iron from heme, the most abundant source in vertebrate hosts, although the mechanisms of heme sensing and acquisition are not entirely understood. In this study, we adopted a chromosomally encoded heme sensor developed for Saccharomyces cerevisiae to examine cytosolic heme levels in C. neoformans using fluorescence microscopy, fluorimetry, and flow cytometry. We validated the responsiveness of the sensor upon treatment with exogenous hemin, during proliferation in macrophages, and in strains defective for endocytosis. We then used the sensor to show that vacuolar and mitochondrial dysregulation and oxidative stress reduced the labile heme pool in the cytosol. Importantly, the sensor provided a tool to further demonstrate that the drugs artemisinin and metformin have heme-related activities and the potential to be repurposed for antifungal therapy. Overall, this study provides insights into heme sensing by C. neoformans and establishes a powerful tool to further investigate mechanisms of heme-iron acquisition in the context of fungal pathogenesis.IMPORTANCE Invasive fungal diseases are increasing in frequency, and new drug targets and antifungal drugs are needed to bolster therapy. The mechanisms by which pathogens obtain critical nutrients such as iron from heme during host colonization represent a promising target for therapy. In this study, we employed a fluorescent heme sensor to investigate heme homeostasis in Cryptococcus neoformans We demonstrated that endocytosis is a key aspect of heme acquisition and that vacuolar and mitochondrial functions are important in regulating the pool of available heme in cells. Stress generated by oxidative conditions impacts the heme pool, as do the drugs artemisinin and metformin; these drugs have heme-related activities and are in clinical use for malaria and diabetes, respectively. Overall, our study provides insights into mechanisms of fungal heme acquisition and demonstrates the utility of the heme sensor for drug characterization in support of new therapies for fungal diseases.

Keywords: artemisinin; biosensors; heme sensor; heme-related drugs; macrophage; metformin; mitochondria; reactive oxygen species; vacuole.


Figures

FIG 1
FIG 1
Characterization of C. neoformans cells expressing a heme sensor (CnHS). (A) Schematic diagram of the mKATE2-cytochrome b562-eGFP fluorescent heme sensor protein (CnHS) and depiction of the response (green to red) of the CnHS in a yeast cell with increasing intracellular heme levels. (B) Wide-field fluorescence microscopy of WThs cells expressing the cytosolic CnHS. Iron-starved cells were incubated with hemin (10 and 100 μM) for 45 min at 30°C, and eGFP and mKATE2 fluorescence was observed and captured. Images are representative of a minimum of three independent experiments. The heat map shows the ratio of mean intensity values of eGFP and mKATE2 fluorescence generated in ImageJ 1.52q and represented as a pseudocolored image (far right, 14-color red-green blue [RGB] look-up table [LUT]); red and black are equivalent to low and high intracellular heme levels, respectively. Bars, 2 μm. (C) Dynamic changes in eGFP/mKATE2 fluorescence ratios of the CnHS in WThs cells incubated with the indicated concentrations of hemin. Fluorescence from eGFP and mKATE2 was measured in a black 96-well plate using a Tecan Infinite 200 microplate reader, and the data were plotted as the ratios of eGFP and mKATE2 fluorescence after normalization with the background fluorescence of WT cells without the heme sensor. The results are the averages from three to six independent experiments ± standard errors of the means (SEMs), with the solid lines representing the nonlinear exponential regression analysis for the data points at each hemin concentration. (D) Flow cytometry analysis demonstrating the changes in eGFP/mKATE2 ratios of the WThs cells incubated with hemin (100 μM) for the indicated times. The analysis was performed with a population of mKATE2-positive gated cells and is representative of three independent experiments.
FIG 2
FIG 2
Phagocytosed C. neoformans cells show reduced cytosolic heme levels. (A) Wide-field fluorescence microscopy of WThs cells internalized by J774A.1 murine macrophage-like cells. Images for DIC as well as eGFP and mKATE2 fluorescence were obtained at 0 and 24 h postinfection (hpi). Insets in the merge panels correspond to the heat map for the CnHS eGFP/mKATE2 fluorescence ratios as in Fig. 1B. Bars, 10 μm. Images are representative of two independent experiments (n > 70). (B) Wide-field fluorescence microscopy of WThs cells (n > 80) isolated from J774A.1 murine macrophages at the indicated hours postinfection. Images are representative of a minimum of two independent experiments, with the heat map depicting heme levels as in Fig. 1B. Bar, 2 μm. (C) Quantitative analysis of the eGFP/mKATE2 fluorescence ratios of the CnHS from WThs cells isolated from J774A.1 murine macrophages at the indicated hours postinfection. Fluorescence quantification was performed as for Fig. 1B with a minimum of 80 yeast cells. The results represent the averages from two to four independent experiments ± standard errors of the means (SEMs). ****, P < 0.0001, one-way analysis of variance (ANOVA) followed by Tukey’s honestly significant difference (HSD) post hoc test.
FIG 3
FIG 3
Endocytosis is required for heme uptake. (A) Changes in the eGFP/mKATE2 fluorescence ratios were determined using fluorescence microscopy of CnHS in WThs cells incubated with hemin (100 μM) in the presence or absence of chlorpromazine (CPZ; 100 μM) at 30°C for 90 min. A total of 50 cells were analyzed, and the data are representative of three independent experiments. ****, P < 0.0001, one-way ANOVA followed by Tukey’s HSD post hoc test. (B) Quantification of total intracellular heme levels in the WT strain grown in YNB-Li medium with and without hemin (100 μM) in the presence and absence of CPZ (100 μM) for 1 h. The data represent the averages from three independent experiments ± SEMs. ****, P < 0.0001, one-way ANOVA followed by Tukey’s HSD post hoc test; n.s., not significantly different between the groups. (C) Dynamics of the changes in eGFP/mKATE2 fluorescence ratios versus time for the CnHS in WThs cells incubated with hemin (100 μM) in the presence and absence of CPZ (100 μM) or the secretion inhibitor monensin (1.25 mg ml−1) or brefeldin A (50 μg ml−1) for the indicated times. Measurements were performed as for Fig. 1C, and the data represent the averages from three independent experiments ± SEMs.
FIG 4
FIG 4
Defects in heme uptake and trafficking functions reduce the cytosolic heme pool. (A) Changes in eGFP/mKATE2 fluorescence ratios of the CnHS in the indicated strains grown in the presence or absence of hemin (100 μM) at 0, 60, and 120 min. The experiments were performed as for Fig. 1C. The data represent the averages from three independent experiments ± SEMs. Note that the differences in the ratios for the WT strain and the vps45 mutant at time zero are not statistically significant. (B) Spot assays of 10‐fold serial dilutions of the indicated strains on medium supplemented as shown. Cells were starved for iron for 48 h prior to spotting. The plates were incubated for 4 days at 30°C before being photographed. YNB-Li is low-iron YNB medium supplemented with bathophenanthroline disulfonate (150 μM), CPZ; chlorpromazine.
FIG 5
FIG 5
Mitochondrial and vacuolar functions and oxidative stress influence cytosolic heme levels. (A) Changes in eGFP/mKATE2 fluorescence ratios for the CnHS in WThs cells incubated with and without hemin (100 μM) in presence or absence of the vacuole inhibitors chloroquine (100 μM) and bafilomycin A (1 μM). Measurements were performed as for Fig. 1C, and the data were analyzed by averaging the ratios of the eGFP and mKATE2 fluorescent values recorded every 5 min for 1 h. The data represent the averages from two independent experiments ± standard deviations (SDs). *, P < 0.05; **, P = 0.006, one-way ANOVA followed by Tukey’s HSD post hoc test; n.s., not significantly different between the groups. (B) Changes in eGFP/mKATE2 fluorescence ratios for the CnHS in WThs cells incubated with and without hemin (100 μM) in the presence or absence of electron transport chain inhibitors: diphenyleneiodonium (DPI; 50 μM), rotenone (25 μM), salicylhydroxamic acid (SHAM; 10 mM), myxothiazol (5 μM), antimycin A (3 μg ml−1), or potassium cyanide (KCN; 10 mM). Measurements were determined using fluorescence microscopy of >50 cells followed by analysis as for Fig. 3A. Cells were incubated at 30°C (except at 37°C for DPI). The data are representative of 2 to 3 independent experiments. (C) The CnHS response in WThs cells incubated with and without hemin (100 μM) in presence or absence of H2O2 (100 μM) for 30 or 60 min. The data were collected and analyzed as for panel A and represent the averages from three independent experiments ± SEMs. (D) The CnHS response in WThs, sod1Δhs, and sod2Δhs strains incubated with and without hemin (100 μM) at 30°C for 45 min and determined by fluorescence microscopy (n > 100). The data are representative of three independent experiments. ****, P < 0.0001, one-way ANOVA followed by Tukey’s HSD post hoc test; n.s., not significantly different between the groups. Note that the sensor response for the two mutants is statistically different from WT in PBS. ****, P < 0.0001. (E) Spot assays of 10‐fold serial dilutions of the indicated strains on medium supplemented as shown.
FIG 6
FIG 6
Metformin and artemisinin inhibit growth and influence the labile heme pool. Growth of the WT strain in YPD medium with the indicated concentrations of metformin (MET) (A) or artemisinin (ART) (B) at 30°C. Growth was monitored by recording the OD600 every 30 min over 48 h in a 96-well plate using a Tecan Infinite 200 Pro microplate reader. The data represent the means ± standard deviations (SDs) from two independent experiments. (C) Change in the eGFP/mKATE2 fluorescence ratios of the CnHS in WThs cells incubated at 30°C with and without hemin (100 μM) in presence or absence of either 40 mM MET or 1 μg ml−1 ART determined using fluorescence microscopy (n > 50); cells were analyzed as for Fig. 3A. (D) The effect of MET on the heme pool was analyzed by incubating WThs cells with MET (40 or 100 mM) in YPD for 16 h and observing fluorescence by microscopy. The images are representative of a minimum of three independent experiments, with the heat map depicting varied intracellular heme levels as in Fig. 1B. Bars, 2 μm. (E) eGFP/mKATE2 fluorescence ratios of the CnHS in WThs cells incubated with MET (40 mM or 100 mM) for 16 h. The data represent the eGFP/mKATE2 ratios relative to the control growth condition (YPD only) of three independent experiments, with error bars showing the SEMs. (F) Quantification of the total intracellular heme content in the WT strain grown in YPD with MET (40 mM or 100 mM) for 16 h relative to that in YPD without MET. The data represent the averages from three independent experiments ± SEMs. **, P < 0.01; ***, P < 0.001, one-way ANOVA followed by Tukey’s HSD post hoc test. (H) Checkerboard growth assay of the WT strain in YPD medium supplemented with different combinations of MET (0 to 200 mM) and ART (0 to 10 μg ml−1). Cultures were incubated at 30°C for 72 h, and the OD600 was recorded using a Tecan Infinite 200 Pro microplate reader; the data are depicted as a heat map of the average values from two independent experiments. The heat map scale depicts the color representation of the OD600 values for the range 0.00 to 1.75. (H) Growth of the WT strain in YPD medium with the indicated concentrations of MET and ART alone or in combination at 30°C was monitored at OD600. The relative reduction in growth is indicated in the table on the right. The data represent the means ± SDs from two independent experiments.

References

    1. Enoch DA, Yang H, Aliyu SH, Micallef C. 2017. The changing epidemiology of invasive fungal infections, p 17–65. In Lion T. (ed). Human fungal pathogen identification: methods and protocols. Springer, New York, NY. doi: 10.1007/978-1-4939-6515-1_2. - DOI - PubMed
    1. Webb BJ, Ferraro JP, Rea S, Kaufusi S, Goodman BE, Spalding J. 2018. Epidemiology and clinical features of invasive fungal infection in a US health care network. Open Forum Infect Dis 5:ofy187. doi: 10.1093/ofid/ofy187. - DOI - PMC - PubMed
    1. Pfaller MA, Diekema DJ, Turnidge JD, Castanheira M, Jones RN. 2019. Twenty years of the SENTRY antifungal surveillance program: results for Candida species from 1997–2016. Open Forum Infect Dis 6:S79–S94. doi: 10.1093/ofid/ofy358. - DOI - PMC - PubMed
    1. Hendrickson JA, Hu C, Aitken SL, Beyda N. 2019. Antifungal resistance: a concerning trend for the present and future. Curr Infect Dis Rep 21:47. doi: 10.1007/s11908-019-0702-9. - DOI - PubMed
    1. Pfaller MA, Diekema DJ. 2010. Epidemiology of invasive mycoses in North America. Crit Rev Microbiol 36:1–53. doi: 10.3109/10408410903241444. - DOI - PubMed

Publication types

MeSH terms