. 2020 Jul 28;10(1):12653.
doi: 10.1038/s41598-020-69501-1.

α-Hemolysin of uropathogenic E. coli regulates NLRP3 inflammasome activation and mitochondrial dysfunction in THP-1 macrophages

Affiliations

α-Hemolysin of uropathogenic E. coli regulates NLRP3 inflammasome activation and mitochondrial dysfunction in THP-1 macrophages

Vivek Verma et al. Sci Rep. .

Abstract

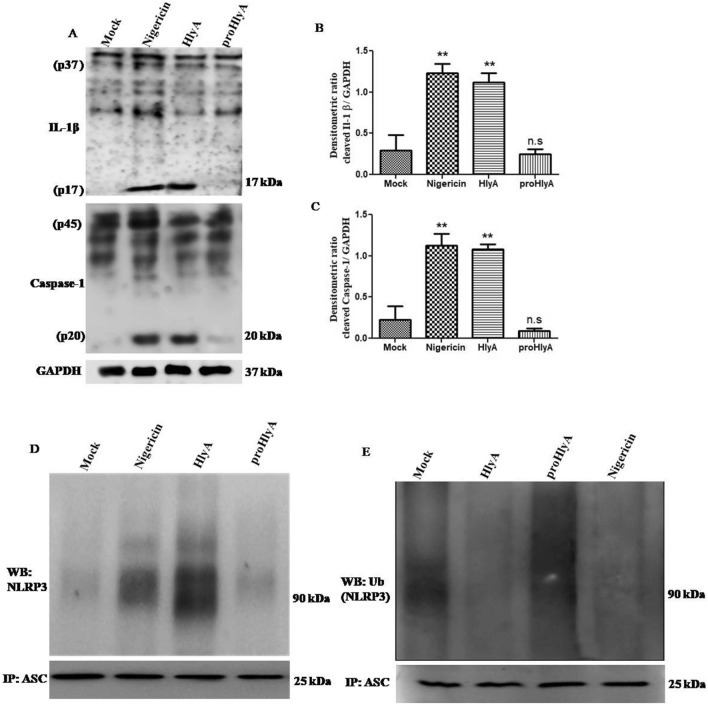
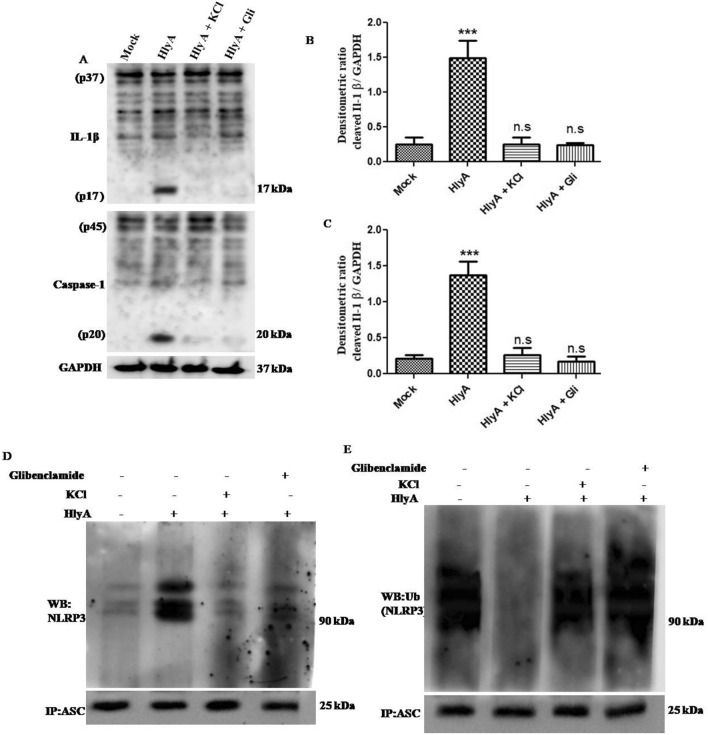
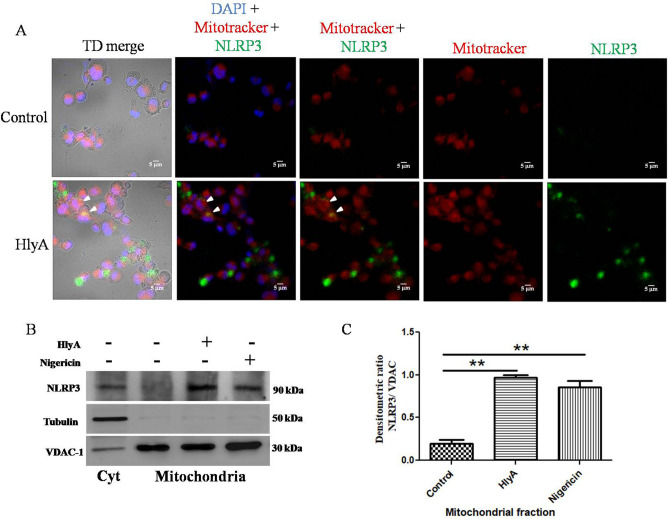
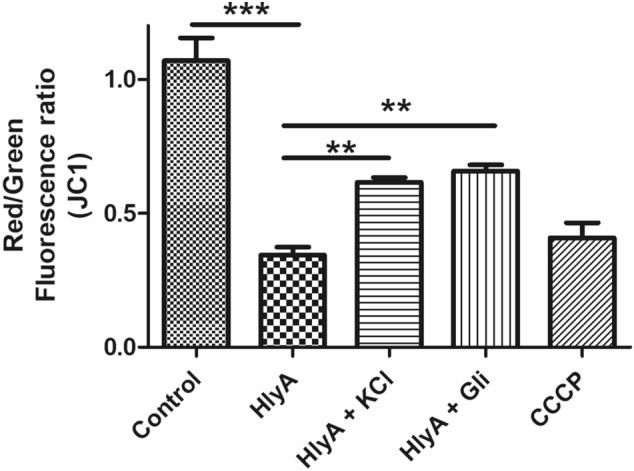
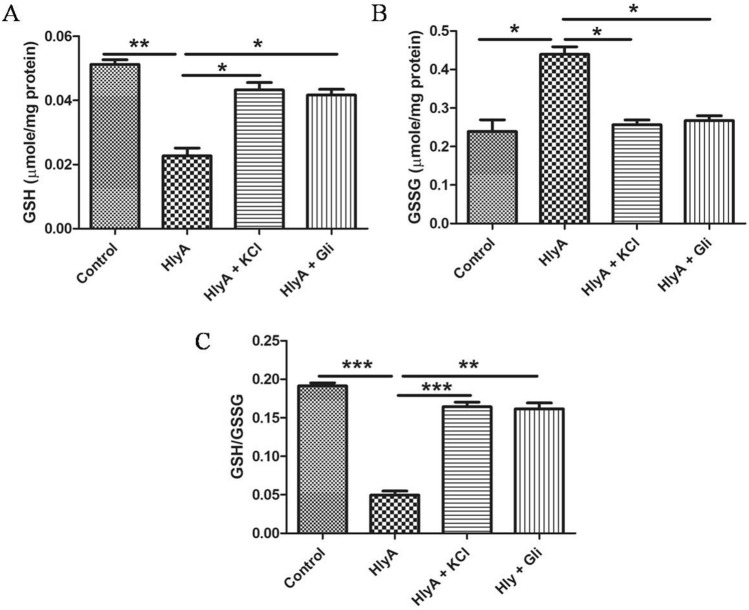
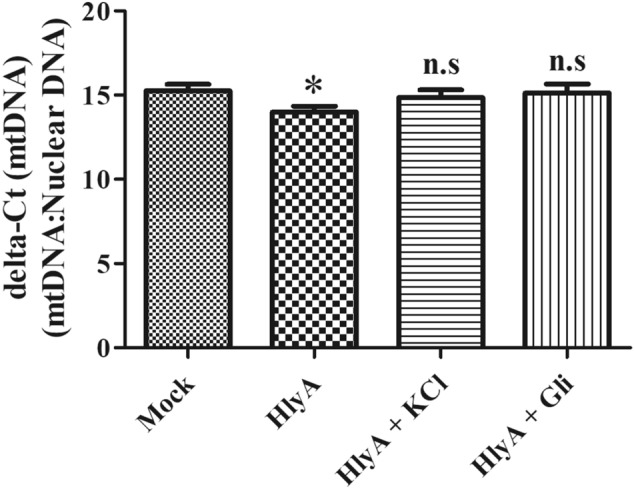
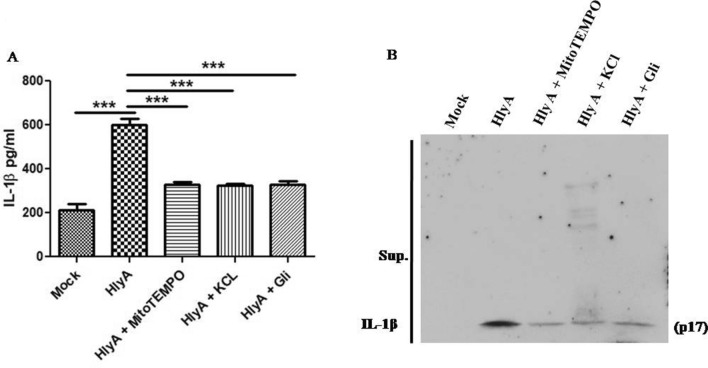
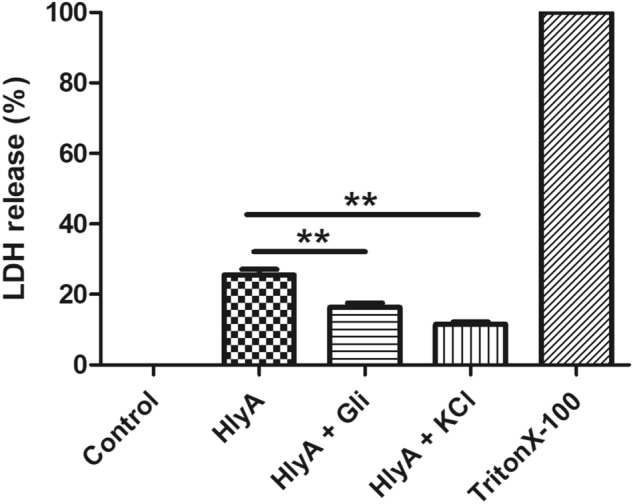
Hemolysin expressing UPEC strains have been associated with severe advanced kidney pathologies, such as cystitis and pyelonephritis, which are associated with an inflammatory response. Macrophages play an important role in regulating an inflammatory response during a urinary tract infection. We have studied the role of purified recombinant α-hemolysin in inducing inflammatory responses and cell death in macrophages. Acylation at lysine residues through HlyC is known to activate proHlyA into a fully functional pore-forming toxin, HlyA. It was observed that active α-hemolysin (HlyA) induced cleavage of caspase-1 leading to the maturation of IL-1β, while inactive α-hemolysin (proHlyA) failed to do so in THP-1 derived macrophages. HlyA also promotes deubiquitination, oligomerization, and activation of the NLRP3 inflammasome, which was found to be dependent on potassium efflux. We have also observed the co-localization of NLRP3 within mitochondria during HlyA stimulations. Moreover, blocking of potassium efflux improved the mitochondrial health in addition to a decreased inflammatory response. Our study demonstrates that HlyA stimulation caused perturbance in potassium homeostasis, which led to the mitochondrial dysfunction followed by an acute inflammatory response, resulting in cell death. However, the repletion of intracellular potassium stores could avoid HlyA induced macrophage cell death. The findings of this study will help to understand the mechanism of α-hemolysin induced inflammatory response and cell death.


Conflict of interest statement

The authors declare no competing interests.

Figures

Figure 1
Figure 1
HlyA induces cleavage of IL-1β and caspase-1 with simultaneously affecting oligomerization and deubiquitination of NLRP3. THP-1m were stimulated with nigericin (30 min), HlyA and proHlyA (2 h) as indicated. Mock shows resting macrophages without any stimulation in all blots. (A) Immunoblots showing pro- and cleaved forms of IL-1β and caspase-1, GAPDH was used as an endogenous control. (B) Bar graphs showing integrated densitometric value (IDV) of cleaved IL-1β (p17) and (C) cleaved caspase-1 (p20). Results were expressed as Mean IDV ± SEM and analyzed by using one-way ANOVA with Bonferroni’s post test. (D) Co-immunoprecipitation of NLRP3 with ASC shows oligomerization of NLRP3 with ASC during various stimulations. ASC was precipitated with ASC antibody and further NLRP3 was detected by immunoblotting. ASC was also checked in input lysates through immunoblotting. (E) Shows endogenous ubiquitination of NLRP3 during stimulation of THP-1m with HlyA and proHlyA for 2 h. ASC was also detected in input lysates through immunoblotting. Blots are representative of three independent experiments. P value is shown as **p ≤ 0.01, n. s = non significant.
Figure 2
Figure 2
Oligomerization and deubiquitination of NLRP3 is dependent on intracellular K+ concentration during HlyA stimulation. THP-1m cells were treated with 140 mM of potassium chloride (KCl) and 100 μM of glibenclamide (Gli) for 30 min followed by stimulation with HlyA for 2 h. (A) Immunoblots showing pro and cleaved forms of IL-1β and caspase-1; GAPDH was used as endogenous control. (B) Bar graphs showing integrated densitometric value (IDV) of cleaved IL-1β and (C) cleaved caspase-1, under different HlyA stimulation, as mentioned. Results were expressed as Mean IDV ± SEM and analyzed by using one-way ANOVA with Bonferroni’s post test. (D) Co-immunoprecipitation with anti-ASC antibody and immunoblotting with anti-NLRP3 antibody shows oligomerization of NLRP3 with ASC during various stimulations and treatments as mentioned. ASC was also checked in input lysates by immunoblotting. (E) Co-immunoprecipitation with anti-ASC antibody and immunoblotting with anti-Ubiquitin antibody shows ubiquitination status of NLRP3 during various stimulations and treatments as mentioned earlier. ASC was also checked in input lysates by immunoblotting. Blots are representative of three independent experiments. P value is shown as ***p ≤ 0.001, n. s = non significant.
Figure 3
Figure 3
NLRP3 colocalizes in mitochondria during HlyA stimulation. (A) THP-1m cells were stimulated with HlyA for 2 h and then stained with Mitotracker (red) for mitochondria and DAPI (blue) for nucleus. NLRP3 was probed by anti-NLRP3 antibody and detected by secondary Alexa fluor 488 (green) and observed under ×40 objective through confocal microscopy (Scale = 5 μm). White arrows indicate the colocalization (yellow) of NLRP3 (green) with mitochondria (red). Figures are representative of 3 independent experiments. (B) THP-1m cells were treated with HlyA (2 h) and nigericin (30 min) as indicated and then followed for preparation of cytoplasmic extract and mitochondria isolation. Cytoplasmic extracts and mitochondrial fractions were immunoblotted for the presence of NLRP3, tubulin and VDAC1 proteins. Immunoblot shows the presence of NLRP3 in mitochondrial and cytoplasmic fractions whereas NLRP3 is present in mitochondrial fractions of HlyA stimulated cells, while absent in mitochondria from unstimulated THP-1m cells. Tubulin was immunoblotted to check the purity of mitochondrial fractions for contamination of cytoplasmic content and VDAC1 was used as a loading control for mitochondrial fractions. Blots are representative of 3 independent experiments. (C) Bar graph showing integrated densitometric values (IDV) of NLRP3 normalized to VDAC1 in Mitochondrial fractions. Comparisons between multiple groups were made using one-way ANOVA with Bonferroni’s post test. P value is shown as **p ≤ 0.01.
Figure 4
Figure 4
HlyA induces mitochondrial dysfunction in a potassium dependent manner. The graph shows red/green fluorescence ratio as a measurement of mitochondrial membrane potential (ΔΨm) during various stimulations of THP-1m. Cells were seeded and differentiated in 96-well clear well black plate and then stimulated with HlyA (2 h) alone or in combination with 30 min pretreatment of cells by 100 μM glibenclamide (Gli) and 140 mM KCl as indicated, followed by staining with JC1 dye for 30 min. JC1 remains as a monomer in the cytoplasm, where it gives a green fluorescence, while on its directional uptake inside the mitochondria, promoted by membrane potential, leads to the formation of JC1 aggregates, which fluoresce at red fluorescence. Fluorescence was taken at Ex 485 and Em 530 for green aggregates and Ex 488 and Em 590 for red aggregates. The graph shows decreased mitochondrial membrane potential (ΔΨm) during HlyA stimulation, whereas in the case of pretreatment with Gli and KCl along with HlyA stimulation, ΔΨm was increased. Comparisons between multiple groups were made using one-way ANOVA with Bonferroni’s post test. P value is shown as **p ≤ 0.01, ***p ≤ 0.001.
Figure 5
Figure 5
α-Hemolysin induces oxidative stress in mitochondria of THP-1m and inhibition of potassium efflux brought glutathione-redox status to normal. GSH:GSSG estimation was performed to evaluate the effect of α-hemolysin (HlyA) on THP-1m mitochondrial redox state. Additionally, the effect of glibenclamide and potassium chloride were also assessed on hemolysin induced oxidative stress in THP-1m. THP-1m pre-treated with glibenclamide (100 μM, 30 min prior to stimulation) and KCl (140 mM, 30 min prior to stimulation) were stimulated with HlyA for 2 h. Data shown is the average of three independent experiments. Comparisons between multiple groups were made using one-way ANOVA with Bonferroni’s post test. P value is shown as *p ≤ 0.05, **p ≤ 0.01, ***p ≤ 0.001.
Figure 6
Figure 6
Mitochondrial Biogenesis was increased in THP-1m cells upon stimulation with HlyA. mtDNA copy number was quantified through quantitative real-time PCR in THP-1m cells. THP-1m cells were stimulated with HlyA for 2 h and prior to stimulation of THP-1m, cells were treated with 140 mM of potassium chloride (KCl) and 100 μM of glibenclamide (Gli) for 30 min as indicated. mtDNA copy numbers were normalized to the nuclear DNA copy number of 18S and represented as delta-Ct values. Lower delta-Ct indicates an increase in gene expression and vice versa. The graph shows a significant (*p = 0.01) increase in mtDNA only during HlyA stimulation, as compared to the mock and other stimulations of HlyA, where cells were pretreated with Gli and KCl. Results are representative of three biological and three technical replicates. n.s = non significant. Comparisons between multiple groups were made using one-way ANOVA with Bonferroni’s post test.
Figure 7
Figure 7
Cytokine IL-1β release during α-hemolysin stimulation along with mitoROS inhibition and blockage of potassium efflux. (A) ELISA was performed to assess IL-1β release in cell culture supernatants during HlyA stimulation, along with mitochondrial ROS inhibitor (MitoTEMPO 20 μM) and potassium efflux inhibition (140 mM KCl and Glibenclamide 100 μM). Data is represented as IL-1β concentration in pg/ml (Mean ± SEM). For statistical analysis, one-way ANOVA with Bonferroni’s test for multiple comparisons was used. P value is shown as ***p ≤ 0.001. (B) Immunoblot showing the cleaved form of IL-1β in acetone precipitated culture supernatants.
Figure 8
Figure 8
α-hemolysin induced cell death in THP-1 macrophages, reversed by inhibition of potassium efflux. LDH release assay was performed to evaluate the effect of α-hemolysin (HlyA) on THP-1m cell death. Additionally, the effect of glibenclamide and potassium chloride were assessed on hemolysin induced cell death of THP-1m. THP-1m pre-treated with glibenclamide (100 μM, 30 min prior to stimulation) and KCl (140 mM, prior 30 min to stimulation) were stimulated with α-hemolysin for 2 h. Data is represented as percentage LDH release (Mean ± SEM). Comparisons between multiple groups were made using one-way ANOVA with Bonferroni’s post test. P value is shown as ** ≤ 0.01.

References

    1. Foxman B. The epidemiology of urinary tract infection. Nat. Rev. Urol. 2010;7:653. - PubMed
    1. Ragnarsdóttir B, Lutay N, Grönberg-Hernandez J, Köves B, Svanborg C. Genetics of innate immunity and UTI susceptibility. Nat. Rev. Urol. 2011;8:449. - PubMed
    1. Hotchkiss RS, Karl IE. The pathophysiology and treatment of sepsis. N. Engl. J. Med. 2003;348:138–150. - PubMed
    1. Hill M, Drasar B. The normal colonic bacterial flora. Gut. 1975;16:318. - PMC - PubMed
    1. Ronald A. The etiology of urinary tract infection: Traditional and emerging pathogens. Dis. Mon. 2003;49:71–82. - PubMed

Publication types

MeSH terms