. 2020 Jul 28;11(1):3769.
doi: 10.1038/s41467-020-17557-y.

Butyrophilin-like proteins display combinatorial diversity in selecting and maintaining signature intraepithelial γδ T cell compartments

Affiliations

Butyrophilin-like proteins display combinatorial diversity in selecting and maintaining signature intraepithelial γδ T cell compartments

Anett Jandke et al. Nat Commun. .

Abstract

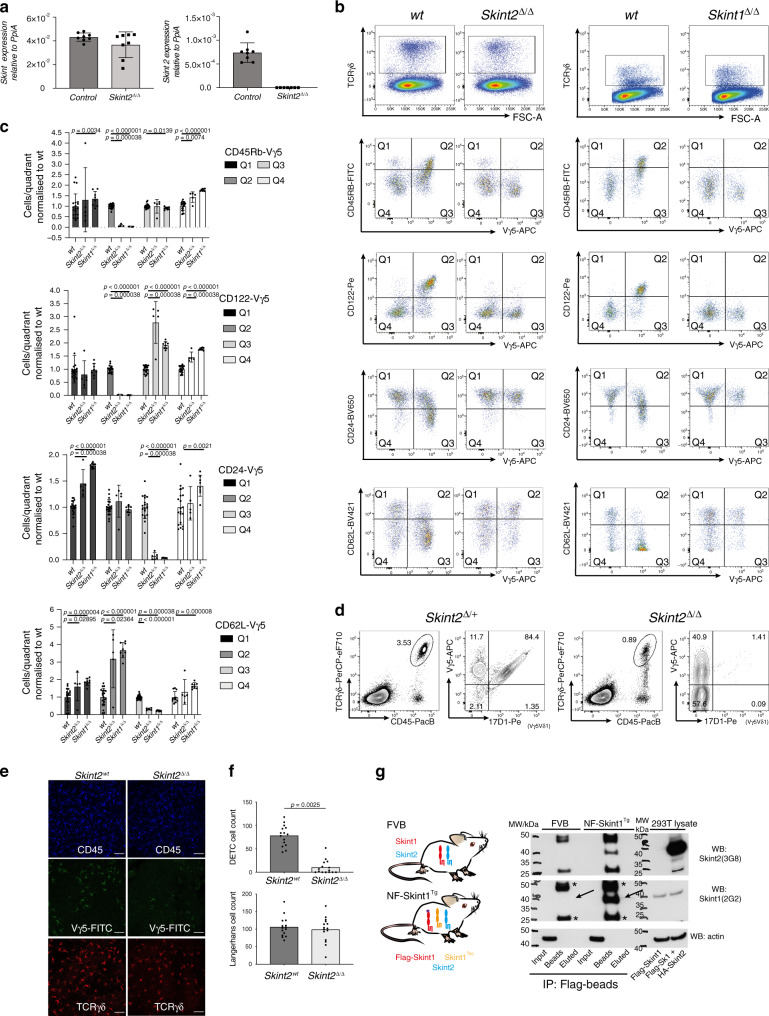
Butyrophilin-like (Btnl) genes are emerging as major epithelial determinants of tissue-associated γδ T cell compartments. Thus, the development of signature, murine TCRγδ+ intraepithelial lymphocytes (IEL) in gut and skin depends on Btnl family members, Btnl1 and Skint1, respectively. In seeking mechanisms underlying these profound effects, we now show that normal gut and skin γδ IEL development additionally requires Btnl6 and Skint2, respectively, and furthermore that different Btnl heteromers can seemingly shape different intestinal γδ+ IEL repertoires. This formal genetic evidence for the importance of Btnl heteromers also applied to the steady-state, since sustained Btnl expression is required to maintain the signature TCR.Vγ7+ IEL phenotype, including specific responsiveness to Btnl proteins. In sum, Btnl proteins are required to select and to maintain the phenotypes of tissue-protective γδ IEL compartments, with combinatorially diverse heteromers having differential impacts on different IEL subsets.


Conflict of interest statement

A.C.H. is equity holder in GammaDelta Therapeutics and in Adaptate Biotherapeutics. The remaining authors declare no competing interests.

Figures

Fig. 1
Fig. 1. DETC development requires Skint2 and Skint1 which form heteromers.
a qPCR analysis for Skint1 and Skint2 message in adult mouse ear epidermis normalised to Ppia. Control, n = 8,  Skint2Δ/Δ, n = 8. Data are mean ± SD of a representative experiment of three independent experiments. b Analysis of E16.5 thymocytes in WT, Skint2Δ/Δ and Skint1Δ/Δ animals, gated on live γδ T cells (top panel). Thymic γδ cells (gate top row) were assessed for CD45RB, CD122, CD24 and CD62L and expression of the Vγ5 TCR. Left panel: WT vs. Skint2Δ/Δ, right panel: WT vs. Skint1Δ/Δ. c Quantification of cell populations in quadrants Q1 to Q4 as indicated in (b), normalised to mean of wt = 1 for each quadrant, mean ± SD. WT n = 20; Skint2Δ/Δ n = 5; Skint1Δ/Δ n = 8 (two-tailed Man–Whitney analysis). d FACS analysis of ear epidermis in control (Skint2Δ/+) and Skint2Δ/Δ mice. CD45+, TCRγδ+ cells (gate left panel) were stained for presence of Vγ5Vδ1+ DETC (stained by Vγ5 and 17D1 antibody, right panel). e Microscopy images of adult mouse ear epidermal sheets in control and Skint2Δ/Δ mice. Comparison of DETC stained for CD45 (top: blue) and Vγ5+ (middle: green) γδ-TCR(GL3+) cells (bottom: red). Scale bar 50 µm. f Quantification of DETC and Langerhans cell numbers from microscopy images, n = 15 for each genotype (data are from three independent experiments, two-tailed Man–Whitney analysis). g Immunoprecipitation of Flag-tagged Skint1 from FVB or NF-Skint1Tg animals. Left: scheme of FVB mice expressing Skint1 and Skint2. Scheme: Top: wt FVB mice express endogenous, untagged Skint1 and Skint2; bottom: NF-Skint1Tg animals express a Flag-tagged Skint1 and untagged Skint2 on the Skint1Tac background. Right: Immunoprecipitation with anti-Flag antibody from lysates of pooled thymi of FVB and NF-Skint1Tg animals (nFVB = 12, nNFSkint1Tg = 22, 1 experiment). Expression control in 293 lysates transduced with either Flag-Skint1 alone or Flag-Skint1 & HA-Skint2 constructs. Long arrows: Skint1 band, asterisks: non-specific bands reflecting anti-FLAG Ig chain detection. Full scans are provided in Supplementary Fig. 7.
Fig. 2
Fig. 2. The intestinal IEL compartment is shaped by expression of distinct Btnl molecules.
a Targeting strategy to generate conditional and constitutive Btnl1 and Btnl6 knockout mice. Depending on the Cre-transgenic strain used (i/ii) resulting animals are either ubiquitously deleted for the respective Btnl gene (Δ/Δ), or harbour a tissue-specific deletion (Δgut). Black: translated exons, grey: untranslated regions, blue triangles: loxP sites. b Quantification of Vγ7+ IEL (black gate in c) in Btnl1 and Btnl6-deficient strains. Data are mean ± SEM of ≥2 independent experiments. nctrl: 32, nBtnl1-KOMP: 4, nBtnl1Δgut: 8, nBtnl6Δgut: 8, nBtnl6ΔΔ: 9. Statistical analysis: Kruskal–Wallace and Dunn’s multiple comparison analysis. c FACS profiles of IEL preparations from animals of indicated genotypes, gated on TCRγδ+ cells. The label Btnl1Komp indicates germline Btnl1KO animals generated by the IMPC that have been described. Black gate: all Vγ7+ cells, green gate: Vγ7+Vδ4+ cells. d Quantification of IEL: Vγ7+ IEL numbers (top), %Vγ7+ IEL (middle) and %CD122+ cells (bottom) in animals of indicated genotypes. Data are mean ± SD of a representative experiment. Top panel: nctrl: 12, nBtnl1: 2, nBtnl6Δgut: 2, nBtnl6Δ/Δ: 3. Statistical analysis: Kruskal–Wallace & Dunn’s multiple comparison. Middle and bottom panel: nctrl: 12, nBtnl1Δgut: 3, nBtnl6Δgut: 2, nBtnl6Δ/Δ: 3. Statistical analysis: Kruskal–Wallace & Dunn’s multiple comparison. e Histogram for surface expression of CD122 in Vγ7+ IEL from animals of the indicated genotypes. f Scheme depicting the strategy to generate Btnl146Indel mice. Short guide RNAs flanking the 5′ region of Btnl1 and 5′ region of Btnl6 were injected with HDR templates. Due to the nature of CRISPR/Cas9 the intervening region was excised and a Btnl146INDEL mouse lacking the Btnl1-4-6 locus was created. Blue triangle: loxP site that was inserted due to the nature of the HDR template (see Methods). g FACS analysis of TCRβCD3+ IEL in Btnl1/4/6-KO and Btnl146INDEL mice. Colours correspond to coloured bar graphs in (h) and (i). h Quantification of Vγ7+ IEL depicted in (g). Data are mean ± SEM of three independent experiments. nCtrl: 12, nBtnll1Δ/Δ: 7, nBtnl4KOMP: 7, nBtnl6Δgut: 11, nBtnl146Indel: 10. Statistical analysis: Kruskal–Wallace & Dunn’s multiple comparison. i Surface expression of CD122 (left) and Thy1.2 (right) in Vγ7+ IEL from animals of indicated genotypes.
Fig. 3
Fig. 3. Btnl6 deficiency alters Vδ gene usage.
a FACS plots of TCRδ chain usage in animals of indicated genotypes. The Vδ4 and Vδ6.3 chains are plotted against each other in Vγ7+ IEL (left column) and Vγ7 cells (right column). b Quantification of Vγ7+Vδ6.3+ (top) and Vγ7+Vδ4+ cell numbers (bottom), in animals of indicated genotypes. nctrl: 12, nBtnl1: 2, nBtnl6Δgut: 2, nBtnl6Δ/Δ: 3. Data are mean ± SD of a representative experiment. c Quantification of Vδ-chain usage in Vγ7+ IEL as depicted in quadrants (a) in animals of indicated genotypes nctrl: 7, nBtnl1: 2, nBtnl4KOMP: 3, nBtnl6Δgut: 5, nBtnl146Indel: 4. Statistical analysis: two-way ANOVA & Tukey’s multiple comparison post test. Data are mean ± SD of a representative experiment.
Fig. 4
Fig. 4. Vγ7+ IEL respond to different Btnl pairings.
a Left: Alignment of the IgV-domain sequences of Btnl1, Btnl4 and Btnl6. Canonical Ig-fold β-strands [A, B, C, C′, C″, D, E, F, G] are indicated with arrows. CFG face motifs previously shown in Btnl6 to be critical for the response of Vγ7+ cells are highlighted in orange [AQPTP/SRFSE/SRFSA], blue [QF/HF/HF] and red [SQEVS/YDEAI/YEEAI]. Right: Cartoon representation of the IgV-domain of Btnl6, derived with 3D-JIGSAW from the crystal structure of BTN3A1 (PDB accession code 4F80), with the same annotation as in (a). Side chains are displayed for the two residues that differ in the CFG face motifs of Btnl6 versus Btnl4 (Ala versus Glu, Glu versus Asp). b TCR downregulation (left) and CD69 upregulation (right) by J76 cells expressing a Vγ7Vδ4 TCR and co-cultured with 293T transiently transfected with Btnl1 in combination with Btnl4 wild-type (L4WT) or mutated in the CFG region as indicated on the X-axis. Results are normalised to 293T transfected with empty vector (EV). Data are represented as mean ± SD of duplicate co-cultures, representative of n = 2 independent experiments. FC, fold change. c Experimental setup to analyse IEL from various KO strains in co-cultures with MODE-K cells overexpressing either Btnl1 and Btnl4 (L1L4) or Btnl1 and Btnl6 (L1L6). IELs are isolated from indicated mouse strains which can display distinct combinations of Btnl molecules on the epithelial surface during development. Following isolation, IEL were co-cultured o.n. with MODE-K cells displaying either Btnl1+4 or Btnl1+6 on their surface. MODE-K cells transduced with empty vector (EV) were used as control. d IEL response to MODE-K cells expressing different Btnl dimers (L1L4 or L1L6) was measured by analysing CD25+ cells gated on Vγ7+ cells in animals of indicated genotypes. Data are mean ± SEM of five independent experiments, nctrl: 13, nBtnl1KO: 8, nBtnl4KO: 9, nBtnl6KO: 10, nBtnl146Indel: 15. Statistical analysis: two-way ANOVA & Tukey’s multiple comparison post test. e IEL response to MODE-K cells expressing different Btnl dimers (L1L4 or L1L6) was measured as %CD25+ cells and further gated on Vγ7+Vδ4+ (left) or Vγ7+Vδ6.3+ (right) cells in animals of indicated genotypes. Data are mean ± SEM of five independent experiments, nctrl: 13, nBtnl4KO: 9, nBtnl6KO: 10. Statistical analysis: two-way ANOVA & Tukey’s multiple comparison post test.
Fig. 5
Fig. 5. Depletion of individual Btnl genes does not impact Vγ7 IEL numbers but differentially affects CD122 expression.
a Top: Experimental scheme to analyse the effect of Btnl1 and Btnl6 tamoxifen-mediated depletion at different timepoints. Bottom: RNAscope analysis for Btnl1 and Btnl6 in animals of indicated genotypes at 3 or 17 days post tamoxifen administration. Data are representative micrographs from one time course experiment with numbers of gut sections stained per genotype as: day 8: nctrl: 4, nBtnl1f/f-VcreERT2+: 2, nBtnl6f/f-VcreERT2+: 4, day 22: nctrl: 4, nBtnl1f/f-VcreERT2+: 1, nBtnl6f/f-VcreERT2+: 2, scale bar: 200 µm. b Quantification of Vγ7+ cells at indicated timepoints post tamoxifen (red and blue side arrows denote for comparison the average percentage of Vγ7+ IEL in full knockout animals (see also Figs. 1–3). Data are mean ± SD, day 8: nctrl: 6, nBtnl1f/f-VcreERT2+: 2, nBtnl6f/f-VcreERT2+: 4, day 15: nctrl: 2, nBtnl1f/f-VcreERT2+: 3, nBtnl6f/f-VcreERT2+: 3, day 22: nctrl: 2, nBtnl1f/f-VcreERT2+: 1, nBtnl6f/f-VcreERT2+: 4. c Top: Experimental scheme to analyse the effect of Btnl1 and Btnl6 tamoxifen-mediated depletion after 3 days. Bottom: Vδ-chain usage in Vγ7+ IEL in control (black), Btnl1f/f,VillinCreERT2+ (orange), Btnl6Δgut (purple) and Btnl6f/f,VillinCreERT2+ (light blue) animals. The Vδ4 and Vδ6.3 chain gated on Vγ7+ IEL are plotted against each other. d Histogram of surface CD122 expression in indicated subpopulations of Vγ7+ IEL in animals of indicated genotypes. e Percentage of Vγ7 cells (left) and usage of the Vδ4 and Vδ6.3 chain (right) in Vγ7+ IEL, 56 days after tamoxifen in Btnl6f/f VillinCreERT2− (black) and Btnl6f/f VillinCreERT2+ (blue) animals. f Quantification of Vδ-chain usage in Vγ7+ IEL in control, Btnl1f/f,VillinCreERT2+ and Btnl6f/f,VillinCreERT2+ knockout animals, 3 (left graph) and 56 days (right) after tamoxifen administration. Mean ± SEM from two experiments per timepoint, left graph: nctrl: 6, nBtnl1f/f-VcreERT2+: 3, nBtnl6f/f-VcreERT2+: 6, nBtnl6Δgut: 2, right graph: nctrl: 5, nBtn61f/f-VcreERT2+: 15.
Fig. 6
Fig. 6. Response and maintenance by Btnl1 and Btnl6.
a Left: Targeting strategy to generate animals harbouring a floxed Btnl146 locus, which can be excised after tamoxifen administration. Right: Experimental design for IEL analysis (c, d) and co-culture experiment (e) following Btnl146 locus depletion. During development Btnl molecules are expressed on the IEC and only after tamoxifen depletion Btnl expression is lost. Following loss of Btnl expression, IELs are harvested and subjected to co-cultures with MODE-K cells expressing specific Btnl combination. b Quantification of αβ (left), Vγ7+ (middle) and Vγ1+ (right) T cells following Btnl146 locus depletion. nctrl: 9, nBtnl146VcreERT2+: 14. Data are mean ± SD. c Quantification Vδ chain usage in Vγ7+ cells in animals of indicated genotypes under indicated conditions. nctrl: 6, nBtnl146VcreERT2+: 8. Data are mean ± SD. d Co-culture of MODE-K cells transduced with EV, L1L4 or L16 with IEL from control, or Btnl146f/f;VillinCreERT2+ animals. Controls are pooled: Btnl146f/f,VillinCreERT2+ that did not receive tamoxifen and Btnl146f/f,VillinCreERT2 animals that did receive Tamoxifen. Data are mean ± SD (nctrl: 6, nBtnl146VcreERT2+: 8). Statistical analysis two-way ANOVA & Tukey’s multiple comparison post test. e IEL response in co-cultures of MODE-K cells transduced with EV, L1L4 or L1L6 with IEL from control or Btnl146f/f;VillinCreERT2+ animals that did receive tamoxifen in Vγ7Vδ4+(left graph) and Vγ7Vδ6.3+(right graph) cells. nctrl: 6, nBtnl146VcreERT2+: 8.

References

    1. Zhu J, et al. Immune surveillance by CD8αα+ skin-resident T cells in human herpes virus infection. Nature. 2013;497:494–497. - PMC - PubMed
    1. Perdiguero EG, Geissmann F. The development and maintenance of resident macrophages. Nat. Immunol. 2016;17:2–8. - PMC - PubMed
    1. Panduro M, Benoist C, Mathis D. Tissue Tregs. Annu Rev. Immunol. 2016;34:609–633. - PMC - PubMed
    1. Nielsen MM, Witherden DA, Havran W. γδ T cells in homeostasis and host defence of epithelial barrier tissues. Nat. Rev. Immunol. 2017;17:733–745. - PMC - PubMed
    1. Goodman T, Lefrancois L. Intraepithelial lymphocytes. Anatomical site, not T cell receptor form, dictates phenotype and function. J. Exp. Med. 1989;170:1569–1581. - PMC - PubMed

Publication types

MeSH terms

Substances

LinkOut - more resources