. 2020 Jul 28;10(1):12579.
doi: 10.1038/s41598-020-69429-6.

EGCG impedes human Tau aggregation and interacts with Tau

Affiliations

EGCG impedes human Tau aggregation and interacts with Tau

Shweta Kishor Sonawane et al. Sci Rep. .

Abstract

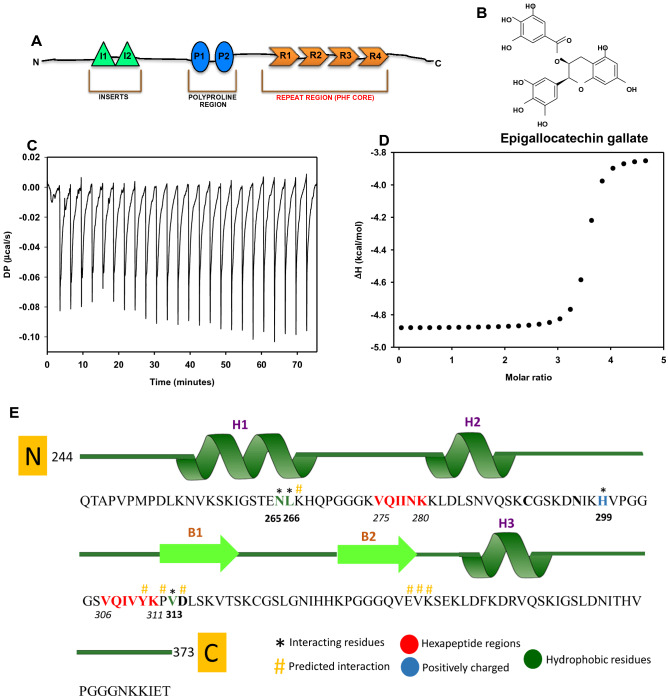
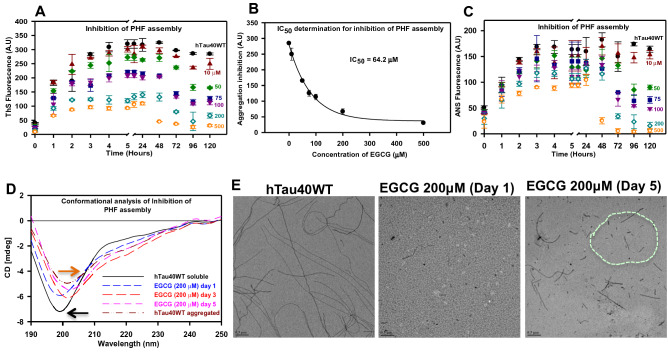
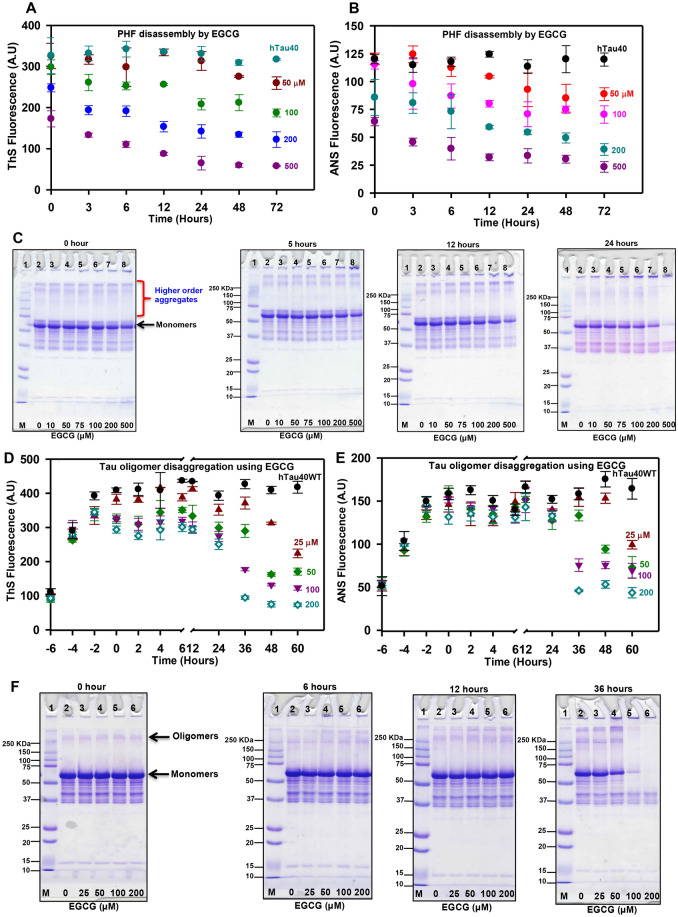
Tau aggregation and accumulation is a key event in the pathogenesis of Alzheimer's disease. Inhibition of Tau aggregation is therefore a potential therapeutic strategy to ameliorate the disease. Phytochemicals are being highlighted as potential aggregation inhibitors. Epigallocatechin-3-gallate (EGCG) is an active phytochemical of green tea that has shown its potency against various diseases including aggregation inhibition of repeat Tau. The potency of EGCG in altering the PHF assembly of full-length human Tau has not been fully explored. By various biophysical and biochemical analyses like ThS fluorescence assay, MALDI-TOF analysis and Isothermal Titration Calorimetry, we demonstrate dual effect of EGCG on aggregation inhibition and disassembly of full-length Tau and their binding affinity. The IC50 for Tau aggregation by EGCG was found to be 64.2 μM.


Conflict of interest statement

The authors declare no competing interests.

Figures

Figure 1
Figure 1
The interaction and binding affinity of Tau and EGCG. (A) Tau domain organization. (B) The structure of polyphenol EGCG. (C) Isothermal titration calorimetry carried out for 20 μM full-length Tau and 500 μM EGCG shows multi-site binding between the two. (D) The heat plot for Tau-EGCG interaction suggests n = 3.5 binding sites. Thus, there are more than one binding events involved in Tau-EGCG interaction. (E) A schematic diagram of the Tau K18 model depicting three predicted alpha helices (H1, H2, and H3) and two predicted beta sheets (B1, B2) with two distinct and characteristic hexa-peptide regions 275VQIINK280 and 306VQIVYK311. The predicted ligand interacting residues, color coded according to their type of interaction is also shown.
Figure 2
Figure 2
Simulation studies of Tau and EGCG. (A) The binding pocket of EGCG to the Tau model, shown along with the interacting residues after molecular docking. (B) The interaction between EGCG and Tau in the binding pocket is depicted, including the major residues involved and the predicted residues, which might be responsible in further interactions as well as the type of interactions they are involved in are shown. (C) The RMSD evolution of the protein (left Y-axis) and that of the ligand (right Y-axis) are shown. While the protein RMSD gives insights into the structural conformation of the protein throughout the simulation, the ligand RMSD indicates how stable the ligand is with respect to the protein and its binding pocket. Both the RMSDs are seen to stabilize as the simulation progresses. The ligand RMSD is notably stable of the two, suggesting that the binding pocket conformation is maintained throughout the simulation. (D) The Rg values of protein (left Y-axis) and ligand (right Y-axis) are shown. Both Rg values do not show much variation indicating that the structure of the protein and the binding pose of the ligand are maintained over the course of the simulation. (E) The electrostatic and hydrophobic interactions between the ligand and protein over the entire timescale of the simulation are depicted, showing the dominant, yet highly dynamic and transitionary nature of the same.
Figure 3
Figure 3
NMR spectroscopic studies of repeat Tau with EGCG. 1H-15 N-HSQC plots showing the chemical shift perturbations. For all the NMR experiments a solution of 200 μM of repeat Tau in 500 μL phosphate buffer containing 10% D2O is used. (A) Overlay of 1H–15N-HSQC plots (at 278 K) for the titration of 200 μM of repeat Tau against 0 μM (in orange), 100 μM (in blue), 500 μM (in red), 1,000 μM (in olive green) and 2000 μM (in coral, no visible signals) of EGCG. Continuous drop in the intensity of HSQC cross peaks indicates an increasing precipitation of repeat Tau with increasing concentrations of EGCG. (B) Overlay of 1H–15N-HSQC plot of repeat Tau at 298 K with that of repeat Tau in presence of 2000 μM of EGCG (sample from titration at 278 K, which was brought back to 298 K). (C) Overlay of 1H–15N-HSQC plot of repeat Tau (at 278 K) (without EGCG, golden) along with 1H–15N-HSQC plots measured for the precipitation of 200 μM of repeat Tau in presence of 500 μM of EGCG after t = 0 h (blue) and t = 24 h (grey). Upon addition of 500 μM of EGCG, the HSQC cross peaks are slightly displaced and lost intensity indicating precipitation of repeat Tau. After 24 h standing, no apparent change was observed in the HSQC cross peak intensity. (D) ThS fluorescence of NMR samples at 0 and 24 h suggesting no aggregation of repeat Tau in presence of EGCG. (E) SDS-PAGE analysis of NMR samples at 24 h showing no aggregation of repeat Tau in presence of EGCG.
Figure 4
Figure 4
EGCG prevents Tau aggregation and changes their conformation in vitro. (A) The inhibitory effect of EGCG on the polymerization of full-length Tau monitored by ThS fluorescence. (B) The IC50 for EGCG for full-length Tau is 64.2 μM. (C) The inhibition of Tau PHF assembly assessed by ANS fluorescence shows a time and dose dependent decrease in the hydrophobicity of the Tau protein. (D) The CD analysis of EGCG treatment shows the formation of mixed Tau structures in a time dependent manner. (E) The control reaction shows the presence of long mature filaments whereas the EGCG treatment shows increase in the fragility of the Tau filaments at with increasing in time. The 200 μM EGCG treatment shows broken filaments at the day 5 of incubation.
Figure 5
Figure 5
The preformed Tau fibrils and oligomers dissolved by EGCG. (A) The EGCG mediated dissolution of mature Tau fibrils recorded by ThS fluorophore showing the disassembly of PHFs. (B) The ANS fluorescence shows a time dependent decrease as the fibrils are dissolved. (C) The SDS-PAGE analysis of disassembly of Tau PHFs. (D) The ThS fluorescence shows the inhibitory effect of EGCG on the dissolution of Tau oligomers in a concentration dependent manner. (E) The ANS fluorescence shows the decrease in intensity with time and concentration suggesting loss of hydrophobicity of Tau oligomers. (F) The SDS-PAGE analysis shows the presence of oligomers at the time of compound addition (0 h) which are slowly cleared with time.
Figure 6
Figure 6
Modification of repeat Tau by EGCG. (A) Repeat domain of Tau showing two hexapeptide motifs. (B) The MALDI-TOF spectra of untreated repeat Tau showing a single peak at desired molecular weight of 13.7 KDa. (C) The EGCG treated repeat Tau shows an adjacent peak (red arrow) in addition to the soluble Tau peak suggesting the modification of Tau with EGCG as increase in molecular weight.
Figure 7
Figure 7
SEC for polyamines treated Tau. Tau was subjected to aggregation in presence of heparin as inducer. (A) At 0 h Tau was eluted as monomer, both in presence and absence of EGCG. (B) Further incubation led to aggregation of Tau, at 3 h of incubation EGCG showed more aggregation in Tau. (C) Similarly, at 24 the peak intensity of Tau in presence of EGCG was high when compared to control. This suggests that EGCG is driving Tau towards the formation of higher order aggregates. (D) Cell viability studies indicates that these conformers were non-toxic in neuro2A cells.
Figure 8
Figure 8
Effect of EGCG on cell viability. Toxicity was induced with 5 μM Tau aggregates and rescue in presence of EGCG (0–200 μM) in neuro2a cells. (A) Cell viability assay shows EGCG was non-toxic to neuronal cells at varying concentrations (0–200 μM) p < 0.001 and enhance the cell survival. (B) Tau aggregates induce toxicity in neuro2a cells at 0 μM EGCG p < 0.05(denoted as *) EGCG significantly rescues toxicity of Tau aggregate mediated toxicity till and enhances viability p < 0.05 (denoted as #). (C) EGCG inhibits Tau aggregation by forming intermediate Tau aggregates and disintegrating them. The intermediate aggregates formed are non-toxic to neuronal cells. On the other hand, when matured Tau fibrils are treated with EGCG, they are disaggregated and cleared.

References

    1. Lansbury PT, Lashuel HA. A century-old debate on protein aggregation and neurodegeneration enters the clinic. Nature. 2006;443:774. - PubMed
    1. Selkoe DJ. Folding proteins in fatal ways. Nature. 2003;426:900. - PubMed
    1. Selkoe D, Mandelkow E, Holtzman D. Deciphering alzheimer disease. Cold Spring Harbor Perspect. Med. 2012;2:a011460. - PMC - PubMed
    1. Chiti F, Dobson CM. Protein misfolding, functional amyloid, and human disease. Annu. Rev. Biochem. 2006;75:333–366. - PubMed
    1. Goedert M. Tau protein and the neurofibrillary pathology of Alzheimer's disease. Ann. N. Y. Acad. Sci. 1996;777:121–131. - PubMed

Publication types

MeSH terms