. 2020 Jul 28;10(1):12641.
doi: 10.1038/s41598-020-69616-5.

PD-L1 expression in bone marrow plasma cells as a biomarker to predict multiple myeloma prognosis: developing a nomogram-based prognostic model

Affiliations

PD-L1 expression in bone marrow plasma cells as a biomarker to predict multiple myeloma prognosis: developing a nomogram-based prognostic model

Byung-Hyun Lee et al. Sci Rep. .

Abstract

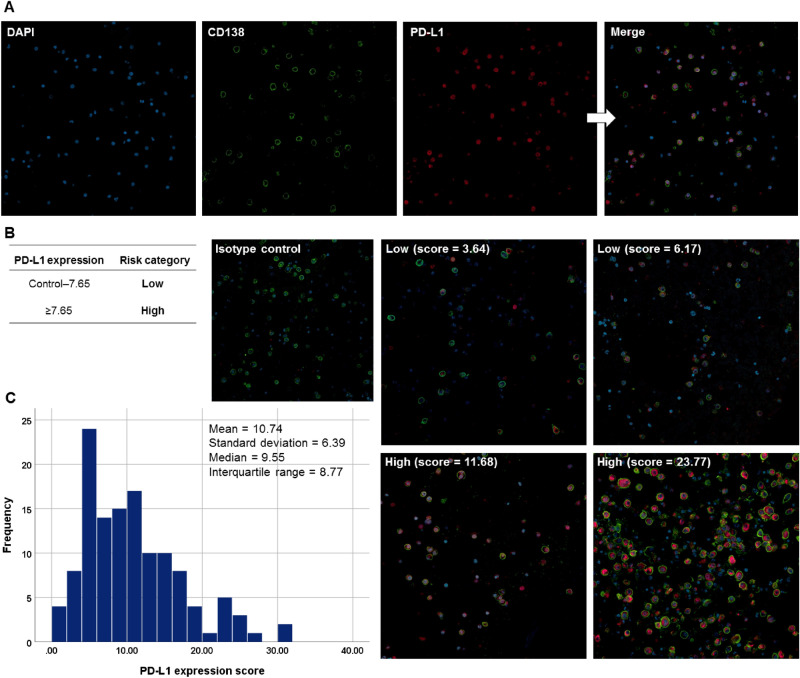
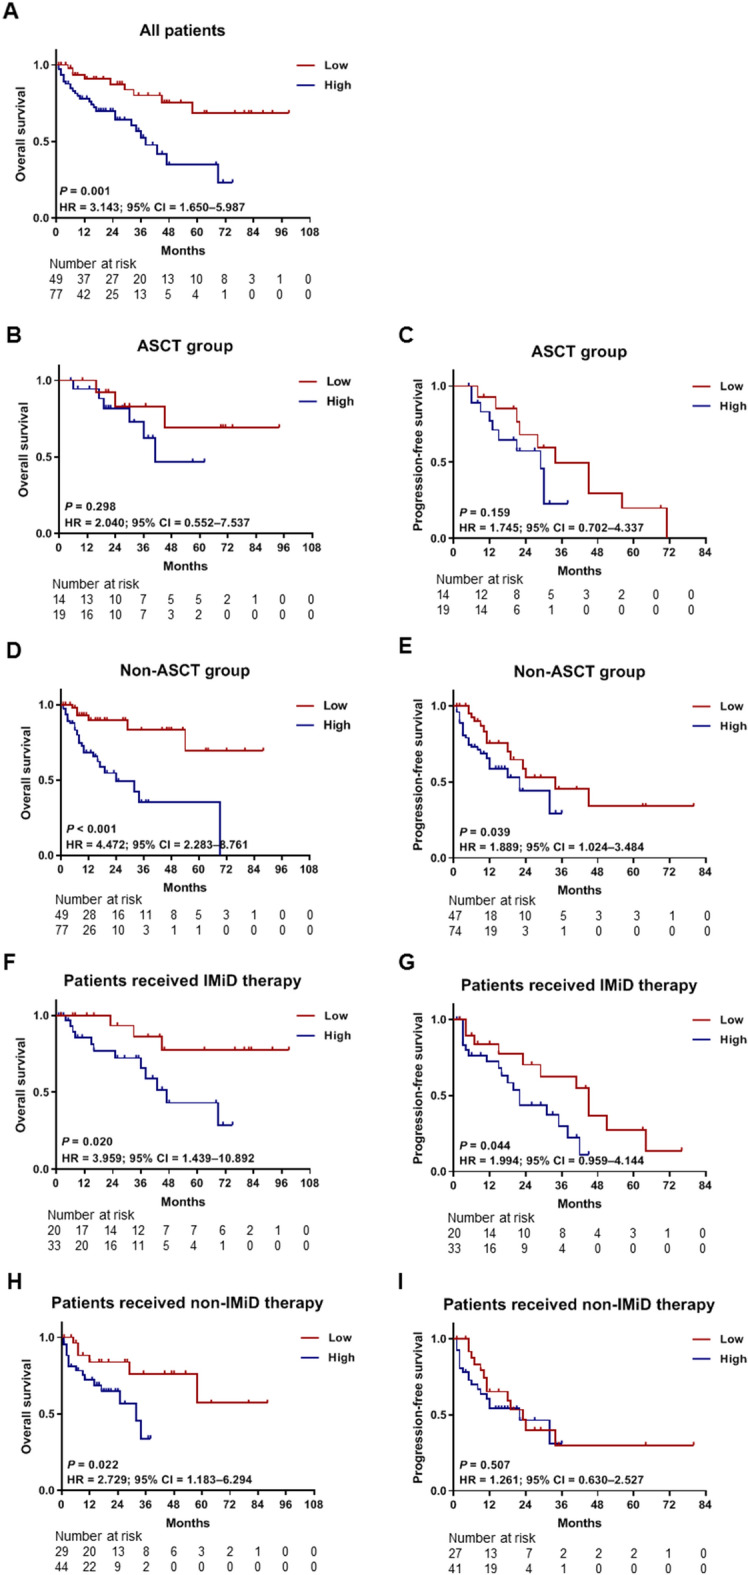
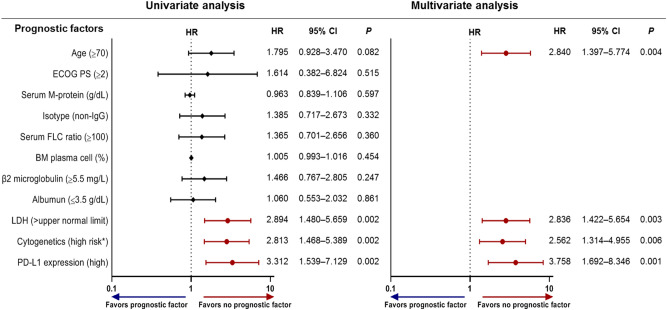
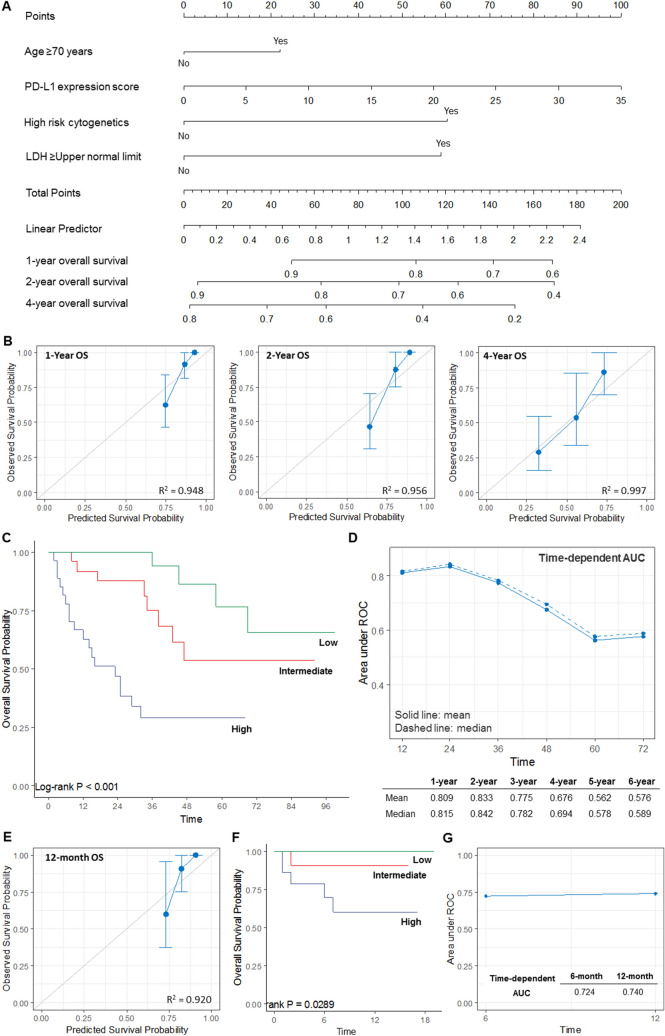
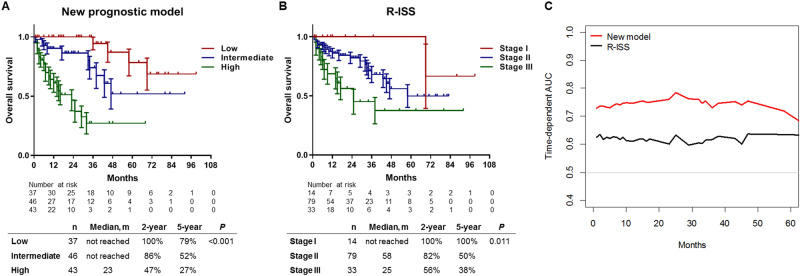
PD-L1 expression is associated with poor prognosis, although this relationship is unclear in bone marrow-derived haematologic malignancies, including multiple myeloma. We aimed to determine whether PD-L1 expression could predict the prognosis of newly diagnosed multiple myeloma (NDMM). We evaluated 126 NDMM patients (83, retrospectively; 43, prospectively) who underwent bone marrow examinations. Bone marrow aspirates were analysed for PD-L1 expression, categorized as low or high expression, using quantitative immunofluorescence. High PD-L1 expression could independently predict poor overall survival (OS) (95% CI = 1.692-8.346) in multivariate analysis. On subgroup analysis, high PD-L1 expression was associated with poor OS (95% CI = 2.283-8.761) and progression-free survival (95% CI = 1.024-3.484) in patients who did not undergo autologous stem cell transplantation (ASCT) compared with those who did. High PD-L1 expression was associated with poor OS despite frontline treatments with or without immunomodulators. Thus, PD-L1 expression can be a useful prognosis predictor in NDMM patients, whereas ASCT may be used in patients with high PD-L1 expression. We developed a prognostic nomogram and found that a combination of PD-L1 expression in bone marrow plasma cells and clinical parameters (age, cytogenetics, and lactate dehydrogenase) effectively predicted NDMM prognosis. We believe that our nomogram can help identify high-risk patients and select appropriate treatments.


Conflict of interest statement

The authors declare no competing interests.

Figures

Figure 1
Figure 1
Immunofluorescence analysis of PD-L1 expression in bone marrow-aspirated plasma cells from patients with multiple myeloma. (A) Formalin-fixed, paraffin-embedded bone marrow aspirate specimens (clot section) from myeloma patients were sectioned at 4–5 µm. The sections were then incubated with antibodies to CD138 (1:100) and PD-L1 (1:100) overnight at 4 °C, followed by incubation with the appropriate secondary antibodies (Alexa Fluor 488, 1:200 and Alexa Fluor 647, 1:200) at room temperature for one hour. Nuclei were counterstained using DAPI, and all images were captured using a confocal laser scanning microscope (CLSM 800, Carl Zeiss Microscopy GmbH). Original magnification × 200. (B) Representative immunofluorescence images for the PD-L1 expression scores and groups based on the predetermined cut-off value of 7.65. (C) The distribution of the PD-L1 expression scores in patients with multiple myeloma. PD-L1 programmed death-ligand 1.
Figure 2
Figure 2
Correlation between PD-L1 expression and a percentage of bone marrow (A) plasma cells, (B) lymphocytes, and (C) monocytes in patients with multiple myeloma.
Figure 3
Figure 3
Kaplan–Meier survival curves for OS and PFS according to PD-L1 expression. PD-L1 expression values were classified as high expression (≥ 7.65) or low expression (< 7.65). (A) The OS curves for all patients (n = 126). The OS (B) and PFS (C) curves for the ASCT group (n = 33) are shown. The OS (D) and PFS (E) curves for the non-ASCT group (n = 126), including 93 patients who did not receive ASCT and 33 patients censored at the time of ASCT. Besides, the OS (F) and PFS (G) curves for the subgroups of patients (n = 53) who received frontline VTD, TD, or RD therapy that included IMiD are shown in this figure. The OS (H) and PFS (I) curves are for the subgroups of patients who did not receive IMiD therapy (n = 73). ASCT autologous stem cell transplantation, IMiD immunomodulatory drug, OS overall survival, PFS progression-free survival, RD lenalidomide-dexamethasone, TD thalidomide-dexamethasone, VMP bortezomib-melphalan-prednisolone, VTD bortezomib-thalidomide-dexamethasone.
Figure 4
Figure 4
Univariate and multivariate Cox regression analyses for OS. If the hazard ratio is greater than 1, then the predictor is associated with an increased risk of death. OS overall survival, BM bone marrow, ECOG Eastern Cooperative Oncology Group, LDH lactate dehydrogenase, PS performance status. * High-risk cytogenetics were defined by the presence of at least one of the following: t(4;14), t(14;16), del(17/17p), TP53 deletion, and chromosome 1 abnormalities including gain(1q) and del(1p).
Figure 5
Figure 5
Development of the prognostic nomogram. (A) A nomogram for estimating OS in the training (retrospective) cohort. (B) Calibration curves for predicting 1-year, 2-year, and 4-year OS were created by plotting the observed survival probabilities (y-axis) against the nomogram-predicted probabilities (x-axis). The vertical bars indicate the 95% CIs, which were calculated by bootstrapping with 1,000 resamples. The 45-degree line indicates an ideal model. (C) The Kaplan–Meier OS curves in the three risk groups according to the tertiles of the nomogram’s total score. (D) Time-dependent AUC analyses with 1,000 bootstrap replicates for evaluating the performance and prediction accuracy of the nomogram in the training cohort. (E) Calibration curves for 12-month OS in the validation (prospective) cohort, which were created by plotting the observed survival probabilities (y-axis) against the nomogram-predicted probabilities (x-axis). The 45-degree line indicates an ideal model. (F) The Kaplan–Meier OS curves in the validation cohort according to the nomogram. (G) The time-dependent AUC analyses in the validation cohort. AUC area under the curve, OS overall survival, CI confidence interval, PFS progression-free survival.
Figure 6
Figure 6
Comparison of the new prognostic model and the R-ISS. (A) The Kaplan–Meier OS curves with SE based on the new prediction model and (B) the R-ISS. (C) The time-dependent ROC curves and AUC analyses for OS. AUC area under the curve, OS overall survival, R-ISS Revised International Staging System, ROC receiver operating characteristic, SE standard error.

References

    1. Rosenblatt J, Avigan D. Targeting the PD-1/PD-L1 axis in multiple myeloma: a dream or a reality? Blood. 2017;129:275–279. doi: 10.1182/blood-2016-08-731885. - DOI - PubMed
    1. Tremblay-LeMay R, Rastgoo N, Chang H. Modulating PD-L1 expression in multiple myeloma: an alternative strategy to target the PD-1/PD-L1 pathway. J. Hematol. Oncol. 2018;11:46. doi: 10.1186/s13045-018-0589-1. - DOI - PMC - PubMed
    1. Tamura H, et al. Marrow stromal cells induce B7–H1 expression on myeloma cells, generating aggressive characteristics in multiple myeloma. Leukemia. 2013;27:464–472. doi: 10.1038/leu.2012.213. - DOI - PubMed
    1. Greaves P, Gribben JG. The role of B7 family molecules in hematologic malignancy. Blood. 2013;121:734–744. doi: 10.1182/blood-2012-10-385591. - DOI - PMC - PubMed
    1. Khunger M, et al. Programmed cell death 1 (PD-1) ligand (PD-L1) expression in solid tumors as a predictive biomarker of benefit from PD-1/PD-L1 axis inhibitors: a systematic review and meta-analysis. JCO Precis. Oncol. 2017;1:1–15. - PubMed

Publication types

MeSH terms