. 2020 Jul 9;10(18):8143-8161.
doi: 10.7150/thno.45903. eCollection 2020.

Perfusion-guided sonopermeation of neuroblastoma: a novel strategy for monitoring and predicting liposomal doxorubicin uptake in vivo

Affiliations

Perfusion-guided sonopermeation of neuroblastoma: a novel strategy for monitoring and predicting liposomal doxorubicin uptake in vivo

Aditi Bellary et al. Theranostics. .

Abstract

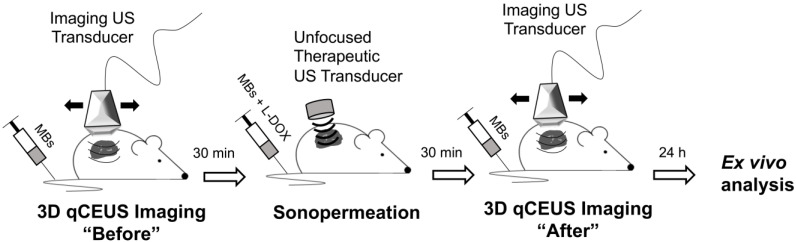
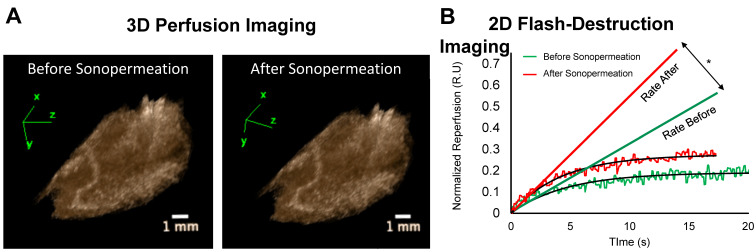
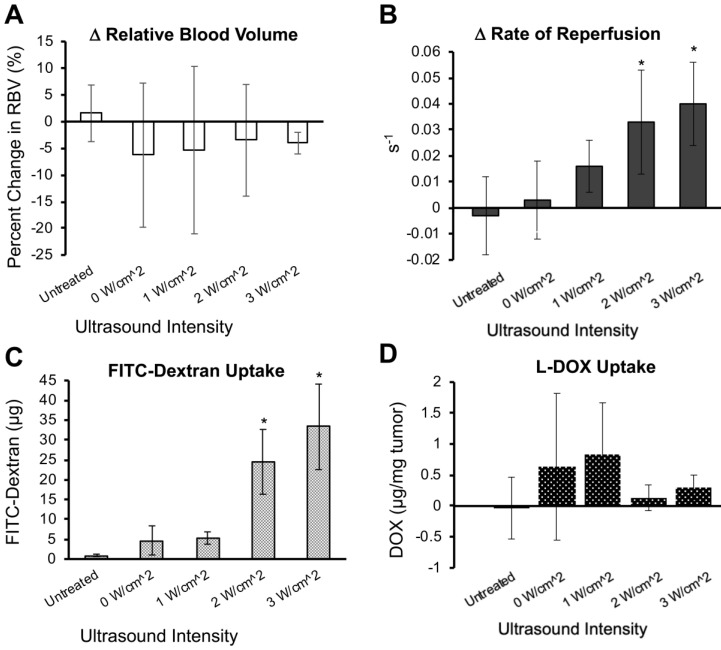
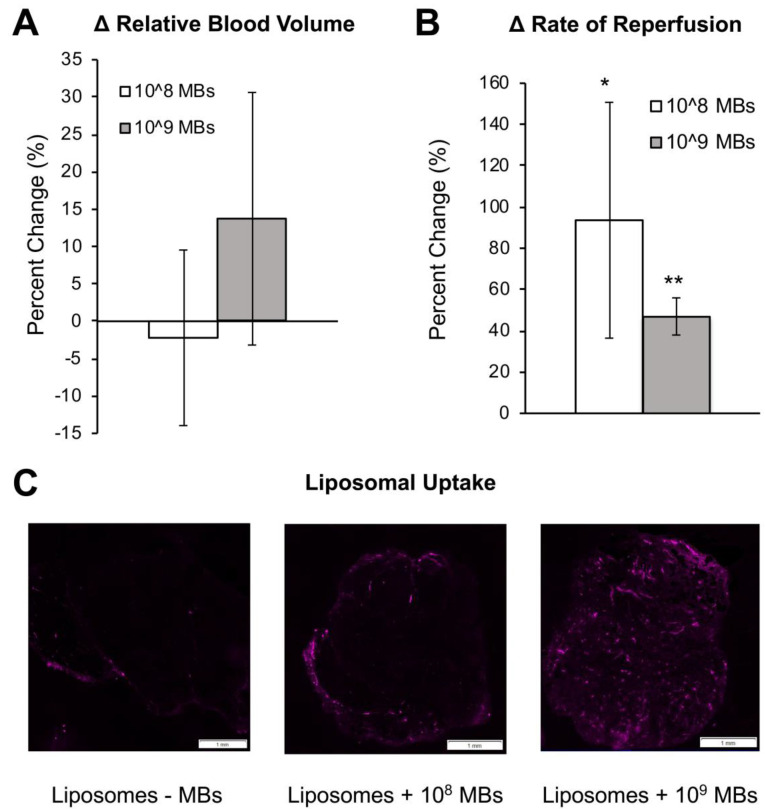
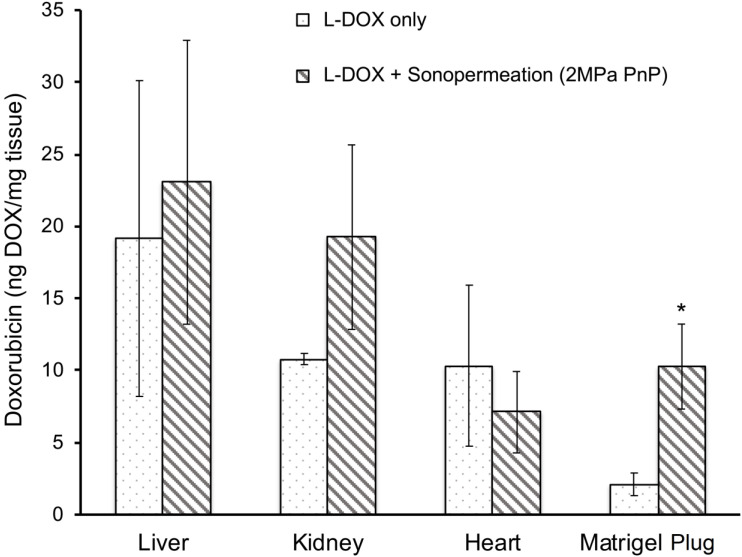
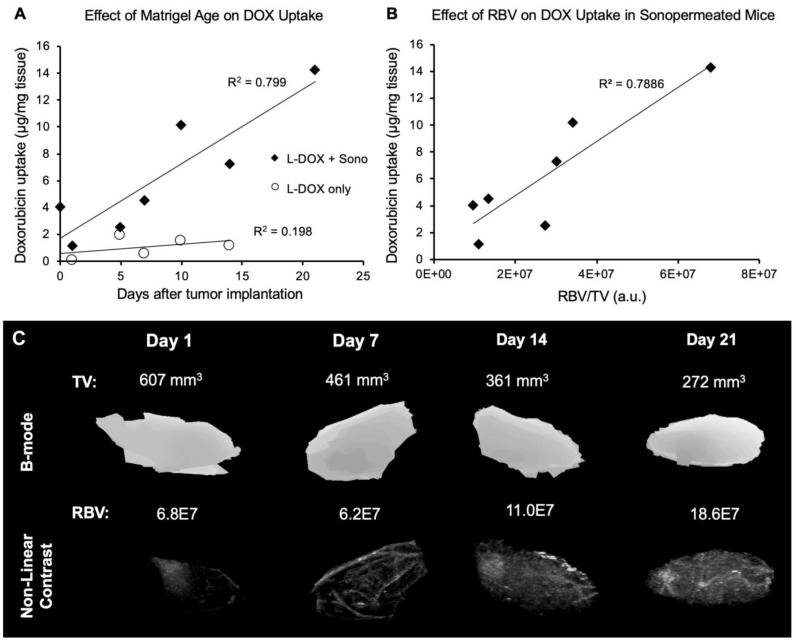
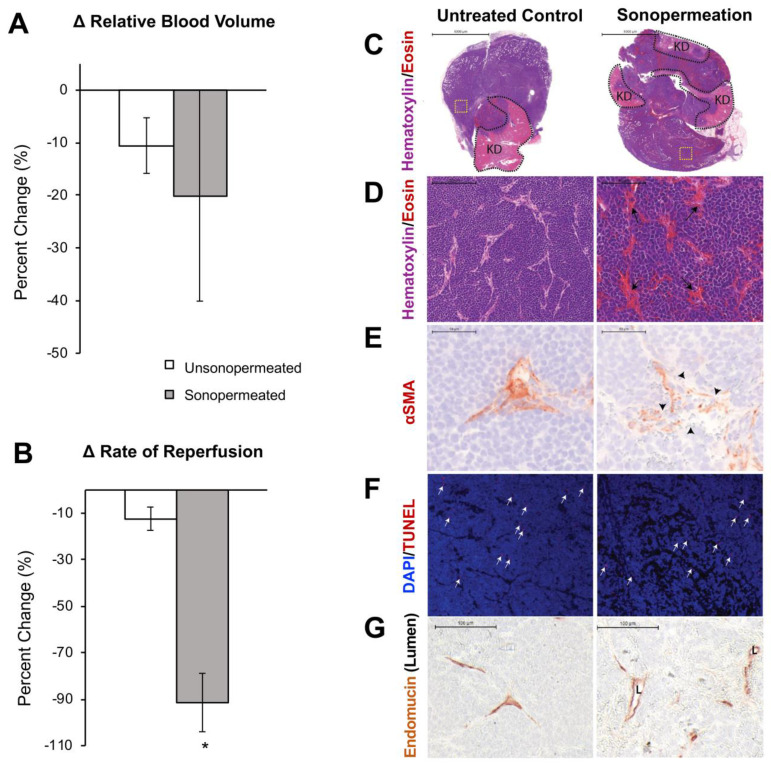
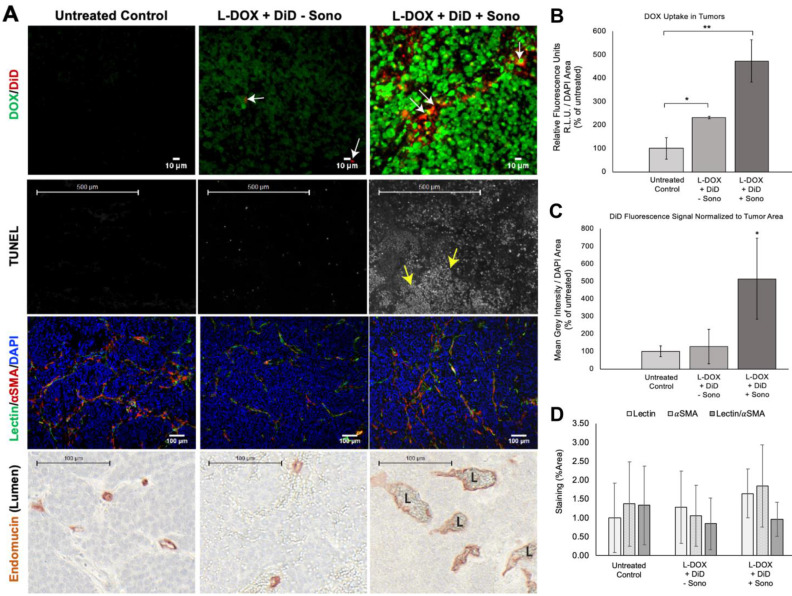
Neuroblastoma (NB) is the most common extracranial solid tumor in infants and children, and imposes significant morbidity and mortality in this population. The aggressive chemoradiotherapy required to treat high-risk NB results in survival of less than 50%, yet is associated with significant long-term adverse effects in survivors. Boosting efficacy and reducing morbidity are therefore key goals of treatment for affected children. We hypothesize that these may be achieved by developing strategies that both focus and limit toxic therapies to the region of the tumor. One such strategy is the use of targeted image-guided drug delivery (IGDD), which is growing in popularity in personalized therapy to simultaneously improve on-target drug deposition and assess drug pharmacodynamics in individual patients. IGDD strategies can utilize a variety of imaging modalities and methods of actively targeting pharmaceutical drugs, however in vivo imaging in combination with focused ultrasound is one of the most promising approaches already being deployed for clinical applications. Over the last two decades, IGDD using focused ultrasound with "microbubble" ultrasound contrast agents (UCAs) has been increasingly explored as a method of targeting a wide variety of diseases, including cancer. This technique, known as sonopermeation, mechanically augments vascular permeability, enabling increased penetration of drugs into target tissue. However, to date, methods of monitoring the vascular bioeffects of sonopermeation in vivo are lacking. UCAs are excellent vascular probes in contrast-enhanced ultrasound (CEUS) imaging, and are thus uniquely suited for monitoring the effects of sonopermeation in tumors. Methods: To monitor the therapeutic efficacy of sonopermeation in vivo, we developed a novel system using 2D and 3D quantitative contrast-enhanced ultrasound imaging (qCEUS). 3D tumor volume and contrast enhancement was used to evaluate changes in blood volume during sonopermeation. 2D qCEUS-derived time-intensity curves (TICs) were used to assess reperfusion rates following sonopermeation therapy. Intratumoral doxorubicin (and liposome) uptake in NB was evalauted ex vivo along with associated vascular changes. Results: In this study, we demonstrate that combining focused ultrasound therapy with UCAs can significantly enhance chemotherapeutic payload to NB in an orthotopic xenograft model, by improving delivery and tumoral uptake of long-circulating liposomal doxorubicin (L-DOX) nanoparticles. qCEUS imaging suggests that changes in flow rates are highly sensitive to sonopermeation and could be used to monitor the efficacy of treatment in vivo. Additionally, initial tumor perfusion may be a good predictor of drug uptake during sonopermeation. Following sonopermeation treatment, vascular biomarkers show increased permeability due to reduced pericyte coverage and rapid onset of doxorubicin-induced apoptosis of NB cells but without damage to blood vessels. Conclusion: Our results suggest that significant L-DOX uptake can occur by increasing tumor vascular permeability with microbubble sonopermeation without otherwise damaging the vasculature, as confirmed by in vivo qCEUS imaging and ex vivo analysis. The use of qCEUS imaging to monitor sonopermeation efficiency and predict drug uptake could potentially provide real-time feedback to clinicians for determining treatment efficacy in tumors, leading to better and more efficient personalized therapies. Finally, we demonstrate how the IGDD strategy outlined in this study could be implemented in human patients using a single case study.

Keywords: Sonoporation; image-guided drug delivery.; neuroblastoma; quantitative contrast-enhanced ultrasound (qCEUS); sonopermeabilization; sonopermeation.


Conflict of interest statement

Competing Interests: The authors have declared that no competing interest exists.

Figures

Figure 1
Figure 1
Cartoon depiction of workflow for unfocused ultrasound experiments. Mice bearing tumor-free Matrigel plugs were imaged (15 MHz) in 2D and 3D prior to sonopermeation to establish a baseline of tumor perfusion using a bolus of 5x10⁷ MBs. Next, microbubbles and drug were systemically introduced via tail vein injection and subcutaneous tumors were sonopermeated with a handheld therapeutic ultrasound transducer (1 MHz) using a high concentration of MBs (1x10⁹ MBs in 500 µL). 30 min post-sonopermeation, tumor-free Matrigel plugs were imaged again to assess changes in the vasculature. Finally, tissue was excised 24 h after sonopermeation and ex vivo analysis was performed to quantify FITC-Dextran uptake.
Figure 2
Figure 2
Perfusion-guided sonopermeation of neuroblastoma tumor models using qCEUS imaging techniques to monitor vascular changes. (A) A rotating syringe pump was used to administer constant infusions over long periods of time during sonopermeation experiments. (B) Screen captures from the clinical ultrasound scanner illustrate non-linear 2D imaging of a neuroblastoma tumor sonopermeated using 1x10⁹ MBs. The selection of appropriate ROIs encompassing the sonopermeated focal zone (solid white line) and a designated control region (dashed white line) at the periphery of the tumor has been indicated. The series of ultrasound images show contrast enhancement before sonopermeation, followed by focused ultrasound triggered microbubble destruction in vivo during four sonopermeation treatment cycles, culminating in MB recovery within the tumor space post-sonopermeation; the accompanying time-intensity curves (TICs) - corresponding to the “treated” and “untreated” ROIs - have been split into three matching stages. (C) MB reperfusion after the initial (FD-1 = 300 s) and final (FD-2 = 630 s) flash-destruction pulses were fitted to an exponential model and the resultant curves were compared to assess sonopermeation-mediated changes in perfusion kinetics.
Figure 3
Figure 3
(A) Examples of 3D reconstructions of Matrigel plugs generated from interpolating a series 2D non-linear contrast images taken pre- and post-unfocused sonopermeation reveal no overall changes in relative blood volume or level of perfusion. (B) Examples of 2D flash-destruction imaging performed before (green) and after (red) unfocused sonopermeation show an increase (p<0.05) in the rate of microbubble reperfusion in Matrigel plug models. * Indicates statistical significance in the difference between pre- and post-sonopermeation rates as compared to untreated Matrigel plugs.
Figure 4
Figure 4
Effect of unfocused sonopermeation on tumor perfusion and drug uptake. Mice assigned to the untreated group received neither microbubbles nor FITC-Dextran/DOX nor ultrasound, whereas the 0 W/cm2 group received microbubbles co-injected with FITC-Dextran/DOX without ultrasound. (A) Percent change in the relative blood volume before and 30 min post-sonopermeation from 3D qCEUS. (B) Change in reperfusion rates before and after sonopermeation. (C) Small molecule (2 kDa) FITC-Dextran uptake in Matrigel plugs 24 h post-sonopermeation. (D) Doxorubicin uptake delivered using liposomal L-DOX 24 h post-sonopermeation. Ultrasound intensities from 0-3 W/cm2 correspond to 0-0.6 MPa PnP. N = 4-5 mice per group. * Indicates p<0.05 compared to the untreated group.
Figure 5
Figure 5
Evaluation of focused ultrasound treatment on qCEUS parameters and DiD Liposome uptake in Matrigel plugs. (A) Changes in RBV from baseline (before sonopermeation) using two different concentrations of MBs co-injected with DiD labeled liposomes. (B) Change in reperfusion rate after sonopermeation using the same tumors. Values were calculated by selecting an ROI in the sonopermeated focal zone and normalizing against non-sonopermeated control ROIs outside of the tumor area, as described in Figure 2. A paired Student's T-test was performed with N = 3 mice per group. * Indicates p<0.05 and ** indicates p<0.01 and reflect that these groups are significantly different than the baseline value. (C) Effect of MB concentration on nanoparticle accumulation. Sections of sonopermeated and non-sonopermeated Matrigel plugs were visualized on a whole slide scanner (Olympus VS120 Virtual Slide Microscope).
Figure 6
Figure 6
Focused ultrasound increases drug uptake in Matrigel plugs. A 5-fold increase in L-DOX accumulation was achieved in Matrigel plugs sonopermeated with a high dosage of microbubbles (109 MBs in 500 µL) as compared to their non-sonopermeated counterparts, accompanied by no statistically significant difference in other organs, suggesting that sonopermeation drove more L-DOX selectively into the tumor without simultaneously increasing uptake in the heart, all without increasing the dosage of administration. N = 5 mice per group. * Indicates p<0.05.
Figure 7
Figure 7
Effect of Matrigel age and perfusion on doxorubicin uptake. (A) Sonopermeation efficiency increases with Matrigel plug maturity (black diamonds). No effect of Matrigel age on doxorubicin uptake is observed without sonopermeation (white circles). (B) Normalized relative blood volume (RBV) measurements from qCEUS imaging of Matrigel plugs show a similar increasing trend in doxorubicin uptake with increased perfusion. (C) Examples of 3D qCEUS measurements of tumor volume (TV) and perfusion (RBV) from four sonopermeated Matrigel plugs. Matrigel plugs are reabsorbed over time causing a decrease in TV while RBV increases, thus enhancing the effectiveness of sonopermeation.
Figure 8
Figure 8
Effect of sonopermeation alone (no L-DOX) on qCEUS parameters and NGP tumoral vasculature 30 min post-treatment. (A) Change in RBV after sonopermeation within the sonopermeated tumor compared to unsonopermeated control region outside the tumor (see Figure 2 for ROI selection). (B) Change in RR after sonopermeation using the same ROIs. (C-G) Ex vivo analysis of NGP tumors harvested 30 min after sonopermeation alone (right column) or following no treatment (Untreated Control, left column). (C) Hematoxylin (blue) and eosin (pink-red) (top and middle rows) with remaining kidney (KD, light pink) highlighted by the dotted black line (top row) revealed no change in cell death as a result of sonopermeation (homogeneous blue staining). (D) 20x magnification (middle row) of an area away from normal kidney (yellow dotted square in top row) shows increased blood vessel diameter (black arrows) in the treated tumors compared to untreated controls. (E) Sonopermeation led to discontinuous pericyte coverage (black arrowheads) illustrated by interrupted alpha-smooth muscle actin immunostain (αSMA, third row). (F) TUNEL staining (red, white arrows) was used to detect cell death, which was minimally observed in untreated or sonopermeation alone mice. (G) Sonopermeation alone increases blood vessel dilation. Lumens (“L”) were measured using Pannoramic Viewer; the longest distance between Endomucin immunostained cells was measured, and over 100 measurements of randomized locations per tissue were analyzed (see Supplementary Figure 5). N = 3 mice per group.
Figure 9
Figure 9
Evaluating drug uptake and vasculature changes in NGP tumors 24 h after sonopermeation. (A) Ex vivo evaluation of NGP tumors using histology and immunostaining to evaluate levels of doxorubicin and liposomal DiD uptake, cell death (TUNEL), lectin, αSMA, and Endomucin (lumen). Untreated tumors (left column) were compared with tumors given L-DOX and DiD liposomes only (no sonopermeation, middle column), and sonopermeated tumors (right column). Low magnification of the apoptosis marker TUNEL reveals that sonopermeation with L-DOX led to large clusters of apoptotic tumor cells at 24 h (second row, white dots, yellow arrows) although no observable changes in blood vessel (lectin) or pericyte coverage (αSMA) were observed (third row). Sonopermeation caused enlargement of vascular lumens (marked L) in the presence of L-DOX: lumens were measured using Pannoramic Viewer, the longest distance separating Endomucin immunostained cells was measured, and over 100 measurements of randomized locations per tissue were analyzed (see Supplementary Figure 5). (B) Quantification of doxorubicin in NGP tumors calculated by average fluorescent intensity within the tumors. Image intensities are ~2 and 5-fold higher for L-DOX/DiD only and sonopermeated tumors with L-DOX/DiD respectively. Untreated controls show a small level of background signal due to tissue autofluorescence. (C) Comparison of liposome uptake in NGP tumors using average DiD fluorescent intensity. Infusion of L-DOX without sonopermeation did not alter DiD uptake in tumors compared to the untreated controls. Sonopermeation increased DiD presence in the tumors approximately 5-fold. (D) Quantification from low magnification (10x) images reveals no significant changes in endothelial marker lectin or pericyte marker αSMA. N = 3 mice per group. * Indicates p<0.05 and ** indicates p<0.01.
Figure 10
Figure 10
Sonopermeation in a clinical setting. The above images constitute an example of how image-guided sonopermeation can be accomplished in patients using a single continuous infusion of ultrasound contrast agents. (A) Summary of methodology for performing imaging and flash-destruction cycles followed by full destruction of contrast agents. (B) Representative images of contrast agent infusion, contrast agent destruction, and reflow in hepatocellular carcinoma (outlined in white). (C) Mean pixel intensities immediately following the first (green) and last (red) flash destruction pulse.

References

    1. Verissimo CS, Molenaar JJ, Fitzsimons CP, Vreugdenhil E. Neuroblastoma therapy: what is in the pipeline? Endocr Relat Cancer. 2011;18:R213–31. - PubMed
    1. Deyell RJ, Attiyeh EF. Advances in the understanding of constitutional and somatic genomic alterations in neuroblastoma. Cancer Genet. 2011;204:113–21. - PubMed
    1. Ladenstein R, Pötschger U, Valteau-Couanet D. et al. Interleukin 2 with anti-GD2 antibody ch14.18/CHO (dinutuximab beta) in patients with high-risk neuroblastoma (HR-NBL1/SIOPEN): a multicentre, randomised, phase 3 trial. Lancet Oncol. 2018;19:1617–29. - PubMed
    1. Yu AL, Gilman AL, Ozkaynak MF. et al. Anti-GD2 Antibody with GM-CSF, Interleukin-2, and Isotretinoin for Neuroblastoma. N Engl J Med. 2010;363:1324–34. - PMC - PubMed
    1. Park JR, Bagatell R, London WB. et al. Children's Oncology Group's 2013 blueprint for research: Neuroblastoma. Pediatr Blood Cancer. 2013;60:985–93. - PubMed

Publication types

MeSH terms