. 2020 Jul 9;10(18):8400-8414.
doi: 10.7150/thno.45124. eCollection 2020.

Endoplasmic Reticulum stress-dependent expression of ERO1L promotes aerobic glycolysis in Pancreatic Cancer

Affiliations

Endoplasmic Reticulum stress-dependent expression of ERO1L promotes aerobic glycolysis in Pancreatic Cancer

Junfeng Zhang et al. Theranostics. .

Abstract

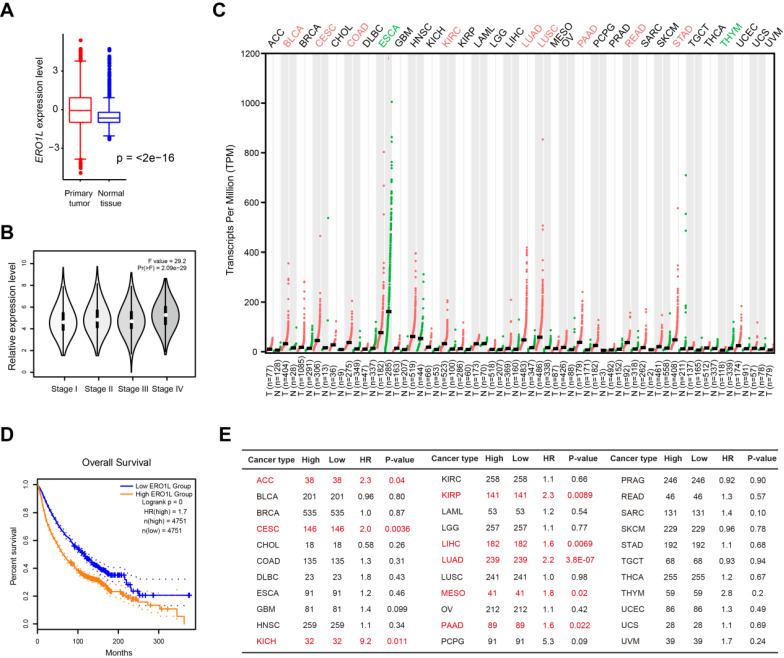
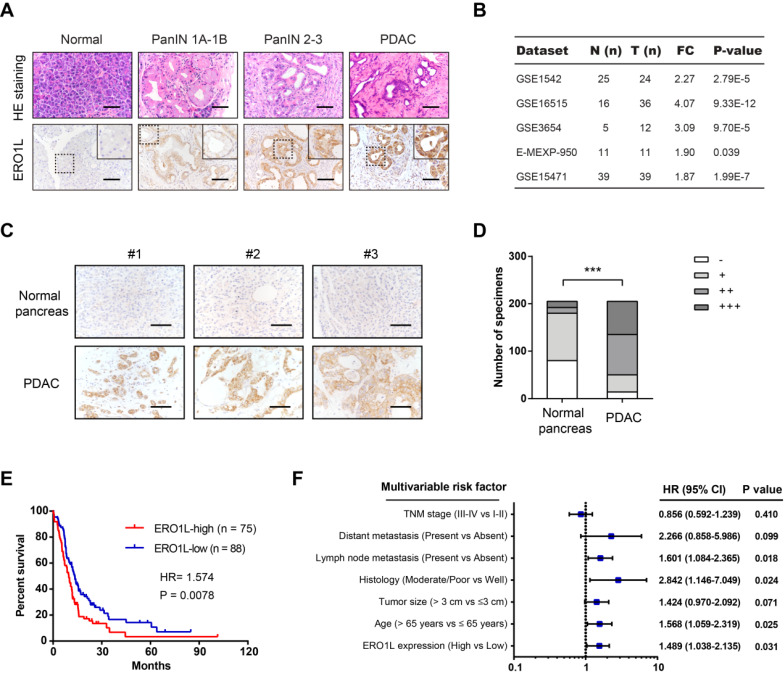
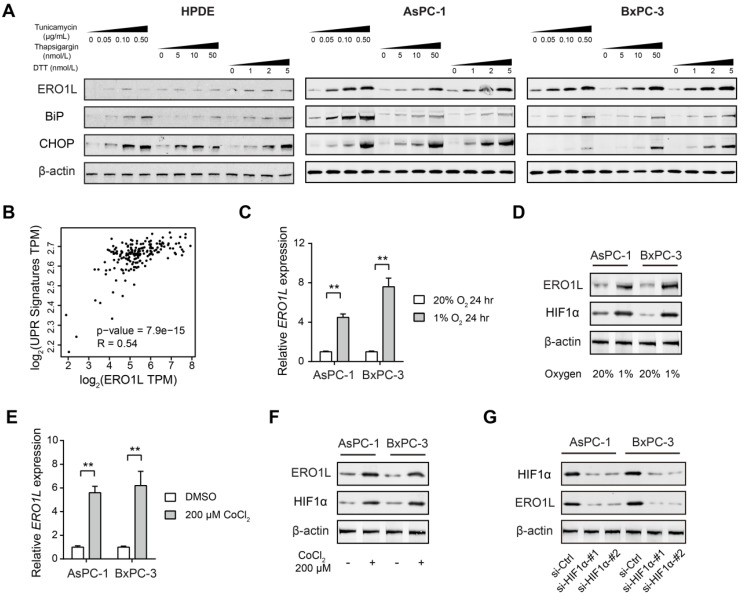
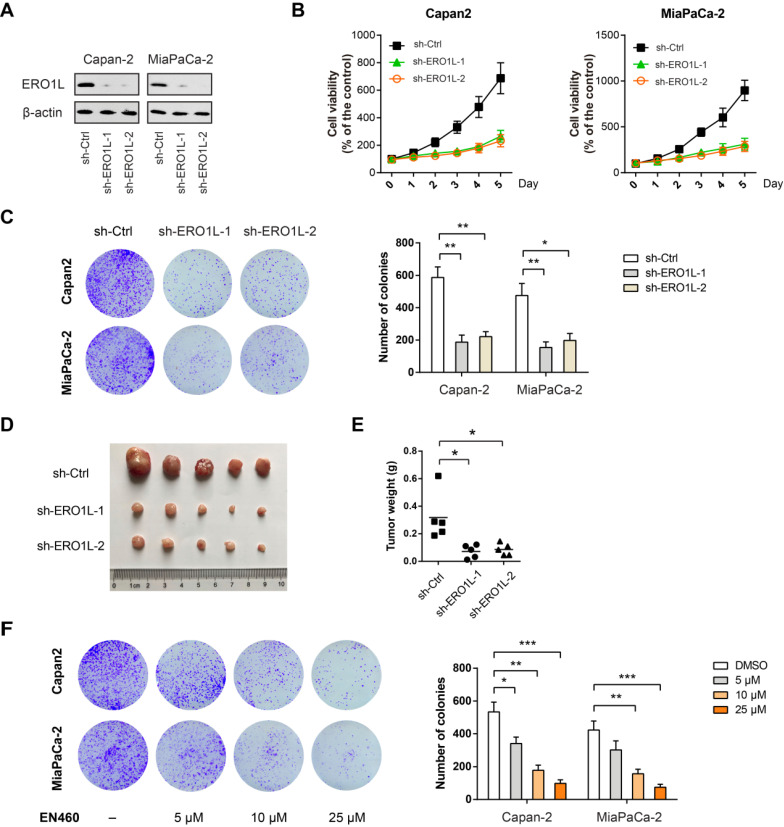
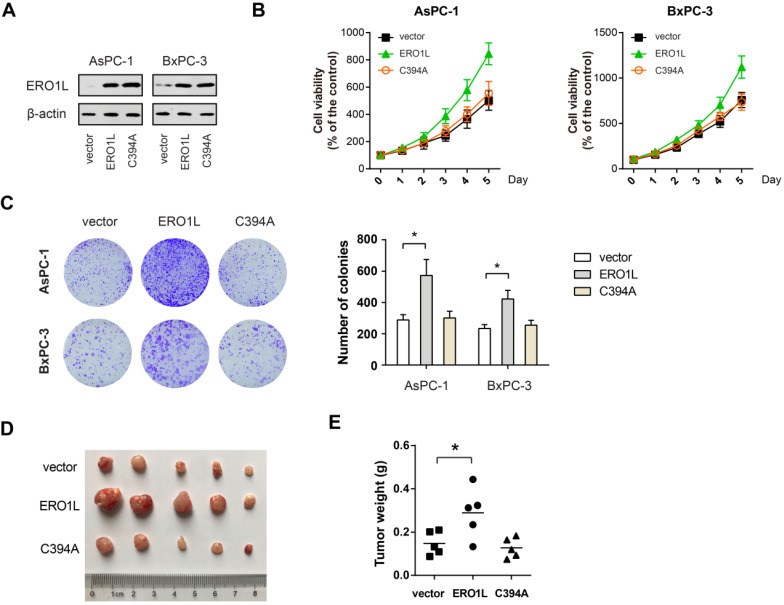
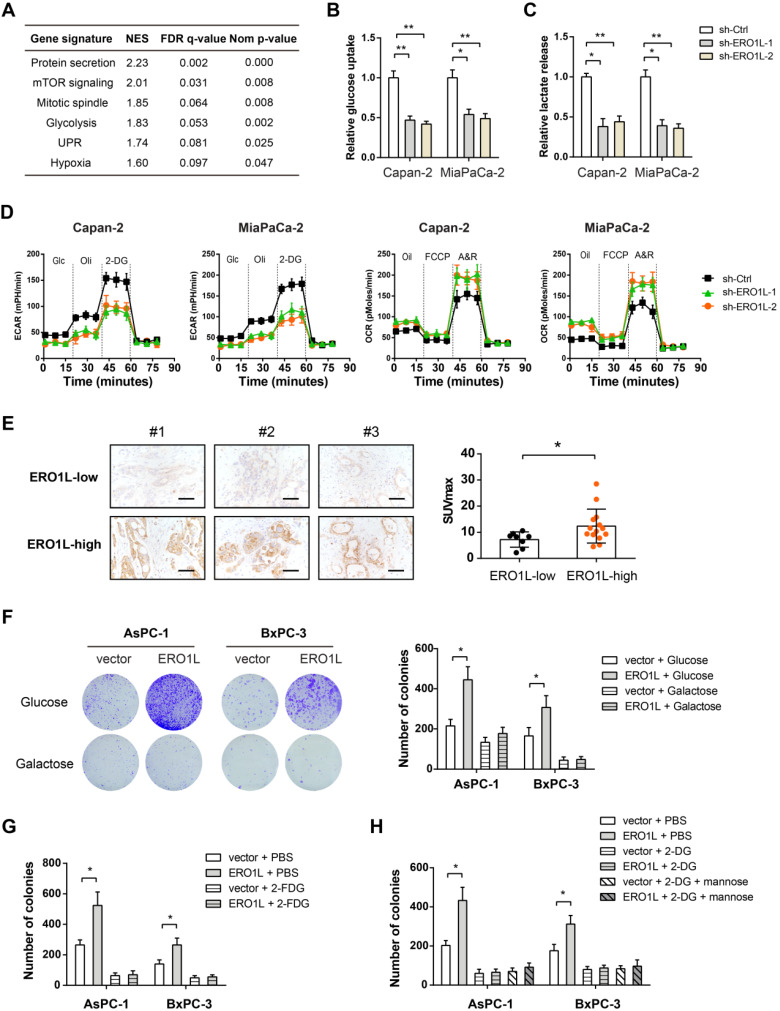
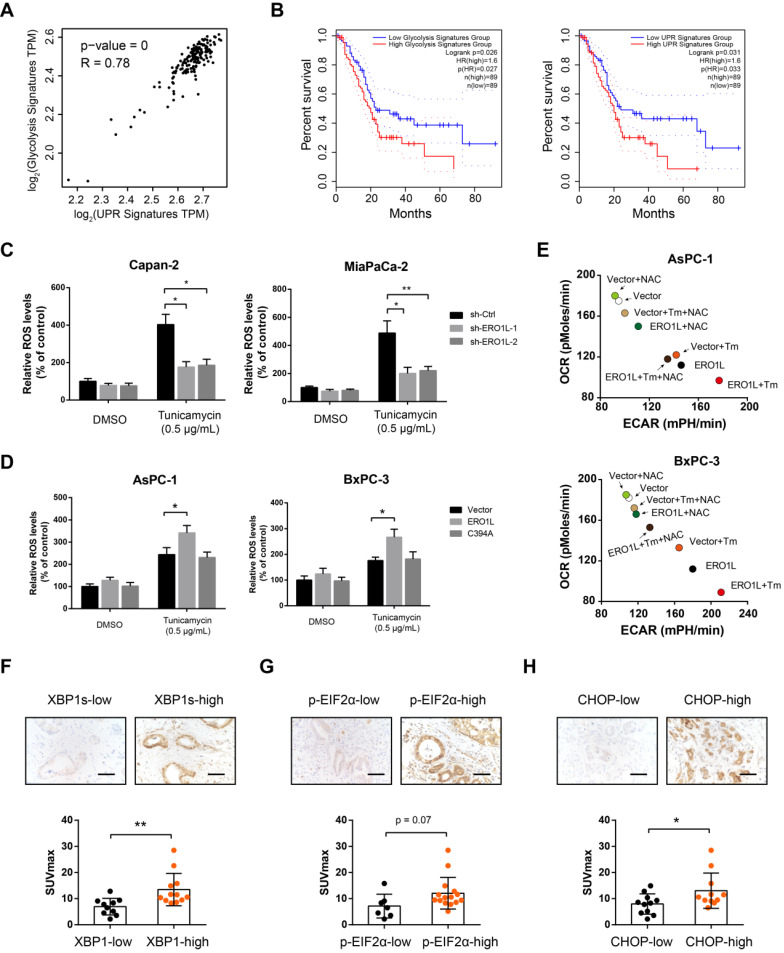
Rationale: Endoplasmic reticulum oxidoreductase 1 alpha (ERO1L) is an endoplasmic reticulum (ER) luminal glycoprotein that has a role in the formation of disulfide bonds of secreted proteins and membrane proteins. Emerging data identify ERO1L as a tumor promoter in a wide spectrum of human malignancies. However, its molecular basis of oncogenic activities remains largely unknown. Methods: Pan-cancer analysis was performed to determine the expression profile and prognostic value of ERO1L in human cancers. The mechanism by which ERO1L promotes tumor growth and glycolysis in pancreatic ductal adenocarcinoma (PDAC) was investigated by cell biological, molecular, and biochemical approaches. Results: ERO1L was highly expressed in PDAC and its precursor pancreatic intraepithelial neoplasia and acts as an independent prognostic factor for patient survival. Hypoxia and ER stress contributed to the overexpression pattern of ERO1L in PDAC. ERO1L knockdown or pharmacological inhibition with EN460 suppressed PDAC cell proliferation in vitro and slowed tumor growth in vivo. Ectopic expression of wild type ERO1L but not its inactive mutant form EROL-C394A promoted tumor growth. Bioinformatics analyses and functional analyses confirmed a regulatory role of ERO1L on the Warburg effect. Notably, inhibition of tumor glycolysis partially abrogated the growth-promoting activity of ERO1L. Mechanistically, ERO1L-mediated ROS generation was essential for its oncogenic activities. In clinical samples, ERO1L expression was correlated with the maximum standard uptake value (SUVmax) in PDAC patients who received 18F-FDG PET/CT imaging preoperatively. Analysis of TCGA cohort revealed a specific glycolysis gene expression signature that is highly correlated with unfolded protein response-related gene signature. Conclusion: Our findings uncover a key function for ERO1L in Warburg metabolism and indicate that targeting this pathway may offer alternative therapeutic strategies for PDAC.

Keywords: Aerobic glycolysis; ERO1A; ERO1α; HIF1α; Pancreatic cancer.


Conflict of interest statement

Competing Interests: The authors have declared that no competing interest exists.

Figures

Figure 1
Figure 1
Pan-cancer perspective of ERO1L gene expression profile and prognostic potential. (A) Comparison of ERO1L expression level in 9664 tumor tissue samples and 5539 normal cases. Data were derived from TCGA cohort and GTEx. (B) Comparison of ERO1L expression level in tumor tissue samples with different TNM stage. (C) The expression level of ERO1L in different tumor tissues and their normal counterparts. (D) Kaplan-Meier graphs showing significant association of ERO1L expression with patients' survival. (E) Prognostic analysis of ERO1L in different human cancers. The median expression value of ERO1L was used as a cutoff. HR: hazard ratio. ACC, Adrenocortical carcinoma; BLCA, Bladder urothelial carcinoma; BRCA, Breast invasive carcinoma; CESC, Cervical squamous cell carcinoma and endocervical adenocarcinoma; CHOL, Cholangio carcinoma; COAD, Colon adenocarcinoma; DLBC, Lymphoid neoplasm diffuse large B-cell lymphoma; ESCA, Esophageal carcinoma; GBM, Glioblastoma multiforme; HNSC, Head and neck squamous cell carcinoma; KICH, Kidney chromophobe; KIRC, Kidney renal clear cell carcinoma; KIRP, Kidney renal papillary cell carcinoma; LAML, Acute myeloid leukemia; LGG, Brain lower grade glioma; LIHC, Liver hepatocellular carcinoma; LUAD, Lung adenocarcinoma; LUSC, Lung squamous cell carcinoma; MESO, Mesothelioma; OV, Ovarian serous cystadenocarcinoma; PAAD, Pancreatic adenocarcinoma; PCPG, Pheochromocytoma and paraganglioma; PRAD, Prostate adenocarcinoma; READ, Rectum adenocarcinoma; SARC, Sarcoma; SKCM, Skin cutaneous melanoma; STAD, Stomach adenocarcinoma; TGCT, Testicular germ cell tumors; THCA, Thyroid carcinoma; THYM, Thymoma; UCEC, Uterine corpus endometrial carcinoma; UCS, Uterine carcinosarcoma; UVM, Uveal melanoma.
Figure 2
Figure 2
ERO1L is overexpressed in PDAC and predicts a poor prognosis. (A) Immunohistochemical detection of ERO1L protein expression in normal pancreas from control mice, precursor lesions from Pdx1-Cre; LSL-KrasG12D/+ (KC) mice, and tumor lesions from Pdx1-Cre; LSL-KrasG12D/+; LSL-Trp53R172H/+ (KPC) mice. HE staining was performed to show the representative images of different stages of PanIN lesions; Scale bar: 50 µm. (B) The expression pattern of ERO1L in five independent PDAC cohorts. Data were derived from the GEO database. (C) Representative images of ERO1L protein expression in a tissue microarray containing 205 pathologist-certified and clinically annotated PDAC specimens from Ren Ji cohort; Scale bar: 50 µm. (D) The number of tissue specimens displaying high or low ERO1L staining in paracancerous pancreas and PDAC lesions (Fisher's exact test, **P < 0.01). (E) Kaplan-Meier analysis of the overall survival of PDAC patients based on ERO1L protein expression in Ren Ji cohort (log-rank test, P = 0.0078). (F) Multivariate Cox regression analyses were performed to identify independent prognostic factors for PDAC survival. All the bars correspond to 95% confidence intervals.
Figure 3
Figure 3
ERO1L is induced by ER stress in pancreatic cancer. (A) Western blotting analysis of ERO1L protein level after treatment with vehicle (DMSO) or increasing concentrations of three chemical inducers of ER stress (Tunicamycin, Thapsigargin, and DTT) in HPDE, AsPC1 and BxPC3 cells. (B) Correlation analyses of expression of ERO1L and unfolded protein response (UPR) gene expression signature in TCGA cohort. (C) Detection of ERO1L mRNA level in AsPC1 and BxPC3 cells under hypoxia (1% O2) and normoxia (20% O2) condition (n = 3). (D) Western blotting analysis of ERO1L protein in AsPC1 and BxPC3 cells under hypoxia (1% O2) and normoxia (20% O2) condition. (E) Real-time qPCR analysis of ERO1L expression in AsPC1 and BxPC3 cells after exposure to 100 µM CoCl2 for 24 h. (F) Western blotting analysis of ERO1L protein in AsPC1 and BxPC3 cells after exposure to 100 µM CoCl2 for 24 h. (G) Comparison of ERO1L expression in si-Ctrl and si-HIF1α AsPC1 and BxPC3 cells under hypoxia (1% O2) condition. **P < 0.01.
Figure 4
Figure 4
Genetic silencing or pharmacological inhibition of ERO1L suppresses tumor growth in PDAC. (A) Western blotting analysis of ERO1L knockdown efficiency in Capan-2 and MiaPaCa-2 cells. (B) Cell Counting Kit-8 assay analysis of the effect of ERO1L knockdown on Capan-2 and MiaPaCa-2 cell proliferation (n = 3). (C) The long-term effect of ERO1L knockdown in Capan-2 and MiaPaCa-2 cells was tested by plate colony formation assay (n = 3). (D-E) Capan-2-sh-Ctrl and Capan-2-sh-ERO1L cells were subcutaneously injected into the left and right hind limbs of 5 nude mice; gross xenografts (D) and tumor weights (E) were shown. (F) The long-term effect of ERO1L inhibitor EN460 on Capan-2 and MiaPaCa-2 cell proliferation was revealed by colony formation assay (n = 3). *P < 0.05; **P < 0.01; ***P < 0.001.
Figure 5
Figure 5
ERO1L activity is essential for its growth-promoting role in PDAC. (A) Western blotting analysis of AsPC1 and BxPC3 cells after overexpressing either wide type ERO1L or its inactive mutant C394A. (B) Cell viability of ERO1L-WT or ERO1L-C394A overexpressing AsPC1 and BxPC3 cells (n = 3). (C) The long-term effect of ERO1L-WT or ERO1L-C394A overexpression in AsPC1 and BxPC3 cells was revealed by colony formation assay (n = 3). (D-E) AsPC1-vector, AsPC1-ERO1L-WT, and AsPC1-ERO1L-C394A cells were subcutaneously injected into the left and right hind limbs of 5 nude mice; gross xenografts (D) and tumor weights (E) were shown. *P < 0.05.
Figure 6
Figure 6
ERO1L promotes the Warburg effect in pancreatic cancer cells. (A) Gene set enrichment analysis showed significant gene sets related to ERO1L expression; NES, normalized enrichment score; false discovery rate (FDR) was set at 0.25. (B) Measurement of glucose uptake in sh-Ctrl and sh-ERO1L Capan-2 and MiaPaCa-2 cells (n = 3). (C) Measurement of lactate production in sh-Ctrl and sh-ERO1L Capan-2 and MiaPaCa-2 cells (n = 3). (D) Detection of the extracellular acidification rate (ECAR) and oxygen consumption rate (OCR) in sh-Ctrl and sh-ERO1L Capan-2 and MiaPaCa-2 cells (n = 3). (E) Representative images of ERO1L expression in tumor tissues from PDAC patients who received preoperative 18F-FDG PET/CT examination; scale bar: 50 µm; the difference in the SUVmax value between ERO1L-high and ERO1L-low groups was analyzed. (F) AsPC1 and BxPC3 cells were cultured in media containing galactose but no glucose; plate colony formation experiment was performed to determine the anchorage-dependent tumor growth. (G) Effect of 2-FDG on the plate colony formation ability of ov-vector and ov-ERO1L AsPC1 and BxPC3 cells. (G) Effect of 2-DG on the plate colony formation ability of ov-vector and ov-ERO1L AsPC1 and BxPC3 cells in the presence or absence of 10 mM mannose. *P < 0.05 and **P < 0.01.
Figure 7
Figure 7
Correlation between UPR and glycolysis genetic signature in human PDAC. (A) Correlation analyses between UPR and glycolysis gene expression signature in TCGA cohort. (B) Kaplan-Meier graphs showing the association of UPR and glycolysis gene expression signature with PDAC patient survival. (C) Effects of ERO1L knockdown on ROS generation under the condition of ER stress in Capan-2 and MiaPaCa-2 cells. (D) Effects of ERO1L-WT or ERO1L-C394A overexpression on ROS generation under the condition of ER stress in AsPC-1 and BxPC-3 cells. (E) Effect of ERO1L overexpression on PDAC cell glycolysis and OXPHOS in the presence or absence of ER stress and N-acetyl cysteine (0.2 mM) treatment. (F-H) Representative images of spliced XBP1 (F), phosphorylated eIF2α (G), and CHOP (H) expression in tumor tissues from PDAC patients who received preoperative 18F-FDG PET/CT examination; scale bar: 50 µm; the difference in the SUVmax value between indicated groups was analyzed. *P < 0.05 and **P < 0.01.

References

    1. Bray F, Ferlay J, Soerjomataram I, Siegel RL, Torre LA, Jemal A. Global cancer statistics 2018: GLOBOCAN estimates of incidence and mortality worldwide for 36 cancers in 185 countries. CA Cancer J Clin. 2018;68:394–424. - PubMed
    1. Khalaf N, Wolpin BM. Metabolic Alterations as a Signpost to Early Pancreatic Cancer. Gastroenterology. 2019;156:1560–3. - PubMed
    1. Singhi AD, Koay EJ, Chari ST, Maitra A. Early Detection of Pancreatic Cancer: Opportunities and Challenges. Gastroenterology. 2019;156:2024–40. - PMC - PubMed
    1. Vege SS, Pandol SJ. Advances in Pancreatic Cancer, Intraductal Papillary Mucinous Neoplasms, and Pancreatitis. Gastroenterology. 2018;155:581–3. - PMC - PubMed
    1. Hetz C, Papa FR. The Unfolded Protein Response and Cell Fate Control. Mol Cell. 2018;69:169–81. - PubMed

Publication types

MeSH terms