Review
. 2020 Jun 4;10(13):6833-6843.
doi: 10.1002/ece3.6364. eCollection 2020 Jul.

Non-native species have multiple abundance-impact curves

Affiliations
Review

Non-native species have multiple abundance-impact curves

David L Strayer. Ecol Evol. .

Abstract

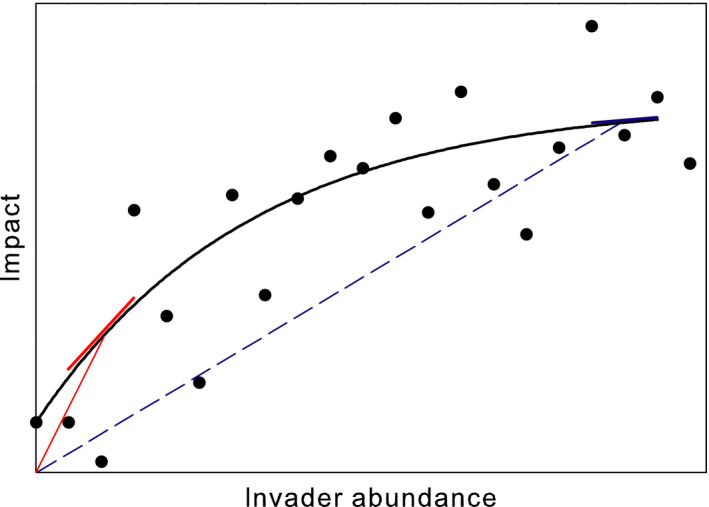
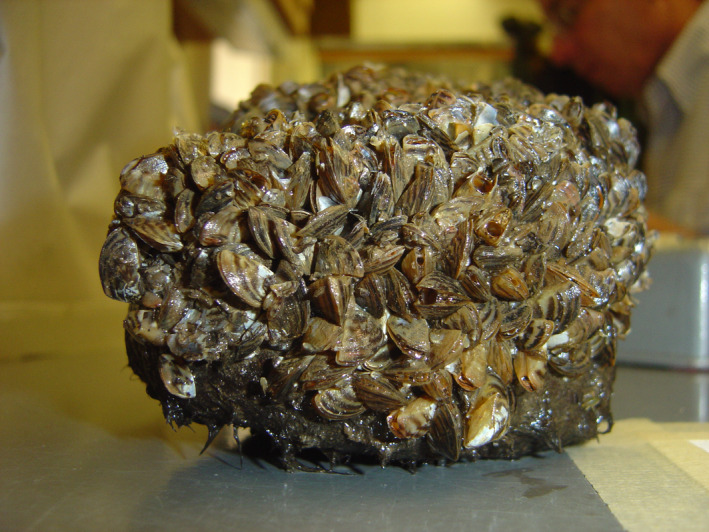
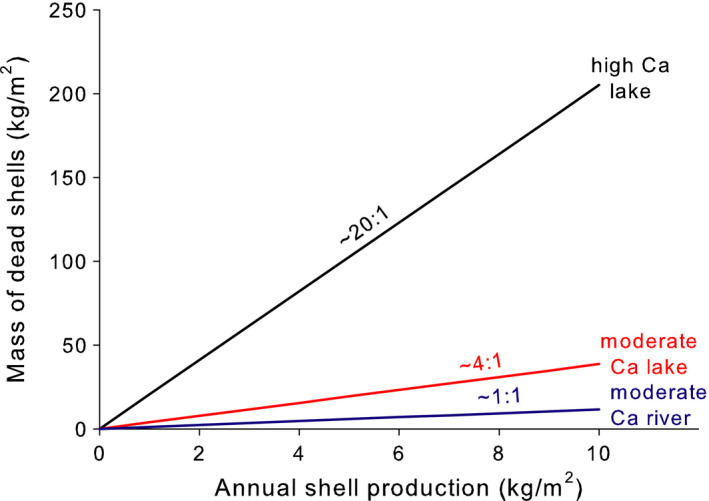
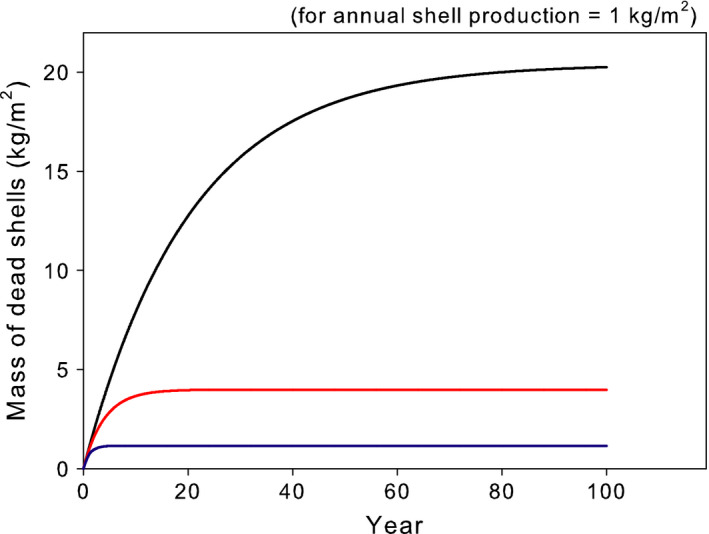
The abundance-impact curve is helpful for understanding and managing the impacts of non-native species. Abundance-impact curves can have a wide range of shapes (e.g., linear, threshold, sigmoid), each with its own implications for scientific understanding and management. Sometimes, the abundance-impact curve has been viewed as a property of the species, with a single curve for a species. I argue that the abundance-impact curve is determined jointly by a non-native species and the ecosystem it invades, so that a species may have multiple abundance-impact curves. Models of the impacts of the invasive mussel Dreissena show how a single species can have multiple, noninterchangeable abundance-impact curves. To the extent that ecosystem characteristics determine the abundance-impact curve, abundance-impact curves based on horizontal designs (space-for-time substitution) may be misleading and should be used with great caution, it at all. It is important for scientists and managers to correctly specify the abundance-impact curve when considering the impacts of non-native species. Diverting attention from the invading species to the invaded ecosystem, and especially to the interaction between species and ecosystem, could improve our understanding of how non-native species affect ecosystems and reduce uncertainty around the effects of management of populations of non-native species.

Keywords: Dreissena; biological invasions; bivalves; density‐impact function; impacts; invasive species; management; space‐for‐time substitution.


Conflict of interest statement

None declared.

Figures

FIGURE 1
FIGURE 1
A hypothetical abundance–impact curve (black curve, based on black data points), which shows the total impact of a population of an invader as a function of its abundance. The slopes of the red and blue lines show average (dashed lines) and marginal (solid lines) per capita effects at two values of invader abundance
FIGURE 2
FIGURE 2
Zebra mussels, Dreissena polymorpha, covering a rock taken from the bottom of the Hudson River. Photograph by Heather Malcom
FIGURE 3
FIGURE 3
The amount of dead shell material that would accumulate (at equilibrium) across a range of constant Dreissena population sizes (expressed as shell production rates) in three model ecosystems (black line = hardwater lake, red line = moderately hardwater lake, blue line = moderately hardwater river; see text for details). The ratios shown above the lines are the ratio of equilibrial shell accumulation to annual production
FIGURE 4
FIGURE 4
The amount of dead shell accumulated in three model ecosystems over time, assuming a constant shell production rate of 1 kg/m2 year. Black line = hardwater lake, red line = moderately hardwater lake, blue line = moderately hardwater river
FIGURE 5
FIGURE 5
Left. Temporal dynamics of shell production (thin gray line, nearly obscured by blue line) and shell accumulation in two model ecosystems (black line = hardwater lake, blue line = moderately hardwater river). Right. Relationship between measured annual shell production and current shell accumulation in each year of study, for two model ecosystems (black circles = hardwater lake, blue circles = moderately hardwater river)
FIGURE 6
FIGURE 6
The three pieces of information needed to estimate the relationship between Dreissena population size and the area available for colonization by submersed macrophytes
FIGURE 7
FIGURE 7
Expected increase in area of lake bottom suitable for submersed vegetation, as a function of Dreissena population size in different ecosystems. Black lines = deep, conical lake basin, gray lines = shallow, conical lake basin, red line = lake basin with a shelf. Note the difference in y‐axis scaling between the two panels. In the right panel, the black and gray lines have been shifted slightly for visibility (they actually lie on top of one another)
FIGURE 8
FIGURE 8
Expected impact of an invader in populations of lakes (each point is a lake; different colors represent lakes with different linear within‐system abundance–impact curves; black circles = high‐slope ecosystems, white circles = moderate slope ecosystems, green circles = low‐slope ecosystems) in different landscapes (see text for further explanation) (a) equal numbers of each type of lake, invader densities evenly spaced; (b) equal numbers of each type of lake, invader densities unevenly spaced; (c) unequal numbers of each type of lake, invader densities evenly spaced. The black regression lines are abundance–impact curves fitted through the entire collection of points

References

    1. Atkinson, C. L. , Capps, K. A. , Rugenski, A. T. , & Vanni, M. J. (2017). Consumer‐driven nutrient dynamics: From individuals to ecosystems. Biological Reviews, 92, 2003–2023. - PubMed
    1. Beguin, J. , Tremblay, J.‐P. , Thiffault, N. , Pothier, D. , & Côté, S. D. (2016). Management of forest regeneration in boreal and temperate deer‐forest systems: Challenges, guidelines, and research gaps. Ecosphere, 7, e01488 10.1002/ecs2.1488 - DOI
    1. Benkwitt, C. E. (2015). Non‐linear effects of invasive lionfish density on native coral‐reef fish communities. Biological Invasions, 17, 1383–1395. 10.1007/s10530-014-0801-3 - DOI
    1. Benson, A. J. , Raikow, D. , Larson, J. , Fusaro, A. , Bogdanoff, A. K. , & Elgin, A. (2019). Dreissena polymorpha (Pallas, 1771): U.S. Geological Survey, Nonindigenous Aquatic Species Database, Gainesville, FL. Retrieved from https://nas.er.usgs.gov/queries/FactSheet.aspx?speciesID=5
    1. Blackburn, T. M. , Essl, F. , Evans, T. , Hulme, P. E. , Jeschke, J. M. , Kühn, I. , … Bacher, S. (2014). A unified classification of alien species based on the magnitude of their environmental impacts. PLoS Biology, 12, e1001850 10.1371/journal.pbio.1001850 - DOI - PMC - PubMed