

Metrics for Evaluation and Screening of Metal-Organic Frameworks for Applications in Mixture Separations
- PMID: 32724867
- PMCID: PMC7379136
- DOI: 10.1021/acsomega.0c02218
Metrics for Evaluation and Screening of Metal-Organic Frameworks for Applications in Mixture Separations
Abstract
For mixture separations, metal-organic frameworks (MOFs) are of practical interest. Such separations are carried out in fixed bed adsorption devices that are commonly operated in a transient mode, utilizing the pressure swing adsorption (PSA) technology, consisting of adsorption and desorption cycles. The primary objective of this article is to provide an assessment of the variety of metrics that are appropriate for screening and ranking MOFs for use in fixed bed adsorbers. By detailed analysis of several mixture separations of industrial significance, it is demonstrated that besides the adsorption selectivity, the performance of a specific MOF in PSA separation technologies is also dictated by a number of factors that include uptake capacities, intracrystalline diffusion influences, and regenerability. Low uptake capacities often reduce the efficacy of separations of MOFs with high selectivities. A combined selectivity-capacity metric, Δq, termed as the separation potential and calculable from ideal adsorbed solution theory, quantifies the maximum productivity of a component that can be recovered in either the adsorption or desorption cycle of transient fixed bed operations. As a result of intracrystalline diffusion limitations, the transient breakthroughs have distended characteristics, leading to diminished productivities in a number of cases. This article also highlights the possibility of harnessing intracrystalline diffusion limitations to reverse the adsorption selectivity; this strategy is useful for selective capture of nitrogen from natural gas.
Copyright © 2020 American Chemical Society.
Conflict of interest statement
The author declares no competing financial interest.
Figures


 vs adsorption selectivity Sads for 20/80
Xe(1)/Kr(2) mixture adsorption at 298 K
and 100 kPa in six different MOFs: NiMOF-74, Ag@NiMOF-74, CuBTC,, SBMOF-2, CoFormate (=Co3(HCOO)6), and SAPO-34. (c) Comparison of the transient breakthrough
simulations for separation of 20/80 Xe/Kr mixtures at 298 K and 100
kPa in fixed beds packed with CoFormate and Ag@NiMOF-74. The dimensionless
concentrations at the exit of the fixed bed are plotted as a function
of Q0t/mads, where Q0 is the volumetric
flow rate of the gas mixture at the inlet to the fixed bed, expressed
in L s–1, at STP conditions. (d) Plot of the productivity
of pure Kr, determined from breakthrough simulations, vs the IAST
calculations of
vs adsorption selectivity Sads for 20/80
Xe(1)/Kr(2) mixture adsorption at 298 K
and 100 kPa in six different MOFs: NiMOF-74, Ag@NiMOF-74, CuBTC,, SBMOF-2, CoFormate (=Co3(HCOO)6), and SAPO-34. (c) Comparison of the transient breakthrough
simulations for separation of 20/80 Xe/Kr mixtures at 298 K and 100
kPa in fixed beds packed with CoFormate and Ag@NiMOF-74. The dimensionless
concentrations at the exit of the fixed bed are plotted as a function
of Q0t/mads, where Q0 is the volumetric
flow rate of the gas mixture at the inlet to the fixed bed, expressed
in L s–1, at STP conditions. (d) Plot of the productivity
of pure Kr, determined from breakthrough simulations, vs the IAST
calculations of  for six different MOFs with y10 = 0.2; y20 = 0.8. Further
information on input data and simulation details are provided in earlier
works.,,
for six different MOFs with y10 = 0.2; y20 = 0.8. Further
information on input data and simulation details are provided in earlier
works.,,
 for six different MOFs with y10 = 0.2; y20 = 0.8. Further
information on input data and simulation details are provided in earlier
works.,,
for six different MOFs with y10 = 0.2; y20 = 0.8. Further
information on input data and simulation details are provided in earlier
works.,,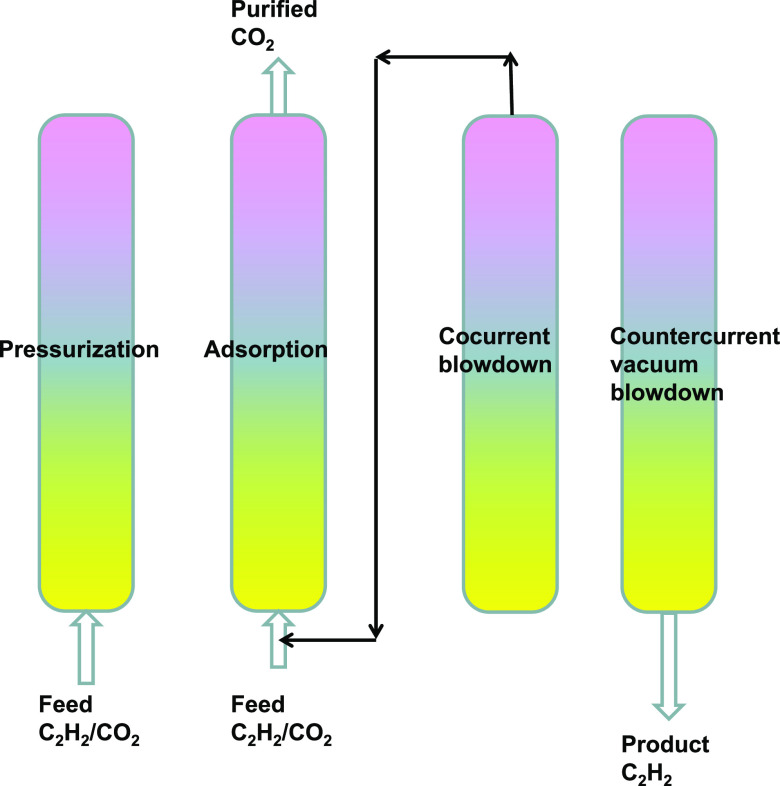
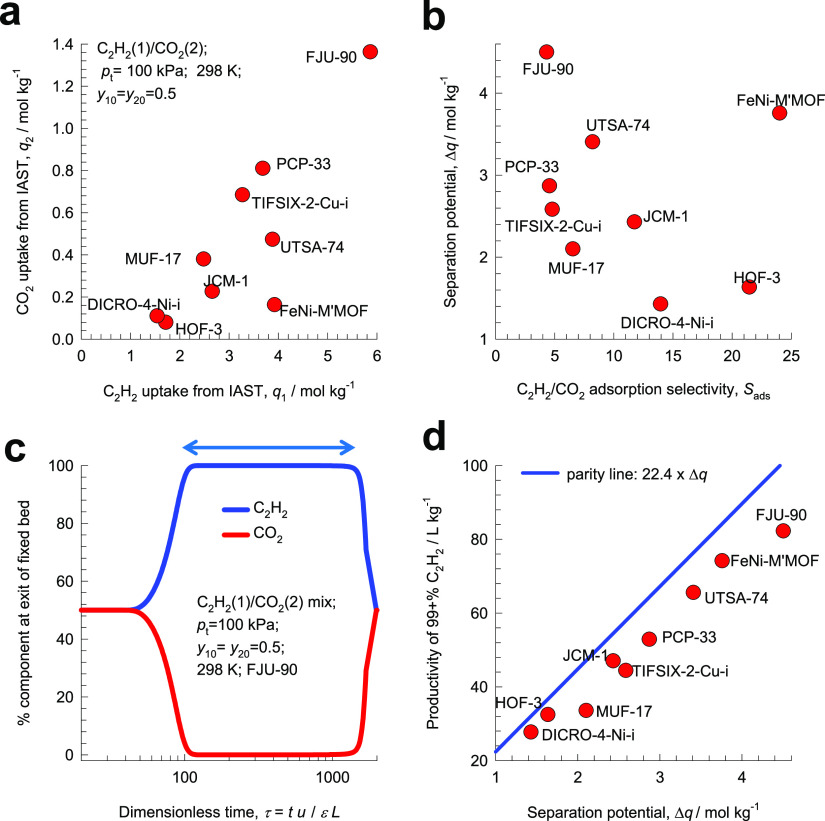
 vs adsorption selectivity Sads for the
adsorption of C2H2(1)/CO2(2) mixtures
in nine different MOFs operating at 298 K and
100 kPa. (c) Simulations of transient desorption (blowdown) under
deep vacuum (0.2 Pa total pressure and 298 K). During the time interval
indicated by the arrow, the C2H2 product containing
<1% CO2 can be recovered. (d) Productivity of 99%+ pure
C2H2 product determined by transient desorption
simulations for PCP-33, HOF-3, TIFSIX-2-Cu-i, JCM-1, DICRO-4-Cu-i,
MUF-17, UTSA-74, FJU-90, and FeNi-M′MOF at 298 K and 100 kPa,
plotted as a function of the separation potential
vs adsorption selectivity Sads for the
adsorption of C2H2(1)/CO2(2) mixtures
in nine different MOFs operating at 298 K and
100 kPa. (c) Simulations of transient desorption (blowdown) under
deep vacuum (0.2 Pa total pressure and 298 K). During the time interval
indicated by the arrow, the C2H2 product containing
<1% CO2 can be recovered. (d) Productivity of 99%+ pure
C2H2 product determined by transient desorption
simulations for PCP-33, HOF-3, TIFSIX-2-Cu-i, JCM-1, DICRO-4-Cu-i,
MUF-17, UTSA-74, FJU-90, and FeNi-M′MOF at 298 K and 100 kPa,
plotted as a function of the separation potential  with y10 = y20 = 0.5. Further information on input data
and simulation details are provided in earlier works.,,,
with y10 = y20 = 0.5. Further information on input data
and simulation details are provided in earlier works.,,,
 determined from IAST with y10 = 0.01; y20 = 0.99. (c)
Separation potential, Δq, of SIFSIX-2-Cu-i
and SIFSIX-1-Cu, plotted as a function of the % C2H2 in the feed mixture. Further information on input data and
simulation details are provided in the
determined from IAST with y10 = 0.01; y20 = 0.99. (c)
Separation potential, Δq, of SIFSIX-2-Cu-i
and SIFSIX-1-Cu, plotted as a function of the % C2H2 in the feed mixture. Further information on input data and
simulation details are provided in the 


References
-
- Sircar S.; Golden T. C. Purification of Hydrogen by Pressure Swing Adsorption. Separ. Sci. Technol. 2000, 35, 667–687. 10.1081/ss-100100183. - DOI
-
- Ribeiro A. M.; Grande C. A.; Lopes F. V. S.; Loureiro J. M.; Rodrigues A. E. A parametric study of layered bed PSA for hydrogen purification. Chem. Eng. Sci. 2008, 63, 5258–5273. 10.1016/j.ces.2008.07.017. - DOI
-
- Banu A.-M.; Friedrich D.; Brandani S.; Düren T. A Multiscale Study of MOFs as Adsorbents in H2 PSA Purification. Ind. Eng. Chem. Res. 2013, 52, 9946–9957. 10.1021/ie4011035. - DOI
-
- Majlan E. H.; Wan Daud W. R.; Iyuke S. E.; Mohamad A. B.; Kadhum A. A. H.; Mohammad A. W.; Takriff M. S.; Bahaman N. Hydrogen purification using compact pressure swing adsorption system for fuel cell. Int. J. Hydrogen Energy 2009, 34, 2771–2777. 10.1016/j.ijhydene.2008.12.093. - DOI
-
- Yang R. T.Adsorbents: Fundamentals and Applications; John Wiley & Sons, Inc.: Hoboken, New Jersey, 2003.
Publication types
LinkOut - more resources
Full Text Sources
Research Materials
Miscellaneous
