Editorial
. 2020 Jul 24;4(7):e00239.
doi: 10.1002/pld3.239. eCollection 2020 Jul.

N6-methyladenosine and RNA secondary structure affect transcript stability and protein abundance during systemic salt stress in Arabidopsis

Affiliations
Editorial

N6-methyladenosine and RNA secondary structure affect transcript stability and protein abundance during systemic salt stress in Arabidopsis

Marianne C Kramer et al. Plant Direct. .

Abstract

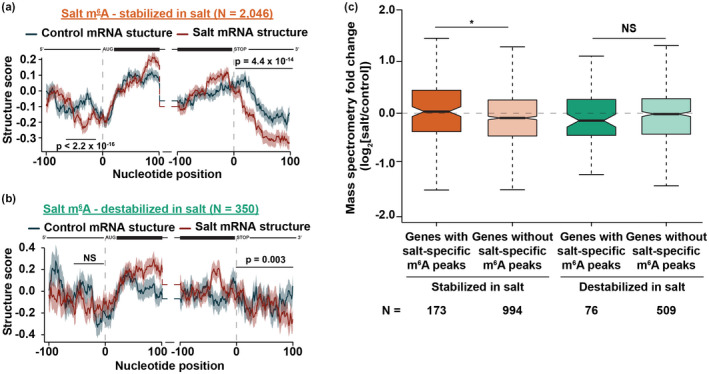
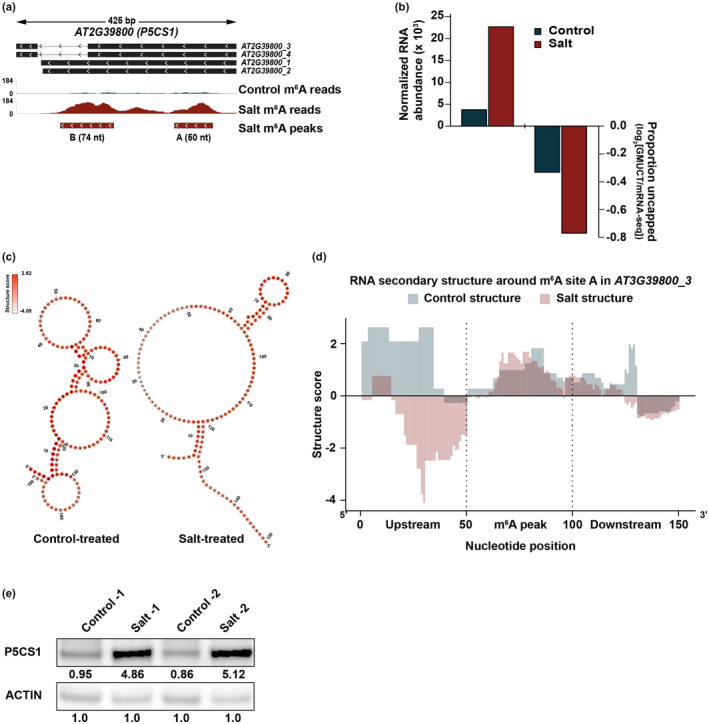
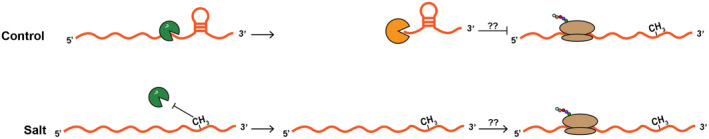
After transcription, a messenger RNA (mRNA) is further post-transcriptionally regulated by several features including RNA secondary structure and covalent RNA modifications (specifically N6-methyladenosine, m6A). Both RNA secondary structure and m6A have been demonstrated to regulate mRNA stability and translation and have been independently linked to plant responses to soil salinity levels. However, the effect of m6A on regulating RNA secondary structure and the combinatorial interplay between these two RNA features during salt stress response has yet to be studied. Here, we globally identify RNA-protein interactions and RNA secondary structure during systemic salt stress. This analysis reveals that RNA secondary structure changes significantly during salt stress, and that it is independent of global changes in RNA-protein interactions. Conversely, we find that m6A is anti-correlated with RNA secondary structure in a condition-dependent manner, with salt-specific m6A correlated with a decrease in mRNA secondary structure during salt stress. Taken together, we suggest that salt-specific m6A deposition and the associated loss of RNA secondary structure results in increases in mRNA stability for transcripts encoding abiotic stress response proteins and ultimately increases in protein levels from these stabilized transcripts. In total, our comprehensive analyses reveal important post-transcriptional regulatory mechanisms involved in plant long-term salt stress response and adaptation.

Keywords: RNA covalent modifications; RNA processing; RNA stability; RNA‐binding proteins; non‐coding RNAs; post‐transcriptional regulation.


Figures

FIGURE 1
FIGURE 1
RNA secondary structure and RBP binding are correlated in 4‐week‐old rosette leaves. (a) Overlap between high‐confidence PPSs identified in both replicates of either control‐ (blue) or salt‐treated (red) tissue. The intersection indicates PPSs that overlap by at least one nucleotide. See Data Sets S1–S5. (b) Distribution of high‐confidence control‐specific, salt‐specific, and shared PPSs identified in each genic region within protein‐coding mRNAs. (c) Distribution of high‐confidence control‐specific, salt‐specific, and shared PPSs identified in various types of noncoding RNAs. (d,e) Average RBP binding (green line) and structure score (orange line) at each nucleotide ±100 nt of the annotated start and stop codon in nuclear mRNAs in control‐treated (d) or salt‐treated (e) tissue. The tables represent Spearman's rho correlations between RBP binding and structure score across the entire upstream window (±100 nt of the start codon), 5’ UTR, 5’ CDS, 3’ CDS, 3’ UTR, and downstream window (±100 nt of the stop codon) across all plotted transcripts. Shading around the line indicates the SEM across all plotted transcripts. High‐confidence PPSs identified in both replicates of control‐treated (N = 17,669) or salt‐treated (N = 5,883) tissue was used to calculate RBP binding. N = 14,461 mRNAs. *, **, and ***p < .05, .01, and .001, respectively, Spearman's asymptotic t approximation. mRNA diagrams above plots are not to scale. (f,g) Average RBP binding (green line) and structure score (orange line) across all binned, spliced lncRNAs (lncRNA, antisense lncRNAs, antisense RNA, ncRNA) in control‐treated (f) or salt‐treated (g) tissue. The tables represent Spearman's rho correlations between RBP binding and structure score across the entire binned window of the lncRNAs. Dashed lines indicate the average RBP binding (green) or structure score (orange) across the entire binned transcript. Shading around the line indicates the SEM across all plotted lncRNAs. High‐confidence PPSs identified in both replicates of control‐treated (N = 17,669) or salt‐treated (N = 5,883) tissue was used to calculate RBP binding. N = 906 lncRNAs. See Data Set S6. p‐values are as denoted; Spearman's asymptotic t approximation.
FIGURE 2
FIGURE 2
Nuclear RNA secondary structure significantly changes during salt stress response. (a,b) Average structure score (a) and RBP binding (b) in the ± 100 nt of the annotated start and stop codon in nuclear protein‐coding mRNAs expressed in both control‐treated (blue line) and salt‐treated (red line) tissue. High‐confidence PPSs were divided into those that were expressed exclusively in control‐treated tissue (blue line), salt‐treated tissue (red line) or common to both treatments (yellow line). See Data Sets S3–S5. Shading around the line indicates the SEM across all plotted transcripts. N = 14,461 mRNAs. ***p < .001, Wilcoxon test. mRNA diagrams above plots are not to scale. Grey shading is to highlight the 50 nt upstream of the start codon. (c,d) Average structure score (c) and RBP binding (d) across binned, spliced all lncRNAs (lncRNA, antisense lncRNAs, antisense RNA, ncRNA) expressed in both control‐treated (blue line) or salt‐treated (red line) tissue. High‐confidence PPSs were divided into those that were expressed exclusively in control‐treated tissue (blue line), salt‐treated tissue (red line), or common to both treatments (yellow line). See Data Sets S3–S5. Shading around the line indicates the SEM across all plotted transcripts. N = 906 lncRNAs.
FIGURE 3
FIGURE 3
m6A is highly dynamic during exposure to long‐term salt stress response and is anti‐correlated with RNA secondary structure. (a) Classification for m6A peaks within protein‐coding genes found only in control‐treated tissue (N = 1,732 peaks), only in salt‐treated tissue (N = 4,473 peaks), or common to both (N = 13,375 peaks). (b) m6A density distribution in the ± 200 nt of the start and stop codon for control‐specific (blue), salt‐specific (red), and share m6A peaks (yellow). Dashed vertical lines near the start codon represent the apex of the peak in m6A density at the start codon for control‐treated (blue) and salt‐treated (red) tissue. N = 6,515 mRNAs. NS p > .05; *, **, and *** denote < .05, 0.01, and 0.001, respectively, Spearman's asymptotic t approximation. mRNA diagrams above plots are not to scale. (c,d) Average m6A density (light blue line) and structure score (orange line) at each nucleotide ± 200 nt of the annotated start and stop codon in nuclear mRNAs in control‐treated (c) or salt‐treated (d) tissue. The tables represent Spearman's rho correlations between m6A density and structure score in the 5’ UTR, 5’ CDS, 3’ CDS, and 3’ UTR across all plotted transcripts. Shading around the line indicates the SEM across all plotted transcripts. N = 4,260 mRNAs. Dashed vertical light blue lines indicate the apex of the peak in m6A density at the start codon. Dashed orange lines indicate the dip in secondary structure at the start codon. Orange shading at the start codon represents the broad dip in salt stress (d). mRNA diagrams above plots are not to scale. (e‐f) RNA secondary structure scores in control‐treated (blue) and salt‐treated (red) tissues across binned salt‐specific (e) or control‐specific (f) m6A peaks located in the 3’ UTR and equal‐sized flanking regions to the 5’ and 3’ end. Dashed lines represent the average structure scores in each bin. Shading around the line indicates the SEM across all plotted transcripts.
FIGURE 4
FIGURE 4
RNA secondary structure alone does not substantially affect mRNA abundance, stability, or translation output. (a–c) mRNA abundance fold change (y‐axis; log2[RPMSalt/RPMControl]) compared to RNA secondary structure fold change (x‐axis; log2[avg. structure scoreSalt/avg. structure scoreControl]) in the 5’ UTR (a), CDS (b), and 3’ UTR (c). Plots were made using geom_hex in the ggplot2 package in 50 bins. Color of each bin indicates the number of transcripts that fall within that range. R and p‐value calculated from Pearson coefficient. Solid black line represents the linear regression of each plot. N = 14,313. See Data Set S7. (d–f) Proportion uncapped fold change (log2[proportion uncappedSalt/proportion uncappedControl]) for transcripts that lose (light blue; log2[avg. structure scoreSalt/avg. structure scoreControl] <0) or gain (light red; log2[avg. structure scoreSalt/avg. structure scoreControl] >0) RNA secondary structure in the 5’ UTR (D), CDS (e), or 3’ UTR (f). *p < .05; **p < .001; NS denotes p > .05, Wilcoxon test. (g–i) Protein abundance fold change (log2[salt/control]) for transcripts that lose (light blue; log2[avg. structure scoreSalt/avg. structure scoreControl] <0) or gain (light red; log2[avg. structure scoreSalt/avg. structure scoreControl] >0) RNA secondary structure in the 5’ UTR (g), CDS (h), or 3’ UTR (I). NS denotes p > .05, Wilcoxon test. See Data Set S8.
FIGURE 5
FIGURE 5
Transcripts that gain m6A and are stabilized upon systemic salt stress response lose RNA secondary structure at the start codon and 3’ UTR and produce more protein. (a,b) Average structure score in control‐treated (blue line) and salt‐treated (red line) tissue in the ±100 nt of the annotated start and stop codon of nuclear protein‐coding transcripts that gain m6A and are stabilized (a) or destabilized (b) during long‐term salt stress response. See Data Set S9. Shading around the line indicates the SEM across all plotted transcripts. p‐values were calculated using a Wilcoxon test and are denoted over the specific regions. mRNA diagrams above plots are not to scale. (c) Protein abundance fold change (log2[salt/control]) for transcripts that contain salt‐specific m6A peaks (darker colors) or lack salt‐specific m6A peaks (lighter colors) and are stabilized (orange) or destabilized (green) during salt stress response. NS and *> .05 or <.05, respectively, Wilcoxon test. See Data Set S8.
FIGURE 6
FIGURE 6
m6A modified, salt stress related gene P5CS1 loses structure, is stabilized and its protein abundance increases during salt stress. (a) Representative image of the location of two salt‐specific m6A sites (denoted in the salt m6A peaks track) found in AT2G39800 (P5CS1) and read coverage from m6A‐seq in control‐treated (blue) and salt‐treated (red) tissue. (b) Normalized RNA abundance calculated by DESeq2 and proportion uncapped in control‐ and salt‐treated tissue for AT2G39800. (c) RNA fold model for m6A peak A in AT2G39800 in control‐ (left) and salt‐treated (right) tissue constrained with PIP‐seq determined structure scores. Color of each nucleotide indicates structure score, with darker colors indicating higher structure score. (d) RNA structure score scores from PIP‐seq for peak A within AT2G39800 and equal sized regions flanking to the 5’ and 3’ end. (e) Western blot in control‐ and salt‐treated tissue for P5CS1 and ACTIN. Quantifications were calculated as previously described (Davarinejad, 2015).
FIGURE 7
FIGURE 7
Hypothesized model of the role of m6A and mRNA secondary structure in transcript stabilization and translation during salt stress response. m6A is specifically deposited on transcripts encoding proteins involved in osmotic stress response in salt‐treated tissue where it relieves RNA secondary structure in the 3’ UTR and protects from degradation. This allows for translation of these transcripts and proper salt stress response.

References

    1. Anderson, S. J. , Kramer, M. C. , Gosai, S. J. , Yu, X. , Vandivier, L. E. , Nelson, A. D. L. , … Gregory, B. D. (2018). N6‐Methyladenosine inhibits local ribonucleolytic cleavage to stabilize mrnas in arabidopsis. Cell Reports, 25, 1146–1157.e3. - PubMed
    1. Beaudoin, J.‐D. , Novoa, E. M. , Vejnar, C. E. , Yartseva, V. , Takacs, C. M. , Kellis, M. , & Giraldez, A. J. (2018). Analyses of mRNA structure dynamics identify embryonic gene regulatory programs. Nature Structural & Molecular Biology, 25, 677–686. - PMC - PubMed
    1. Berkowitz, N. D. , Silverman, I. M. , Childress, D. M. , Kazan, H. , Wang, L.‐S. , & Gregory, B. D. (2016). A comprehensive database of high‐throughput sequencing‐based RNA secondary structure probing data (Structure Surfer). BMC Bioinformatics, 17, 215. - PMC - PubMed
    1. Brimacombe, R. , & Stiege, W. (1985). Structure and function of ribosomal RNA. The Biochemical Journal, 229, 1–17. - PMC - PubMed
    1. Chen, Q. , Zheng, Y. , Luo, L. , Yang, Y. , Hu, X. , & Kong, X. (2018). Functional FRIGIDA allele enhances drought tolerance by regulating the P5CS1 pathway in Arabidopsis thaliana. Biochemical and Biophysical Research Communications, 495, 1102–1107. - PubMed

Publication types