. 2020 Nov 2;217(11):e20200600.
doi: 10.1084/jem.20200600.

Mutations in COPA lead to abnormal trafficking of STING to the Golgi and interferon signaling

Affiliations

Mutations in COPA lead to abnormal trafficking of STING to the Golgi and interferon signaling

Alice Lepelley et al. J Exp Med. .

Abstract

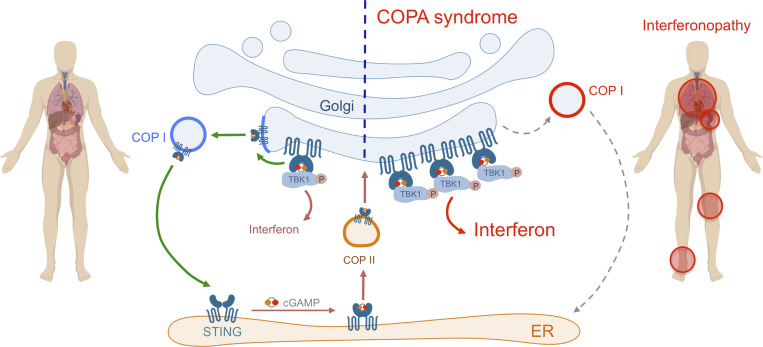
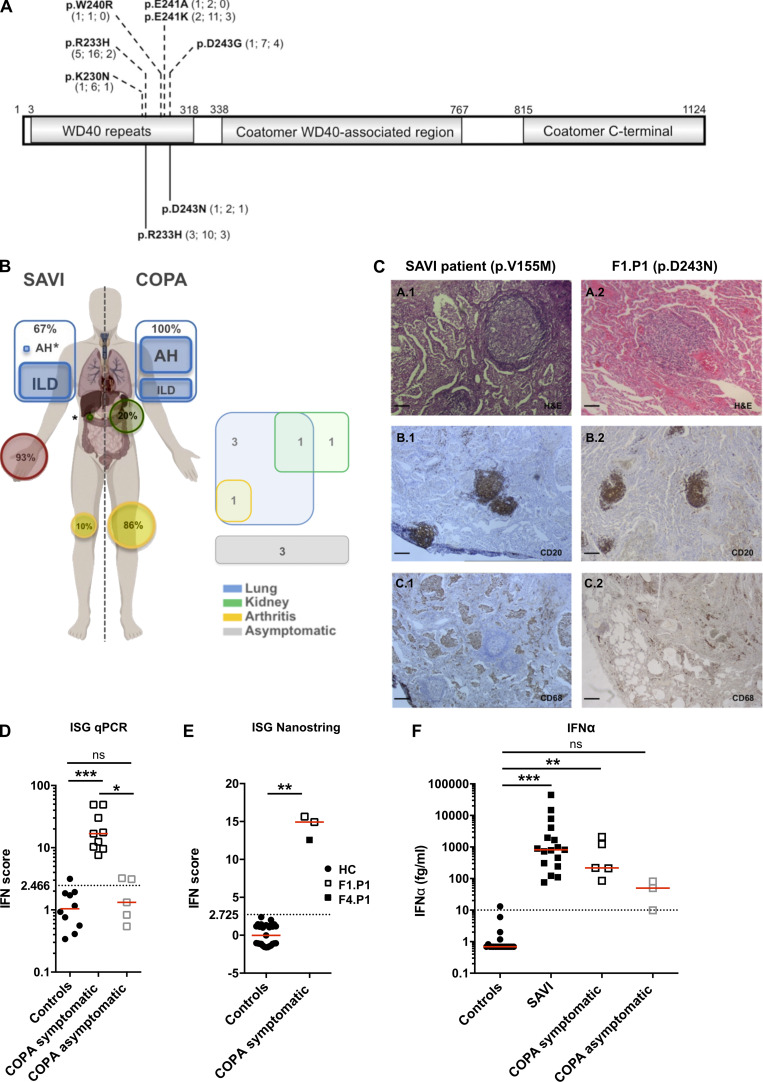
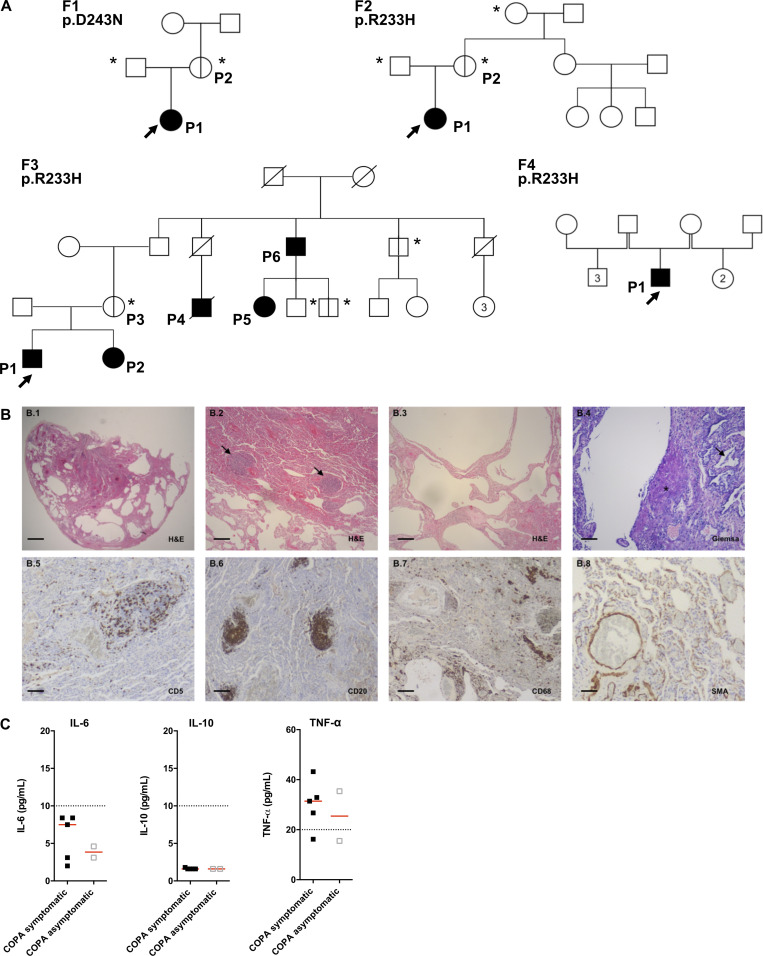
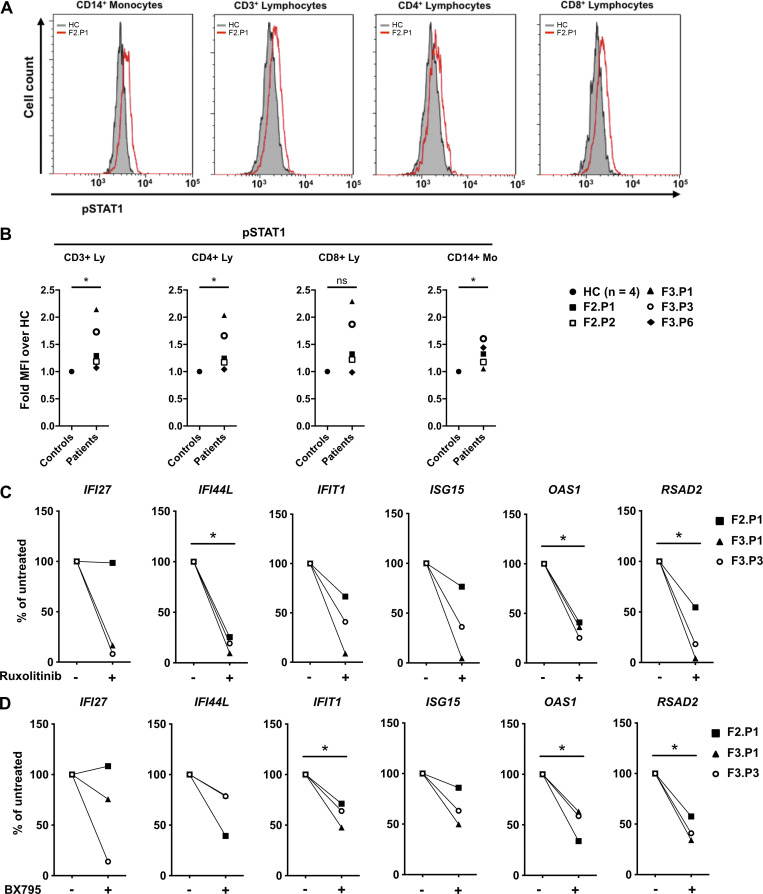
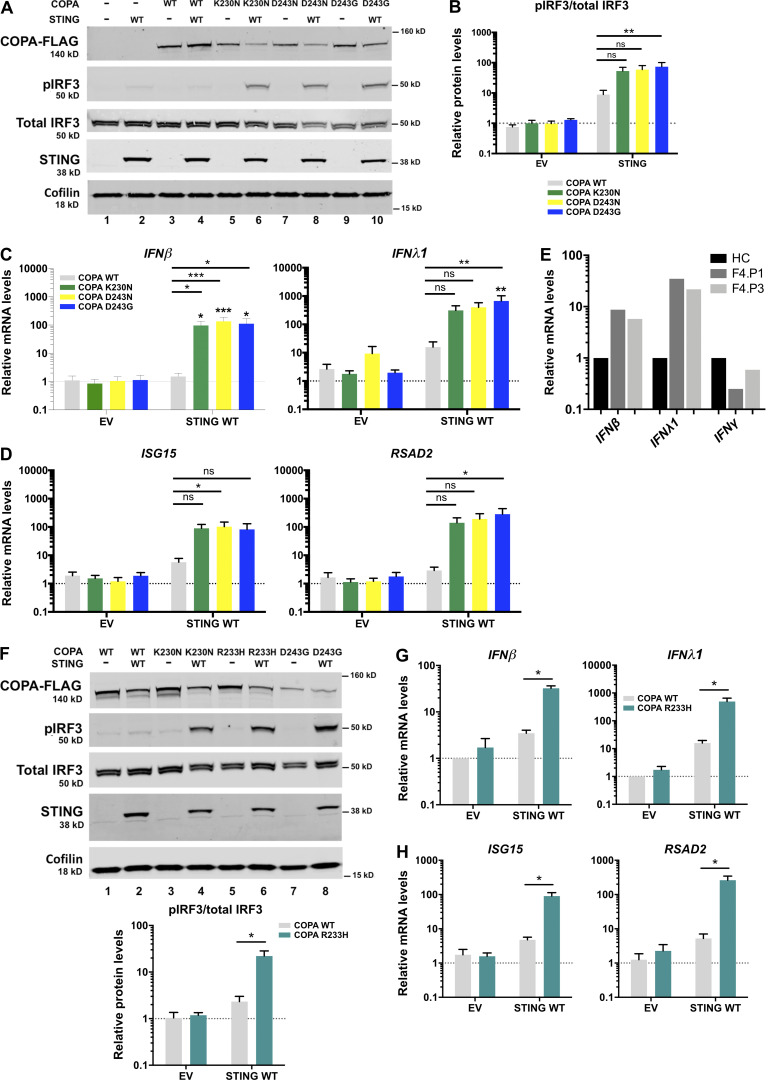
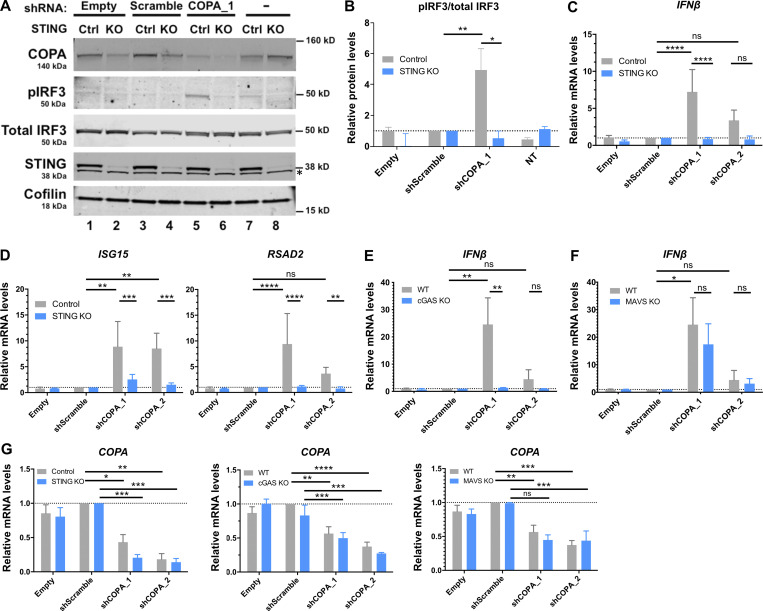
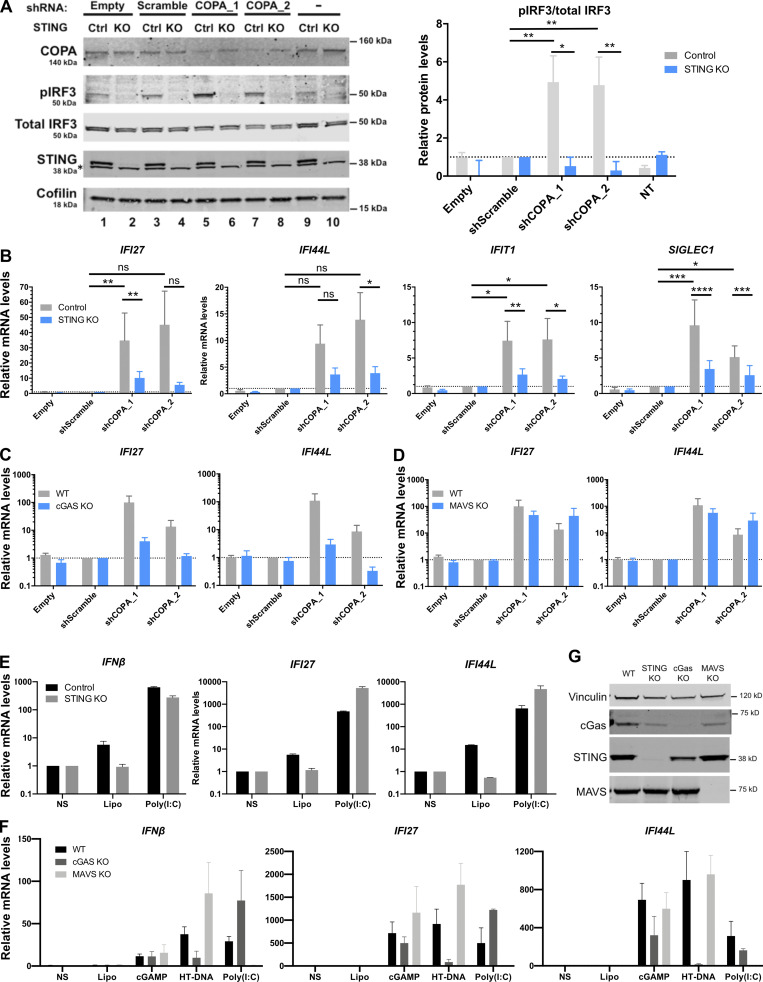
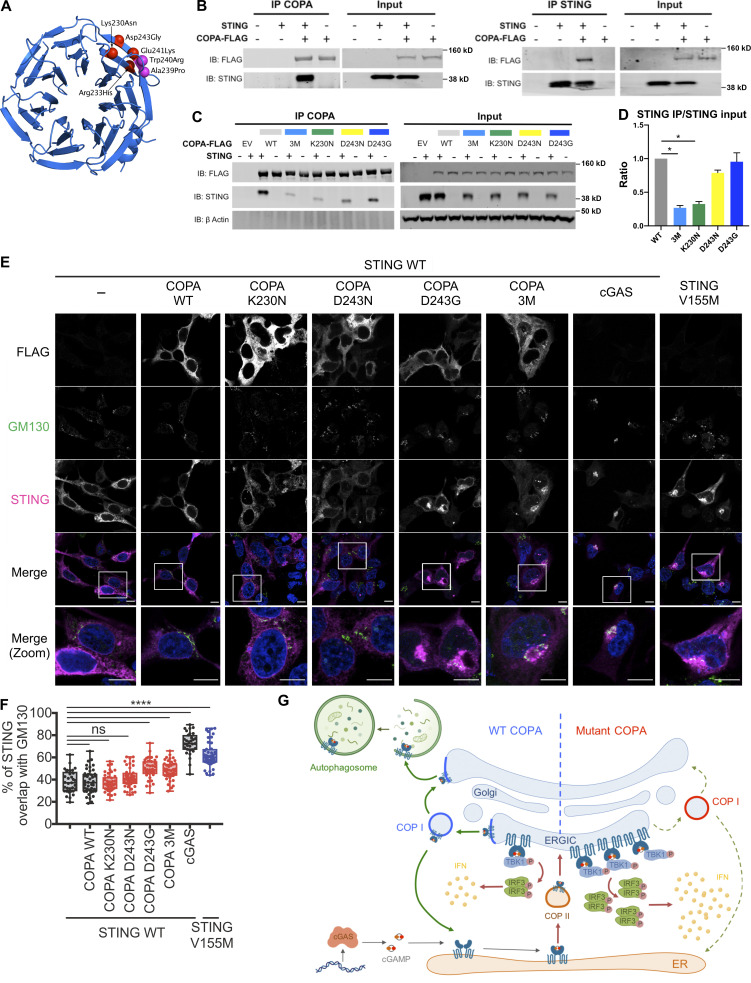
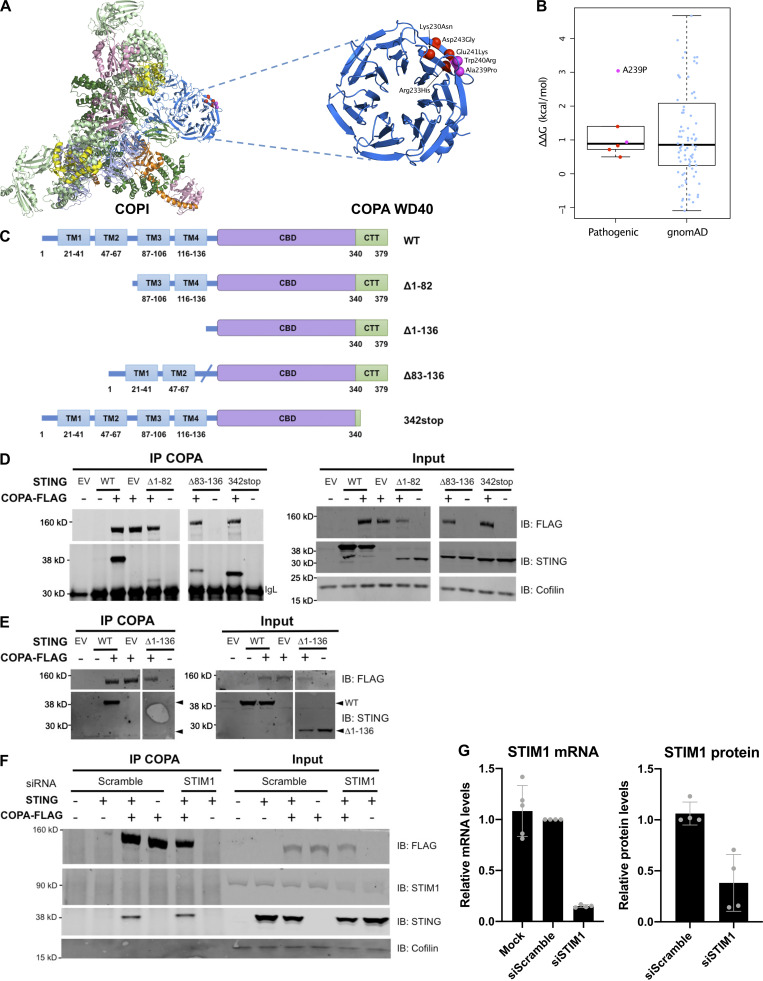
Heterozygous missense mutations in coatomer protein subunit α, COPA, cause a syndrome overlapping clinically with type I IFN-mediated disease due to gain-of-function in STING, a key adaptor of IFN signaling. Recently, increased levels of IFN-stimulated genes (ISGs) were described in COPA syndrome. However, the link between COPA mutations and IFN signaling is unknown. We observed elevated levels of ISGs and IFN-α in blood of symptomatic COPA patients. In vitro, both overexpression of mutant COPA and silencing of COPA induced STING-dependent IFN signaling. We detected an interaction between COPA and STING, and mutant COPA was associated with an accumulation of ER-resident STING at the Golgi. Given the known role of the coatomer protein complex I, we speculate that loss of COPA function leads to enhanced type I IFN signaling due to a failure of Golgi-to-ER STING retrieval. These data highlight the importance of the ER-Golgi axis in the control of autoinflammation and inform therapeutic strategies in COPA syndrome.


Conflict of interest statement

Disclosures: M. Wislez reported personal fees from Boeringher Ingelheim, Roche, MSD, BMS, Astra Zeneca, and Amgen outside the submitted work. Y.J. Crow reported "other" from Biogen outside the submitted work. No other disclosures were reported.

Figures

None
Graphical abstract
Figure 1.
Figure 1.
Heterozygous mutations in COPA, comparison of COPA syndrome and SAVI, and constitutive activation of the type I IFN pathway in patients. (A) Schematic representation of COPA adapted from Watkin et al. (2015) highlighting the WD40 repeat domain, the coatomer WD40-associated region, and the coatomer C-terminal region. Previously reported mutations (Watkin et al., 2015; Noorelahi et al., 2018; Patwardhan and Spencer, 2019) are shown above (p.K230N, p.R233H, p.W240R, p.E241K, p.E241A, and p.D243G). The mutations carried by the patients in this study are shown below (previously reported p.R233H and newly described p.D243N). Numbers in brackets refer to the number of families identified, mutation carriers, and asymptomatic individuals, respectively. (B) Comparison of the clinical phenotypes of SAVI and COPA syndrome according to published data (left, and see Table S2), and features present in the patients of this study (right). Lung, kidney, skin, and joint involvement are represented in blue, green, red, and yellow, respectively. AH, alveolar hemorrhage; asterisks represent a single patient reported in the literature (Volpi et al., 2019; Tang et al., 2020). (C) Comparison of histopathological features of the lung of a patient with SAVI carrying a p.V155M mutation in STING (Jeremiah et al., 2014; left) and F1.P1 (right). H&E staining showing lymphoid follicles (A.1 and A.2). Immunohistochemical staining identified a majority of CD20+ B cells within the B cell follicles (B.1 and B.2), and macrophage (CD68+) alveolar infiltration in the SAVI patient (C.1), and the presence of rare macrophages (CD68+ cells) within the alveoli of F1.P1 (C.2). Original magnification: ×40 (A; scale bars, 100 µm), ×10 (B and C; scale bars, 400 µm). (D) IFN scores calculated from the median fold change in relative quantification values for a set of six ISGs (Rice et al., 2013; IFI27, IFI44L, IFIT1, ISG15, RSAD2, SIGLEC1; normal <2.466) recorded in patients, as compared with 10 HCs. Red lines indicate median values. Median values in symptomatic patients (n = 9 samples from five individuals; 16.87; IQR, 9.953–39.73) were significantly higher than in HCs (1.045; IQR, 0.5225–1.870; ***, P= 0.0002), whereas median values in asymptomatic carriers (n = 5 samples from three individuals; 1.319; IQR, 0.6865– 3.179) were comparable to HCs (by Kruskal–Wallis test). One asymptomatic carrier (F2.P2) displayed a mildly positive IFN signature on two occasions (IFN scores above the dotted line). (E) IFN scores calculated from the median fold change in relative quantification values for a set of 24 ISGs (see Materials and methods and Table S4, normal <2.725) recorded in the peripheral blood of F1.P1 (sampled twice, depicted as open squares) and F4.P1 (depicted as a black square), as compared with 27 HCs (depicted as circles). Red lines indicate median values. Data were statistically analyzed using the Mann–Whitney test (**, P < 0.01). (F) Concentrations of IFN-α protein assessed by ultra-sensitive digital ELISA (Rodero et al., 2017) in plasma or serum from HCs (n = 20, <10 fg/ml), and patients with mutations in TMEM173 encoding STING (n = 17 samples from nine SAVI patients) or COPA (n = 5 samples from five symptomatic patients and n = 3 samples from two asymptomatic carriers). Red lines indicate median values of 817.8 fg/ml (IQR, 275–3,039), 217.7 fg/ml (IQR, 148–1,658), and 49.61 fg/ml (IQR, 9.809–81), respectively, in SAVI patients, COPA symptomatic patients, and asymptomatic carriers. Data were statistically analyzed using the Kruskal–Wallis test (**, P < 0.01; ***, P < 0.0001; ns, not significant).
Figure S1.
Figure S1.
Pedigrees of the patients, lung pathology of F1.P1, and concentration of NF-κB–related cytokines observed in the patients. (A) Pedigrees of the four families (F) in this study. Circles (females) and squares (males) blackened and clear with vertical lines indicate respectively symptomatic and asymptomatic carriers of the annotated heterozygous mutation in COPA. Diagonal bars indicate deceased individuals. Arrows and asterisks indicate, respectively, index cases and asymptomatic individuals screened for the mutation. Numbers inside the symbols indicate the number of individuals of the same gender. (B) Histopathological analysis of the lung biopsy of F1.P1. (B.1–B.4) H&E and Giemsa staining showing subpleural emphysema with local interstitial thickening of the remaining interalveolar septa (B.1 and B.2), lymphoid follicles (arrows; B.3), and mildly cellular fibroblastic foci (star), as well as mild macrophagic alveolitis (arrow; B.4, B.5, B.6, and B.7). Immunohistochemical staining identified a majority of CD20+ B cells within the B cell follicles, scattered CD5+ T cells in the interstitium, and the presence of rare macrophages (CD68+ cells) within the alveoli. (B.8) Anti-smooth muscle actin (SMA) staining demonstrating normal staining of vessels and absence of myofibroblastic proliferation in the interstitium. Original magnification: ×4 (B.1; scale bar, 1 mm), ×10 (B.2, B.3, B.6, and B.7; scale bars, 400 µm), ×40 (B.4, B.5, and B.8; scale bars, 100 µm). (C) Concentrations of IL-6 protein (normal < 10 pg /ml), IL-10 protein (normal < 10 pg /ml), and TNF-α protein (normal < 20 pg/ml) measured in the plasma of COPA patients (n = 5 samples from five symptomatic patients and n = 2 samples from two asymptomatic carriers). The dotted lines indicate the normal values. Red lines depict median values.
Figure 2.
Figure 2.
Type I IFN is responsible for the constitutive induction of ISGs in COPA syndrome. (A) Flow cytometry analysis of phosphorylated STAT1 (pSTAT1) in monocytes, CD3+, CD4+, and CD8+ lymphocytes from F2.P1 compared with a HC. (B) pSTAT1 measured as in A in CD3+, CD4+, and CD8+ lymphocytes (Ly) and CD14+ monocytes (Mo) from COPA patients compared with a HC sampled the same day, and expressed as fold mean fluorescence intensity (MFI) of over that of the HC. Blood from F3.P1 and F3.P3 was processed during the same experiment and compared with one HC. Data were statistically analyzed using the Mann–Whitney test (*, P < 0.05; ns, not significant). (C and D) RT-qPCR gene expression analysis in PBMCs from three patients (F2.P1, F3.P1, and F3.P3), after overnight culture in the absence of treatment or presence of ruxolitinib (C) or BX795 (D). Results are expressed as percentage of the baseline elevated levels and show that IFIT1, IFI27, IFI44L, ISG15, OAS1, and RSAD2 levels decreased after in vitro treatment (except IFI27 in F2.P1) for both drugs. Data were statistically analyzed using a one-sample t test (*, P < 0.05).
Figure 3.
Figure 3.
COPA mutants induce IFN production and signaling through STING. (A) Western blot analysis of FLAG, IRF3 phosphorylated (pIRF3) at Ser396, total IRF3, STING, and Cofilin in whole-cell lysates of HEK293T cells cotransfected with WT STING and WT COPA or mutant COPA plasmids (K230N, D243N, D243G) or corresponding control (EV or −) plasmids for 48 h. Representative results from four independent experiments. (B) Quantification of phosphorylated IRF3 (at position Ser396) relative to total IRF3 expressed as fold over EV signal as observed in A. Mean ± SEM of four independent experiments, analyzed with the Kruskal–Wallis test (**, P= 0.0069). (C and D) mRNA expression analysis assessed by RT-qPCR of IFNβ, IFNλ1 (C), and two ISGs (ISG15, RSAD2; D) in HEK293T cotransfected with EV or WT STING and WT COPA or mutant COPA plasmids. Means ± SEM of five independent experiments, statistically analyzed using two-way ANOVA and the Dunnett’s multiple comparisons test (statistics above black lines), with results above each bar indicating the comparison of expression in cells cotransfected with WT STING and each of the three COPA mutant plasmids compared with the cells cotransfected with EV and the corresponding COPA mutant plasmid by two-way ANOVA with Sidak’s multiple comparisons test (*, P < 0.05; **, P < 0.01; ***, P < 0.001; ns, not significant). (E) RT-qPCR gene expression analysis of IFNβ (type I IFN), IFNλ1 (type III IFN), and IFNγ (type II IFN) in PBMCs from one symptomatic patient (F4.P1) and his asymptomatic mother (F4.P3), and one HC, after overnight culture in one experiment. (F) Western blot analysis of HEK293T cotransfected with WT STING and WT COPA or mutant COPA plasmids (K230N, R233H, D243G) or EV (−) as in A. Representative results for three experiments. Results were quantified for R233H mutant compared with WT and averaged below. Data were statistically analyzed using two-way ANOVA with Sidak’s test for multiple comparison (*, P < 0.05). (G and H) mRNA expression analysis assessed by RT-qPCR of IFNβ, IFNλ1 (G), and two ISGs (ISG15, RSAD2; H) in HEK293T cotransfected with EV or WT STING and WT COPA or COPA R233H plasmids. Means ± SEM of three independent experiments, statistically analyzed using two-way ANOVA and Sidak’s multiple comparisons test (*, P < 0.05).
Figure 4.
Figure 4.
Loss of COPA induces STING-dependent type I IFN signaling. (A) Western blot analysis of IRF3 phosphorylated at Ser396, total IRF3, COPA, STING, and Cofilin in whole-cell lysates of control (Ctrl) or STING KO THP-1 cells transduced with an EV, a scrambled shRNA or an shRNA targeting COPA (shCOPA_1), or non-transduced (NT; left). Data are representative of three independent experiments. Asterisk indicates unspecific band. Results for a second shRNA targeting COPA (shCOPA_2) are shown in Fig. S2, A and B. (B) Quantification of phosphorylated IRF3 (at position Ser396) relative to total IRF3 expressed as fold over scrambled shRNA signal observed in A. Means ± SEM of three independent experiments were statistically analyzed using one-way ANOVA and two-way ANOVA with Sidak’s multiple comparisons test for comparison of results with shScramble vs. shCOPA_1 (**, P = 0.0026) and results in control vs. STING KO THP-1 cells for shCOPA_1 (*, P = 0.0104), respectively. (C and D) mRNA expression analysis assessed by RT-qPCR of IFNβ (C) and two of six tested ISGS (ISG15, RSAD2, [D]; and see Fig. S2 B) in control or STING KO THP-1 cells transduced with an EV, a scrambled shRNA, two different shRNAs targeting COPA (shCOPA_1 and shCOPA_2), or nontransduced (NT). Means ± SEM of three independent experiments, statistically analyzed using one-way ANOVA and two-way ANOVA with Sidak’s multiple comparisons test for comparison of results with shScramble vs. each shCOPA, and results in control vs. STING KO THP-1 cells for each shCOPA, respectively. **, P < 0.01; ***, P < 0.001; ****, P < 0.0001. (E and F) mRNA expression analysis assessed by RT-qPCR of IFNβ in WT or THP-1 cells null for cGAS (E) or MAVS (F) transduced with an EV, a scrambled shRNA, or two different shRNAs targeting COPA (shCOPA_1 and shCOPA_2). Means ± SEM of three independent experiments, statistically analyzed using one-way ANOVA and two-way ANOVA with Sidak’s multiple comparisons test for comparison of results with shScramble vs. each shCOPA, and results in WT vs. cGAS KO THP-1 cells for each shCOPA, respectively. *, P < 0.05; **, P < 0.01; ***, P < 0.001). (G) mRNA expression of COPA assessed by RT-qPCR in THP-1 cells control and null for STING (left), or WT and null for cGAS (middle) or MAVS (right) transduced with an EV, a scrambled shRNA, or shCOPA_1 and shCOPA_2. Mean ± SEM of three independent experiments were statistically analyzed in one-way ANOVA (shScramble vs. shCOPA for WT and control THP-1 cells) or two-way ANOVA (WT or control vs. THP-1 cells null for STING, cGAS, or MAVS, for each shCOPA) with Sidak’s multiple comparisons test: *, P <0.05; **, P < 0.01; ***, P < 0.001; ****, P < 0.0001. ns, not significant.
Figure S2.
Figure S2.
Knockdown of COPA induces STING-dependent, MAVS-independent type I IFN signaling in THP-1 cells. (A) Left: Western blot analysis of IRF3 phosphorylated at Ser396, total IRF3, COPA, STING, and Cofilin in whole-cell lysates of control or STING KO THP-1 cells transduced with an EV, a scrambled shRNA, or two different shRNAs targeting COPA (shCOPA_1 and shCOPA_2, respectively lanes 5 and 6, and lanes 7 and 8), or nontransduced (NT). Data are representative of three independent experiments. Asterisk indicates unspecific band. Right: Quantification of phosphorylated IRF3 (at position Ser396) relative to total IRF3 expressed as fold over scrambled shRNA relative signal, statistically analyzed in one-way ANOVA (shScramble vs. shCOPA for control THP-1 cells; **, P = 0.0026 for shCOPA_1 and **, P = 0.004 for shCOPA_2) or two-way ANOVA (control vs. STING KO THP-1 cells for each shCOPA; *, P = 0.0104 for shCOPA_1 and **, P = 0.0094 for shCOPA_2) with Sidak’s multiple comparisons test (mean ± SEM). (B) mRNA expression analysis assessed by RT-qPCR of four out of six tested ISGS (IFI27, IFI44L, IFIT1, and SIGLEC1; see other results in Fig. 4 D) in control or STING KO THP-1 cells transduced with an EV, a scrambled shRNA, or shCOPA_1 and shCOPA_2. Mean ± SEM of three independent experiments were statistically analyzed in one-way ANOVA (shScramble vs. shCOPA for control THP-1 cells) or two-way ANOVA (control vs. STING KO THP-1 cells for each shCOPA) with Sidak’s multiple comparisons test (*, P <0.05; **, P < 0.01; ***, P < 0.001; ****, P < 0.0001; ns, not significant). (C and D) mRNA expression analysis assessed by RT-qPCR of two ISGs (IFI27, IFI44L; D) in WT or THP-1 cells null for cGAS or MAVS transduced with an EV, a scrambled shRNA, or shCOPA_1 and shCOPA_2. Mean ± SEM of three independent experiments were statistically analyzed in one-way ANOVA (shScramble vs. shCOPA for WT THP-1 cells) or two-way ANOVA (WT vs. MAVS KO THP-1 cells for each shCOPA) with Sidak’s multiple comparisons test (ns, nonsignificant). (E and F) mRNA expression analysis assessed by RT-qPCR of IFNβ and two ISGS (IFI27, IFI44L) in control or THP-1 cells null for STING, cGAS, or MAVS and nonstimulated (NS) or stimulated with 1 µg/ml poly(I:C), 1 µg/ml 2′3′cGAMP, or 0.25 µg/ml HT-DNA for 24 h combined with Lipofectamine (Lipo). Mean ± SEM of two (poly[I:C]) to three (cGAMP, HT-DNA) independent experiments. (G) Western Blot analysis of cGAS, STING, and MAVS expression in THP-1 WT, STING, cGAS, or MAVS KO, and loading control Vinculin. Representative of two independent experiments. Ctrl, control.
Figure 5.
Figure 5.
Interaction of COPA and STING and STING localization. (A) Location of pathogenic missense mutations within the structure of the COPA WD-repeat domain (PDB ID: 6PBG). The four mutations studied in this report are shown in red, while two further previously identified mutations are indicated in magenta. Location of the pathogenic missense mutations within the structure of the COPI coat leaf is given in Fig. S3 B. (B) Western blot analysis of FLAG and STING in proteins IP with an antibody against FLAG (IP COPA, left) or STING (right), and in whole-cell lysates (input) of HEK293T cells cotransfected with EV (−) or WT STING and WT COPA plasmids. Data are representative of three independent experiments. (C) Western blot analysis of FLAG, STING, and β-actin in proteins IP with an antibody against FLAG (IP COPA) and whole-cell lysates (input) of HEK293T cells cotransfected with EV (EV or −) or WT STING and WT COPA, or with individual mutant COPA plasmids (K230N, D243N, D243G) or with a plasmid carrying three substitutions (3M: K230N/R233H/D243N). Data are representative of three independent experiments. (D) Quantification of STING protein levels co-immunoprecipitated (STING IP) with COPA-FLAG compared with the signal recorded in the input, as observed in C. Mean ± SEM of three independent experiments were statistically analyzed using Kruskal–Wallis test (*, P < 0.05). (E) Representative images of STING and COPA localization in HEK293FT cells transfected with WT, mutant COPA (3M carrying three substitutions: K230N/R233H/D243N), and STING plasmids or corresponding control plasmids (−), and transfected with cGAS or control plasmid the next day. Cells were fixed and stained for nuclear DNA (DAPI; blue), COPA (FLAG; gray), Golgi (GM130; green), and STING (magenta). “Merge” row shows an overlay of DAPI, GM130, and STING signals, GM130 and STING costaining being represented in white. “Merge (zoom)” depicts an enlargement of the square above. Images are representative of three independent experiments. Scale bar, 10 µm. (F) Quantification of the ratio of STING signal localized to the GM130/Golgi compartment over total STING signal in images as in A, for at least 10 cells per condition per experiment (one-way ANOVA with Dunnett’s correction: ****, P < 0.0001). ns, not significant. (G) Left: DNA from pathogens and damaged cells induces the production of cGAMP by cGAS. Upon binding of cGAMP, STING translocates, in a COPII-dependent process, to the ERGIC and Golgi, where it triggers TBK1 and IRF3 phosphorylation and subsequent IFN production. We hypothesize that COPA, within the COPI complex, plays a role in STING trafficking after signaling, taking STING back to the ER, or on to endolysosomes/the autophagy pathway (Gonugunta et al., 2017), and thereby leading to resolution of IFN signaling. Our data indicate that STING may be a cargo of COPI through COPA. Right: When COPA is mutated in the cargo-binding WD40 domain, STING can no longer be sorted into COPI vesicles, and so is retained in the ERGIC/Golgi in an active state, leading to continued IFN production. COP, coatomer protein; IB, immunoblot.
Figure S3.
Figure S3.
COPI complex and physical interaction of COPA and STING. (A) Location of pathogenic COPA mutations within the structure of the COPI coat leaf (PDB ID: 5NZR). The four mutations from this study are shown in red, and two previously reported mutations are shown in magenta. (B) Predicted effects of pathogenic mutations and putatively benign substitutions present in the gnomAD database on protein stability, calculated with FoldX. (C) Schematic representation of WT STING and truncated STING plasmids (i.e., Δ1-82, Δ83-136, Δ1-136, and 342stop). (D) Western blot analysis of FLAG, STING, and Cofilin in proteins IP with an antibody against FLAG (IP COPA), and whole-cell lysates (input) of HEK293T cells cotransfected with EV (EV or −), or WT COPA and WT STING, or truncated STING plasmids, i.e., Δ1-82, Δ83-136, and 342stop (data representative of three independent experiments). (E) Western blot analysis as in F of proteins IP with an antibody against FLAG (IP COPA), and whole-cell lysates (input) of HEK293T cells cotransfected with EV (EV or −), or WT COPA and WT STING, STING Δ1-136 (data representative of two independent experiments). (F) Western blot analysis of FLAG, STING, STIM1, and Cofilin in proteins IP with an antibody against FLAG and in whole-cell lysates (input) of HEK293T cells cotransfected with EV (−) or WT STING and WT COPA plasmids and with a scrambled siRNA or an siRNA pool targeting STIM1. Results are representative of three independent experiments. (G) Quantification of STIM1 silencing assessed by mRNA (left) and protein (right) levels measured, respectively, by RT-qPCR and Western blot 72 h after transfection. Error bars represent SDs. Results are representative of three independent experiments. CTT, C-terminal tail.

Comment in

  • COPA silences STING.
    Rivara S, Ablasser A. Rivara S, et al. J Exp Med. 2020 Nov 2;217(11):e20201517. doi: 10.1084/jem.20201517. J Exp Med. 2020. PMID: 32991673 Free PMC article.

References

    1. Arakel E.C., and Schwappach B.. 2018. Formation of COPI-coated vesicles at a glance. J. Cell Sci. 131 jcs209890 10.1242/jcs.209890 - DOI - PubMed
    1. Boulisfane-El Khalifi S., Viel S., Lahoche A., Frémond M.-L., Lopez J., Lombard C., Dubos F., Reumaux H., Gnemmi V., Legendre M., et al. . 2019. COPA syndrome as a cause of lupus nephritis. Kidney Int. Rep. 4:1187–1189. 10.1016/j.ekir.2019.04.014 - DOI - PMC - PubMed
    1. Brandizzi F., and Barlowe C.. 2013. Organization of the ER-Golgi interface for membrane traffic control. Nat. Rev. Mol. Cell Biol. 14:382–392. 10.1038/nrm3588 - DOI - PMC - PubMed
    1. Briand C., Frémond M.-L., Bessis D., Carbasse A., Rice G.I., Bondet V., Duffy D., Chatenoud L., Blanche S., Crow Y.J., et al. . 2019. Efficacy of JAK1/2 inhibition in the treatment of chilblain lupus due to TREX1 deficiency. Ann. Rheum. Dis. 78:431–433. 10.1136/annrheumdis-2018-214037 - DOI - PubMed
    1. Burdette D.L., Monroe K.M., Sotelo-Troha K., Iwig J.S., Eckert B., Hyodo M., Hayakawa Y., and Vance R.E.. 2011. STING is a direct innate immune sensor of cyclic di-GMP. Nature. 478:515–518. 10.1038/nature10429 - DOI - PMC - PubMed

Publication types

MeSH terms