. 2021 Feb;78(4):1637-1653.
doi: 10.1007/s00018-020-03601-z. Epub 2020 Jul 28.

Polysialic acid and Siglec-E orchestrate negative feedback regulation of microglia activation

Affiliations

Polysialic acid and Siglec-E orchestrate negative feedback regulation of microglia activation

Hauke Thiesler et al. Cell Mol Life Sci. 2021 Feb.

Abstract

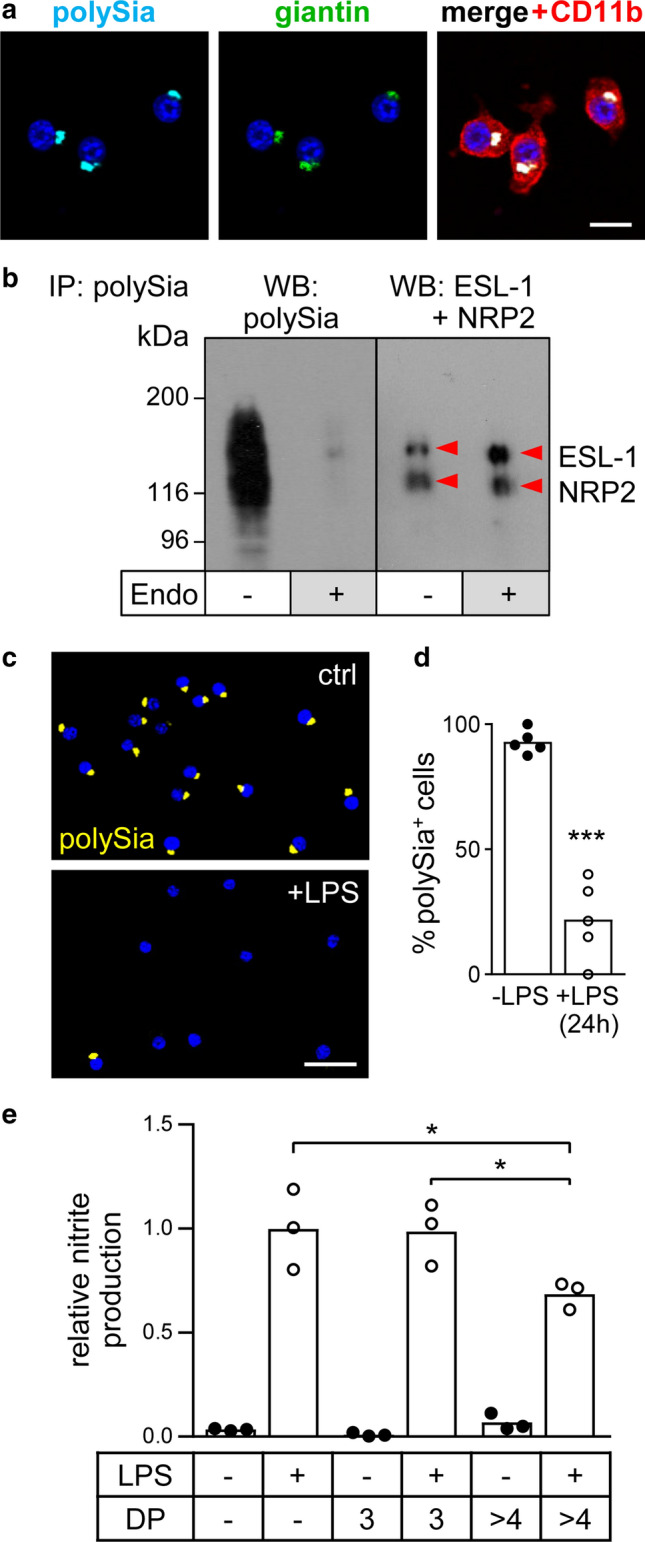
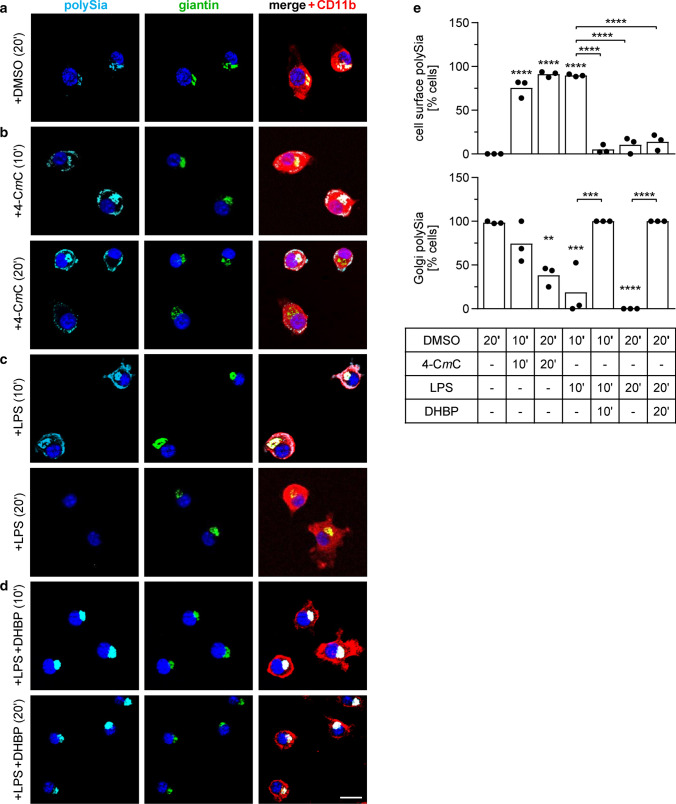
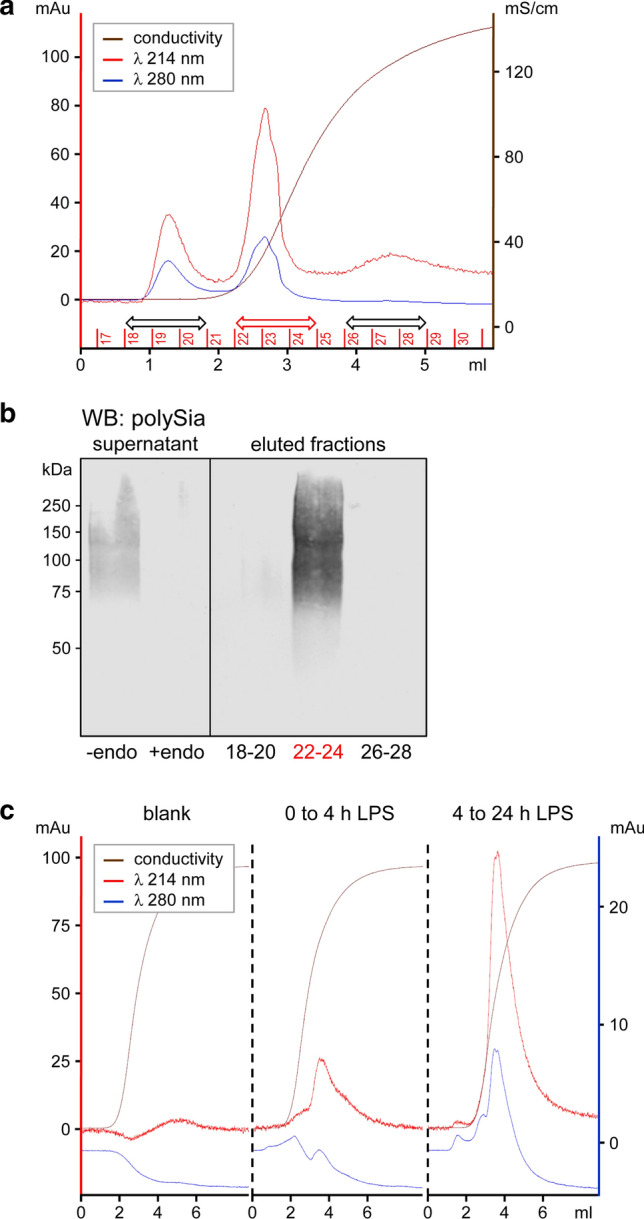
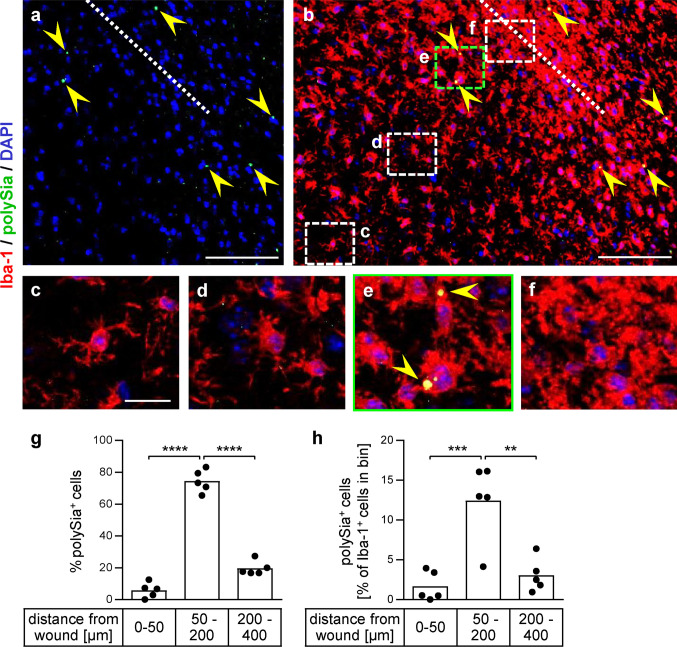
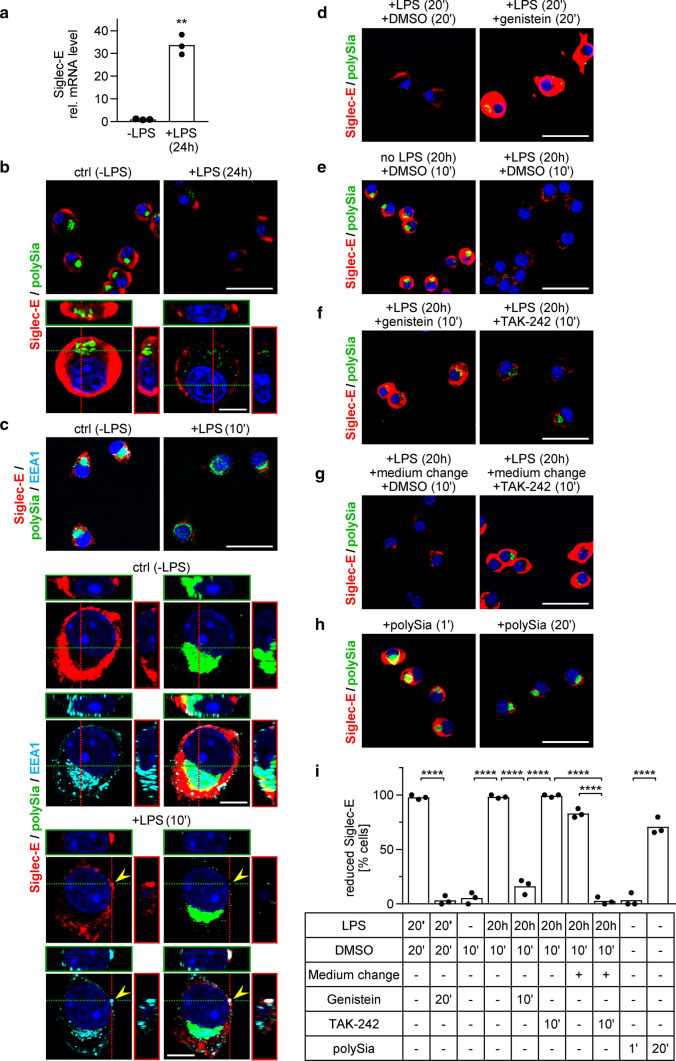
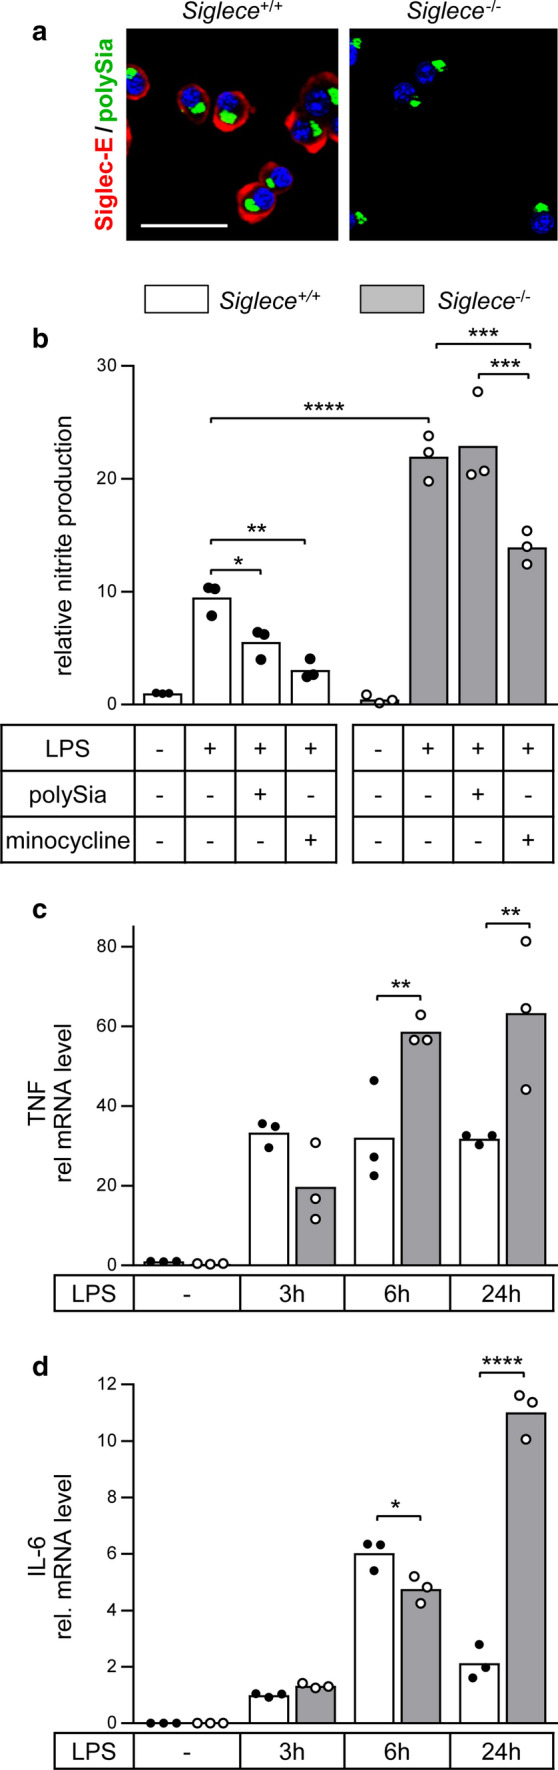
Polysialic acid (polySia) emerges as a novel regulator of microglia activity. We recently identified polysialylated proteins in the Golgi compartment of murine microglia that are released in response to inflammatory stimulation. Since exogenously added polySia is able to attenuate the inflammatory response, we proposed that the release of polysialylated proteins constitutes a mechanism for negative feedback regulation of microglia activation. Here, we demonstrate that translocation of polySia from the Golgi to the cell surface can be induced by calcium depletion of the Golgi compartment and that polysialylated proteins are continuously released for at least 24 h after the onset of inflammatory stimulation. The latter was unexpected, because polySia signals detected by immunocytochemistry are rapidly depleted. However, it indicates that the amount of released polySia is much higher than anticipated based on immunostaining. This may be crucial for microglial responses during traumatic brain injury (TBI), as we detected polySia signals in activated microglia around a stab wound in the adult mouse brain. In BV2 microglia, the putative polySia receptor Siglec-E is internalized during lipopolysaccharide (LPS)-induced activation and in response to polySia exposure, indicating interaction. Correspondingly, CRISPR/Cas9-mediated Siglec-E knockout prevents inhibition of pro inflammatory activation by exogenously added polySia and leads to a strong increase of the LPS response. A comparable increase of LPS-induced activation has been observed in microglia with abolished polySia synthesis. Together, these results indicate that the release of the microglia-intrinsic polySia pool, as implicated in TBI, inhibits the inflammatory response by acting as a trans-activating ligand of Siglec-E.

Keywords: Immune balance; Inflammatory activation; Innate immune response; Sialic acid-binding immunoglobulin-like lectins; Traumatic brain injury.


Conflict of interest statement

The authors declare that they have no conflict of interest.

Figures

Fig. 1
Fig. 1
Validation of polySia expression and polysialylated proteins in BV2 microglia. a Immunofluorescence staining of polySia co-localized with the Golgi marker giantin. Cell shape is highlighted by co-staining with the microglia/macrophage marker CD11b. Nuclei were counterstained with DAPI (blue). Scale bar, 20 µm. b Immunoprecipitation (IP) of polysialylated proteins from lysate of 107 BV2 cells using polySia-specific mAb 735-conjugated magnetic beads followed by Western blot (WB) detection with polySia-specific antibody (left), or by joint incubation with NRP2- and ESL-1-specific antibodies (right). Where indicated, IP fractions were treated with endosialidase (endo +), to remove polysialic acid. Protein bands were assigned according to the apparent molecular weights of NRP2 and ESL-1 as previously detected in primary and stem cell-derived murine microglia or in mouse brain tissue [; see text for details]. c Compared to untreated controls (ctrl), incubation of BV2 cultures with 1-µg/ml LPS for 24 h leads to the loss of polySia signals in almost all cells. Nuclei were counterstained with DAPI (blue). Scale bar, 50 µm. d Loss of polySia-positive cells after LPS treatment, as indicated. Individual values and means of 5 evaluated frames per culture condition, with a minimum of 20 cells each are plotted and significant difference by two-tailed t-test is indicated (*** p < 0.001). e PolySia with DP > 4 but not trisialic acid (DP3) attenuates the LPS-induced production of NO. Nitrite levels in the supernatant of BV2 cells cultured for 24 h in the presence or absence of 30-nM trisialic acid (DP3), 500-ng/ml poly—Sia (approximately 30 nM, see text for details), and/or 1-µg/ml LPS, as indicated. Individual values and means from 3 independent treatments per group are plotted. One-way ANOVA indicated significant differences (p < 0.0001) and results from Tukey’s post hoc test are shown for comparisons between the LPS-treated groups (*p < 0.05)
Fig. 2
Fig. 2
PolySia staining patterns in BV2 cells treated for 10 or 20 min with 1-µl/ml DMSO (a), 50-µM RyR agonist 4-CmC (b), 1-µg/ml LPS (c), or 1-µg/ml LPS together with 10-µM RyR antagonist DHBP (d), and quantitative assessment (e), as indicated. Per well, a minimum of 10 cells in 3 randomly selected frames with at least 3 cells each were evaluated and percentages of cells with detectable polySia signals at the cell surface (upper graph) or co-localized with the Golgi marker giantin (lower graph) were calculated. Individual values and means of 3 wells per condition are plotted. For each data set, one-way ANOVA indicated significant differences (p < 0.0001) and results from Tukey’s post hoc test are shown for comparisons against the DMSO control and for selected group comparisons (**p < 0.01, ***p < 0.001, ****p < 0.0001). 4-CmC and DHBP were added as 1-µl/ml stock solution in DMSO. Giantin and CD11b were co-stained to visualize the Golgi compartment and the cells’ shape, respectively. Nuclei were counterstained with DAPI (blue). Scale bar, 20 µm. See text for a description of treatment effects
Fig. 3
Fig. 3
Detection of polysialylated proteins released by LPS-induced BV2 microglia. a Elution profile of cell culture supernatants collected from 2.5 × 107 BV2 cells treated with 10-µg/ml LPS for 24 h and applied to immunoaffinity chromatography with polySia-specific antibody. The increase of conductivity (brown line) denotes the onset of elution with 2-M NaCl. Detection at 214 nm and 280 nm (red and blue line), indicative for the presence of sialic acid and protein, respectively, resulted in peaks during washing (fractions 18–20) and during elution (fractions 22–24). b Western blot detection of polysialylated protein in the cell culture supernatant prior to immunopurification (left panel) and in the pooled fractions 22–24, but not in fractions 18–20 and 26–28 of the chromatogram shown in a (right panel). Specificity of polySia detection in the supernatant was controlled by enzymatic removal of polySia with endosialidase (+ endo). c Elution profile of cell culture supernatants as in a, but collected from 3 × 107 BV2 cells during the first 4 h or, after changing the medium, between 4 and 24 h after the onset of LPS treatment, respectively. The left panel shows an elution profile without sample (blank)
Fig. 4
Fig. 4
PolySia-positive microglia in TBI. Immunofluorescence detection of polySia (green, marked by yellow arrowheads) and Iba-1 (red) one week after injury by an injection through the mouse cortex. a, b Overview of polySia signals around the wound channel (a), merged with Iba-1 staining (b). The wound channel is indicated by a dotted line. Nuclei were counterstained with DAPI (blue). cf Higher magnification views of the boxed areas highlighted in b. See text for a detailed description. Scale bars, 100 µm in a and b, 20 µm in c. g, h Quantitative assessment. Iba-1-positive cells with polySia-positive dots of at least 5 µm2 were counted in three bins at distances between 0 and 50, 50 and 200, 200 and 400 µm from the wound channel. A total of 134 polySia-positive cells were detected on sections of n = 5 lesioned brains [one section per brain evaluated, mean per section = 27 ± 8.4 (s.e.m)]. Distributions are shown in % of polySia-positive cells (g) and in % of all Iba-1-positive cells detected in the evaluated areas (h). Per bin, the individual values and means are plotted. Repeated measure one-way ANOVA indicated significant differences and results from Tukey’s post hoc test are shown (**p < 0.01, ***p < 0.001, ****p < 0.0001)
Fig. 5
Fig. 5
LPS-induced changes of Siglec-E in BV2 microglia. a Analysis by quantitative real-time RT-PCR reveals a strong increase of Siglec-E mRNA in cells treated with 1-µg/ml LPS for 24 h. Individual values and means from 3 independent treatments per group are plotted. **p < 0.01, unpaired t test. b Immunofluorescence detection of Siglec-E (red) and polySia (green). Nuclear counterstain with DAPI (blue). Staining patterns before (control, ctrl) and after treatment with 1-µg/ml LPS for 24 h. Lower panels show 3D reconstructions at higher magnification. c Colocalization of Siglec-E (red) and polySia (green) with the endosomal marker EEA1 (cyan). Staining patterns before (control, ctrl) and after treatment with 1-µg/ml LPS for 10 min. Lower panels show 3D reconstructions of single and merged channels with nuclear counterstain (DAPI, blue) at higher magnification. dh Detection of Siglec-E (red) and polySia (green) as in b. d Staining patterns after 20 min of LPS treatment in the presence of solvent (1-µl/ml DMSO, left) or 200-µM genistein (right). e, f Staining patterns after incubation for 20 h without or with LPS followed by 10 min with 1-µl/ml DMSO (e), 200-µM genistein, or 1-µM TAK-242 (f), as indicated. Genistein and TAK-242 were added as 1-µl/ml stock solution in DMSO. g Incubation of LPS-treated cells with DMSO and TAK-242 as in e and f, but this time the cell culture medium was changed to apply DMSO and TAK-242. h Staining patterns after incubation with polySia (10 µg/ml) for 1 min (left) or 20 min (right). The strong Siglec-E signals under control conditions without LPS (b, c, e, h) and after genistein treatment (d, f) are overexposed to enable a visualization of the weak signals in LPS-treated cells with the same camera setting. Scale bars, 50 µm in b and c (upper panels) and in dh; 10 µm in b and c, lower panels. i Quantitative assessment of reduced Siglec-E cell surface staining under the conditions shown in dh. Based on the densitometric evaluation of signal intensities of 108 cells treated for 10 min with DMSO in the absence of LPS, intensities below 50% of the mean Siglec-E signal intensity under these conditions were considered “reduced”. Per well, a minimum of 20 cells in 3 randomly selected frames with at least 5 cells each were evaluated and the percentage of cells with reduced Siglec-E immunoreactivity was calculated. Individual values and means of 3 wells per condition are plotted. One-way ANOVA indicated significant differences (p < 0.0001) and results from Tukey’s post hoc test are shown for selected comparisons (****p < 0.0001)
Fig. 6
Fig. 6
Loss of Siglec-E abrogates responsiveness to polySia and enhances LPS-induced activation. a Compared to wildtype BV2 cells (Siglece+/+), the immunoreactivity of Siglec-E (red), but not polySia (green) is abolished by CRISPR/spCas9-mediated knockout of Siglece (Siglece−/−, clone D19). Nuclear counterstain with DAPI (blue). Scale bar, 50 µm. b Comparable to the effect of preincubation with 60-µM minocycline for 2 h, application of polySia (5 µg/ml) inhibits the LPS-induced NO production of Siglece+/+ but not Siglece−/− BV2 microglia (clone D19). In addition, the LPS-induced NO production of Siglece−/− microglia was significantly higher. Where indicated (LPS +), 1-µg/ml LPS was applied for 24 h. c, d During 24 h of LPS treatment, Siglec-E-negative cells also showed a significantly more pronounced increase of TNF and IL-6 mRNA levels. In bd, individual values and means from n = 3 independent treatments per group are plotted. Mixed two-way ANOVA indicated significant differences and results from Holms–Sidak post hoc test are shown for selected group comparisons (*p < 0.05, **p < 0.01, ***p < 0.001, ****p < 0.0001)

References

    1. Varki A, Schnaar RL, Schauer R, et al. Sialic acids and other nonulosonic acids. In: Varki A, Cummings RD, Esko JD, et al., editors. Essentials of gycobiology. 3. Cold Spring Harbor (NY): Cold Spring Harbor Laboratory Press; 2017. pp. 179–195.
    1. Schnaar RL, Gerardy-Schahn R, Hildebrandt H. Sialic acids in the brain: gangliosides and polysialic acid in nervous system development, stability, disease, and regeneration. Physiol Rev. 2014;94(2):461–518. doi: 10.1152/physrev.00033.2013. - DOI - PMC - PubMed
    1. Rutishauser U. Polysialic acid in the plasticity of the developing and adult vertebrate nervous system. Nat Rev Neurosci. 2008;9(1):26–35. doi: 10.1038/nrn2285. - DOI - PubMed
    1. Werneburg S, Mühlenhoff M, Stangel M, Hildebrandt H. Polysialic acid on SynCAM 1 in NG2 cells and on neuropilin-2 in microglia is confined to intracellular pools that are rapidly depleted upon stimulation. Glia. 2015;63(7):1240–1255. doi: 10.1002/glia.22815. - DOI - PubMed
    1. Werneburg S, Buettner FF, Erben L, Mathews M, Neumann H, Mühlenhoff M, Hildebrandt H. Polysialylation and lipopolysaccharide-induced shedding of E-selectin ligand-1 and neuropilin-2 by microglia and THP-1 macrophages. Glia. 2016;64(8):1314–1330. doi: 10.1002/glia.23004. - DOI - PubMed

MeSH terms

LinkOut - more resources