

Pediatric cancer mortality and survival in the United States, 2001-2016
- PMID: 32725630
- PMCID: PMC9539939
- DOI: 10.1002/cncr.33080
Pediatric cancer mortality and survival in the United States, 2001-2016
Abstract
Background: Although pediatric cancer mortality and survival have improved in the United States over the past 40 years, differences exist by age, race/ethnicity, cancer site, and economic status. To assess progress, this study examined recent mortality and survival data for individuals younger than 20 years.
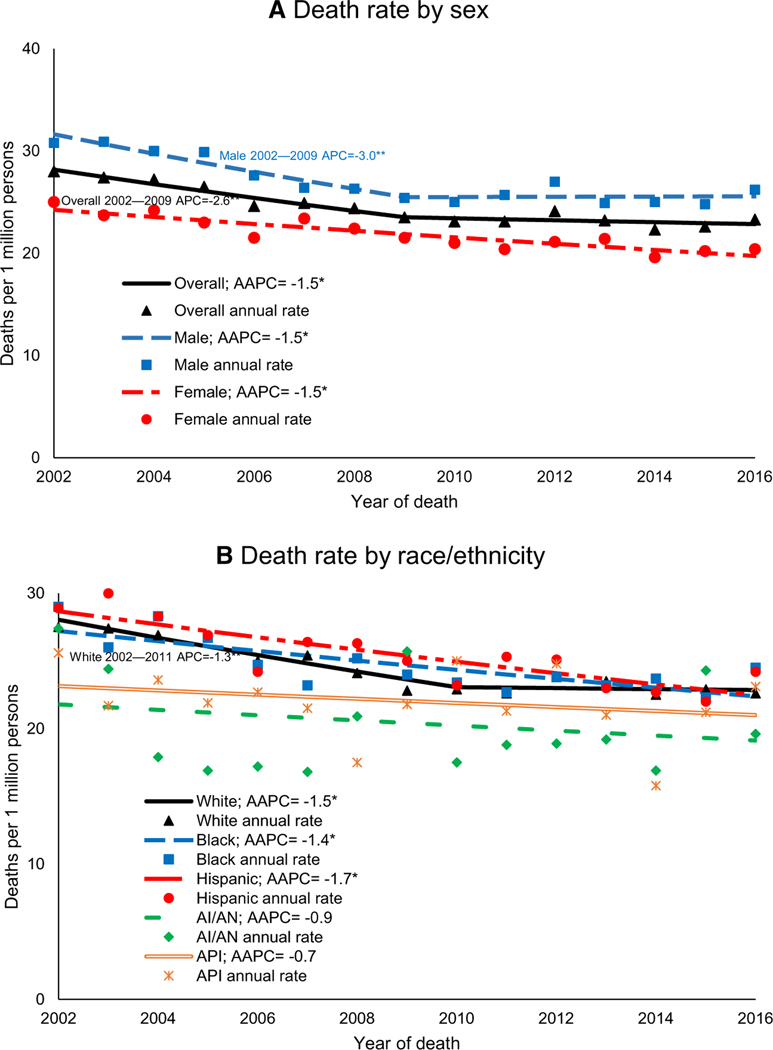
Methods: Age-adjusted death rates were calculated with the National Vital Statistics System for 2002-2016. Annual percent changes (APCs) and average annual percent changes (AAPCs) were calculated with joinpoint regression. Five-year relative survival was calculated on the basis of National Program of Cancer Registries data for 2001-2015. Death rates and survival were estimated overall and by sex, 5-year age group, race/ethnicity, cancer type, and county-based economic markers.
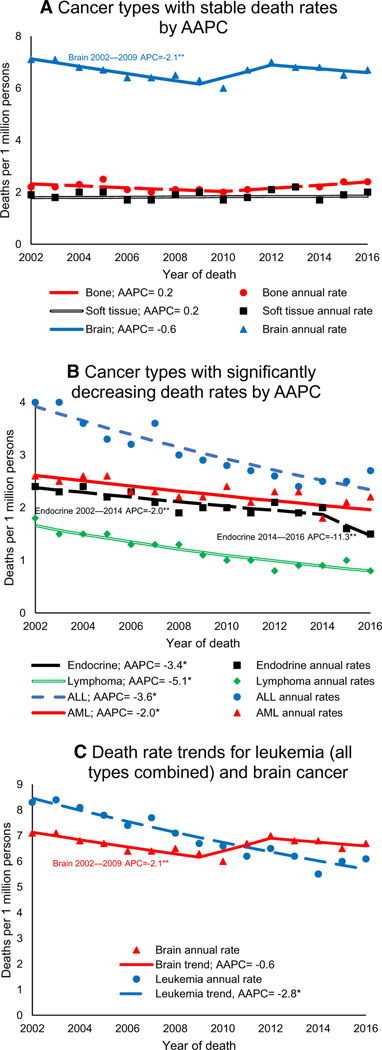
Results: Death rates decreased during 2002-2016 (AAPC, -1.5), with steeper declines during 2002-2009 (APC, -2.6), and then plateaued (APC, -0.4). Leukemia and brain cancer were the most common causes of death from pediatric cancer, and brain cancer surpassed leukemia in 2011. Death rates decreased for leukemia and lymphoma but were unchanged for brain, bone, and soft-tissue cancers. From 2001-2007 to 2008-2015, survival improved from 82.0% to 85.1%. Survival was highest in both periods among females, those aged 15 to 19 years, non-Hispanic Whites, and those in counties in the top 25% by economic status. Survival improved for leukemias, lymphomas, and brain cancers but plateaued for bone and soft-tissue cancers.
Conclusions: Although overall death rates have decreased and survival has increased, differences persist by sex, age, race/ethnicity, cancer type, and economic status. Improvements in pediatric cancer outcomes may depend on improving therapies, access to care, and supportive and long-term care.
Keywords: cancer; epidemiology; mortality; pediatric; survival.
© Published 2020. This article is a U.S. Government work and is in the public domain in the USA.
Conflict of interest statement
CONFLICT OF INTEREST DISCLOSURES
The authors made no disclosures.
Figures
References
-
- Ward E, DeSantis C, Robbins A, Kohler B, Jemal A. Childhood and adolescent cancer statistics, 2014. CA Cancer J Clin. 2014;64:83–103. - PubMed
-
- Oeffinger KC, Mertens AC, Sklar CA, et al. Chronic health conditions in adult survivors of childhood cancer. N Engl J Med. 2006;355:1572–1582. - PubMed
-
- Centers for Disease Control and Prevention. Trends in childhood cancer mortality—United States, 1990–2004. MMWR Morb Mortal Wkly Rep. 2007;56:1257–1261. - PubMed
Publication types
MeSH terms
Grants and funding
LinkOut - more resources
Full Text Sources
Medical
Miscellaneous
