

Fever Incidence Is Much Lower in the Morning than the Evening: Boston and US National Triage Data
- PMID: 32726264
- PMCID: PMC7390559
- DOI: 10.5811/westjem.2020.3.45215
Fever Incidence Is Much Lower in the Morning than the Evening: Boston and US National Triage Data
Abstract
Introduction: In this observational study, we evaluated time-of-day variation in the incidence of fever that is seen at triage. The observed incidence of fever could change greatly over the day because body temperatures generally rise and fall in a daily cycle, yet fever is identified using a temperature threshold that is unchanging, such as ≥38.0° Celsius (C) (≥100.4° Fahrenheit [F]).
Methods: We analyzed 93,225 triage temperature measurements from a Boston emergency department (ED) (2009-2012) and 264,617 triage temperature measurements from the National Hospital Ambulatory Medical Care Survey (NHAMCS, 2002-2010), making this the largest study of body temperature since the mid-1800s. Boston data were investigated exploratorily, while NHAMCS was used to corroborate Boston findings and check whether they generalized. NHAMCS results are nationally representative of United States EDs. Analyses focused on adults.
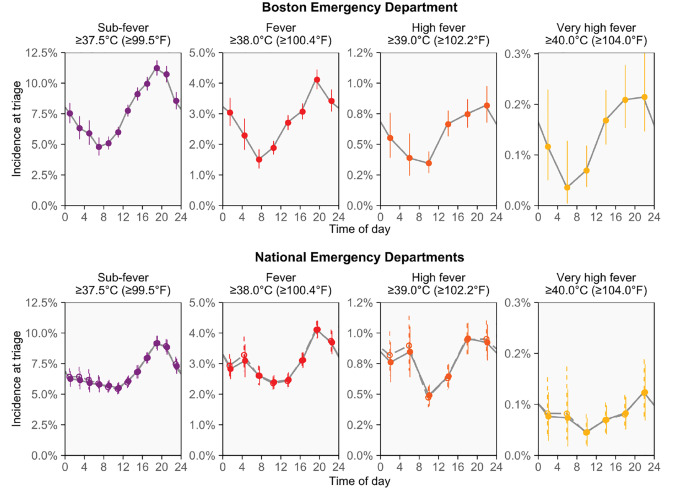
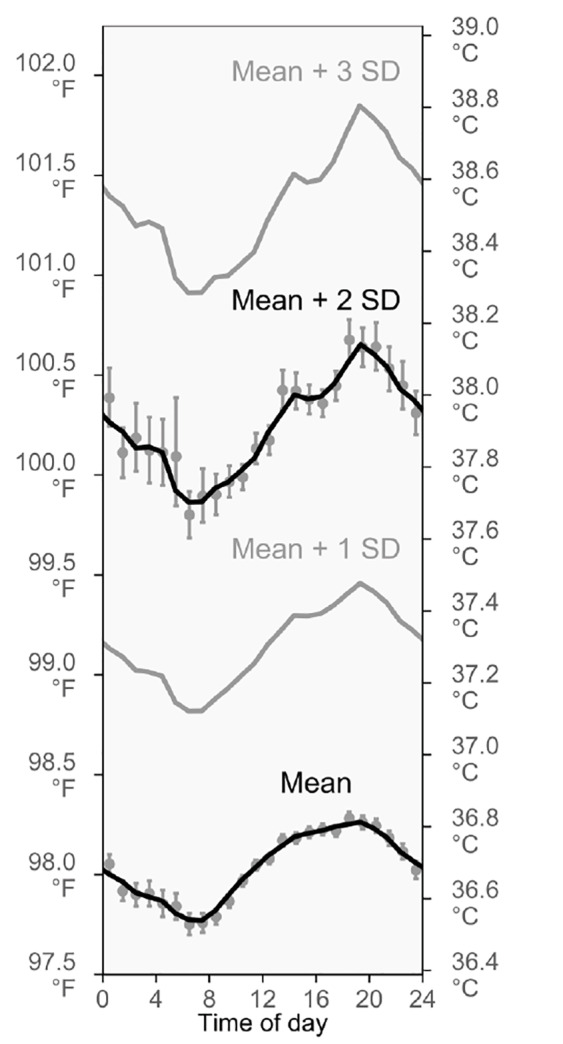
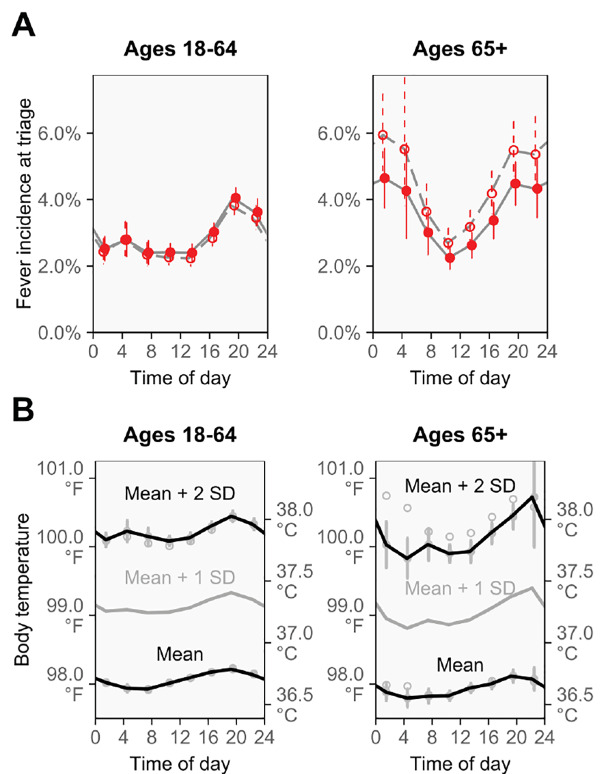
Results: In the Boston ED, the proportion of patients with triage temperatures in the fever range (≥38.0°C, ≥100.4°F) increased 2.5-fold from morning to evening (7:00-8:59 PM vs 7:00-8:59 AM: risk ratio [RR] 2.5, 95% confidence interval [CI], 2.0-3.3). Similar time-of-day changes were observed when investigating alternative definitions of fever: temperatures ≥39.0°C (≥102.2°F) and ≥40.0°C (≥104.0°F) increased 2.4- and 3.6-fold from morning to evening (7:00-8:59 PM vs 7:00-8:59 AM: RRs [95% CIs] 2.4 [1.5-4.3] and 3.6 [1.5-17.7], respectively). Analyses of adult NHAMCS patients provided confirmation, showing mostly similar increases for the same fever definitions and times of day (RRs [95% CIs] 1.8 [1.6-2.1], 1.9 [1.4-2.5], and 2.8 [0.8-9.3], respectively), including after adjusting for 12 potential confounders using multivariable regression (adjusted RRs [95% CIs] 1.8 [1.5-2.1], 1.8 [1.3-2.4], and 2.7 [0.8-9.2], respectively), in age-group analyses (18-64 vs 65+ years), and in several sensitivity analyses. The patterns observed for fever mirror the circadian rhythm of body temperature, which reaches its highest and lowest points at similar times.
Conclusion: Fever incidence is lower at morning triages than at evening triages. High fevers are especially rare at morning triage and may warrant special consideration for this reason. Studies should examine whether fever-causing diseases are missed or underappreciated during mornings, especially for sepsis cases and during screenings for infectious disease outbreaks. The daily cycling of fever incidence may result from the circadian rhythm.
Conflict of interest statement
Figures
Similar articles
-
Human temperatures for syndromic surveillance in the emergency department: data from the autumn wave of the 2009 swine flu (H1N1) pandemic and a seasonal influenza outbreak.BMC Emerg Med. 2016 Mar 9;16:16. doi: 10.1186/s12873-016-0080-7. BMC Emerg Med. 2016. PMID: 26961277 Free PMC article.
-
Contactless Vital Signs Acquisition Using Video Photoplethysmography, Motion Analysis and Passive Infrared Thermography Devices During Emergency Department Walk-In Triage in Pandemic Conditions.J Emerg Med. 2022 Jul;63(1):115-129. doi: 10.1016/j.jemermed.2022.06.001. Epub 2022 Aug 6. J Emerg Med. 2022. PMID: 35940984
-
NHAMCS Validation of Emergency Severity Index as an Indicator of Emergency Department Resource Utilization.West J Emerg Med. 2018 Sep;19(5):855-862. doi: 10.5811/westjem.2018.7.37556. Epub 2018 Aug 8. West J Emerg Med. 2018. PMID: 30202499 Free PMC article.
-
Emergency department triage prediction of clinical outcomes using machine learning models.Crit Care. 2019 Feb 22;23(1):64. doi: 10.1186/s13054-019-2351-7. Crit Care. 2019. PMID: 30795786 Free PMC article.
-
Temperature.In: Walker HK, Hall WD, Hurst JW, editors. Clinical Methods: The History, Physical, and Laboratory Examinations. 3rd edition. Boston: Butterworths; 1990. Chapter 218. In: Walker HK, Hall WD, Hurst JW, editors. Clinical Methods: The History, Physical, and Laboratory Examinations. 3rd edition. Boston: Butterworths; 1990. Chapter 218. PMID: 21250173 Free Books & Documents. Review.
Cited by
-
Feasibility and effectiveness of daily temperature screening to detect COVID-19 in a prospective cohort at a large public university.BMC Public Health. 2021 Sep 16;21(1):1693. doi: 10.1186/s12889-021-11697-6. BMC Public Health. 2021. PMID: 34530802 Free PMC article.
-
Spatio-temporal Differentiation in the Incidence of Influenza and Its Relationship with Air Pollution in China from 2004 to 2017.Chin Geogr Sci. 2021;31(5):815-828. doi: 10.1007/s11769-021-1228-2. Epub 2021 Sep 22. Chin Geogr Sci. 2021. PMID: 34580569 Free PMC article.
-
Temperature Measurement Timings and the Fever Detection Rate After Gastrointestinal Surgery: Retrospective Cross-Sectional Study.Interact J Med Res. 2024 Oct 9;13:e50585. doi: 10.2196/50585. Interact J Med Res. 2024. PMID: 39383527 Free PMC article.
-
So, what's best? Accuracy and acceptance of thermometers in triage and inpatients in a low-resource tropical setting - The MaTe study.Heliyon. 2024 Feb 6;10(3):e25806. doi: 10.1016/j.heliyon.2024.e25806. eCollection 2024 Feb 15. Heliyon. 2024. PMID: 38371989 Free PMC article.
References
-
- Dunlap JC, Loros JJ, DeCoursey PJ. Chronobiology: Biological Timekeeping. Sunderland, MA: Sinauer Associates, Inc; 2009.
-
- Dall L, Stanford JF. Fever, chills, and night sweats. In: Walker H, Hall W, Hurst J, editors. Clinical Methods: The History, Physical, and Laboratory Examinations. 3rd ed. Boston, MA: Butterworths; 1990. pp. 944–8.
-
- Del Bene VE. Temperature. In: Walker HK, Hall WD, Hurst JW, editors. Clinical Methods: The History, Physical, and Laboratory Examinations. 3rd ed. Boston, MA: Butterworths; 1990. pp. 990–3. - PubMed
-
- Musher DM, Fainstein V, Young EJ, et al. Fever patterns: their lack of clinical significance. Arch Intern Med. 1979;139(11):1225–8. - PubMed
-
- Mackowiak PA, Wasserman SS, Levine MM. A critical appraisal of 98.6 degrees F, the upper limit of the normal body temperature, and other legacies of Carl Reinhold August Wunderlich. JAMA. 1992;268(12):1578–80. - PubMed