

Brain regions vulnerable and resistant to aging without Alzheimer's disease
- PMID: 32726311
- PMCID: PMC7390259
- DOI: 10.1371/journal.pone.0234255
Brain regions vulnerable and resistant to aging without Alzheimer's disease
Abstract
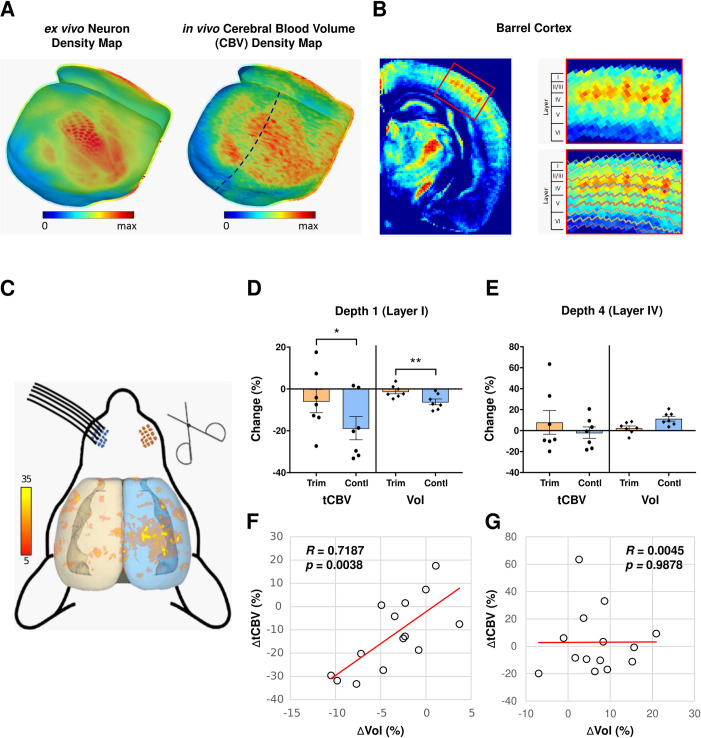
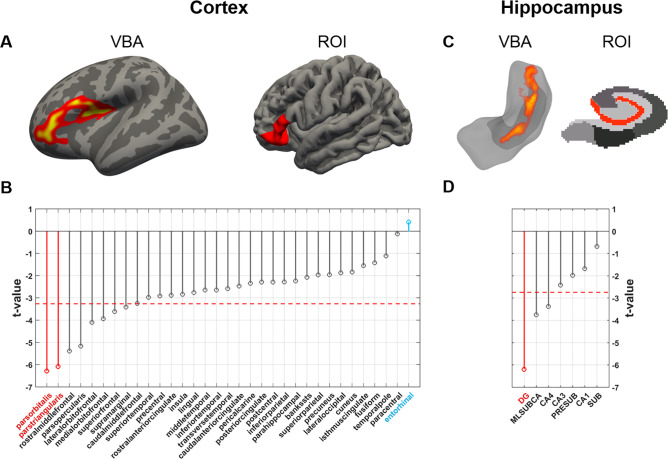
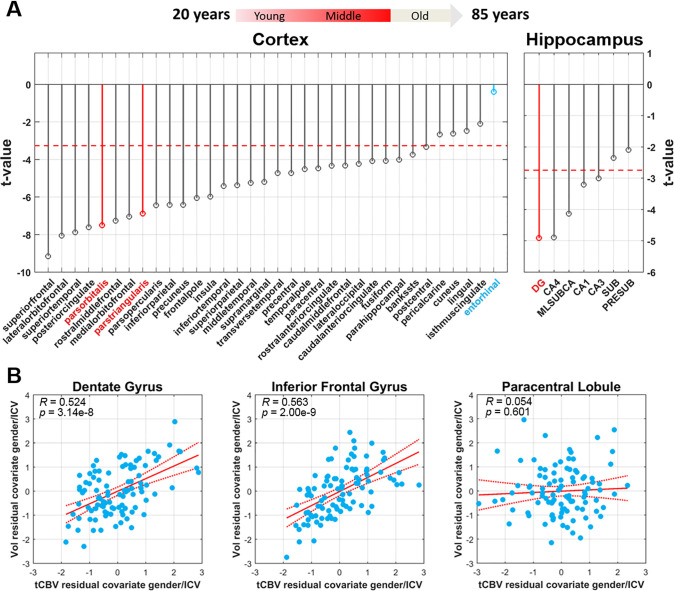
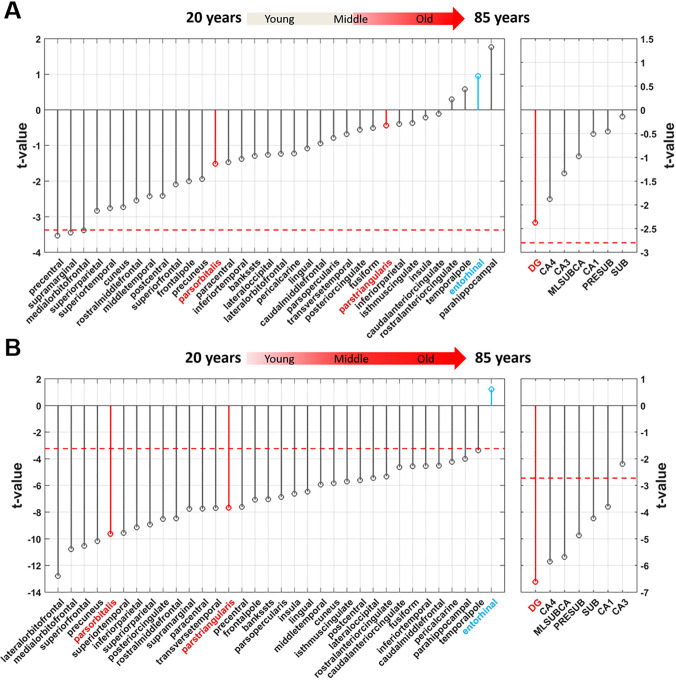
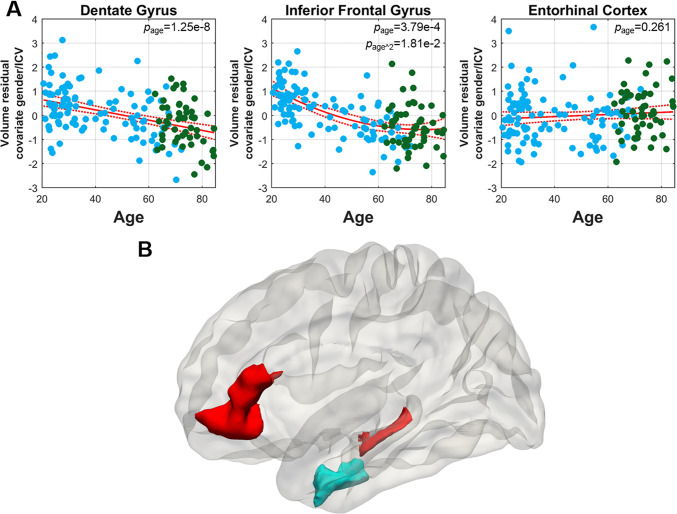
'Normal aging' in the brain refers to age-related changes that occur independent of disease, in particular Alzheimer's disease. A major barrier to mapping normal brain aging has been the difficulty in excluding the earliest preclinical stages of Alzheimer's disease. Here, before addressing this issue we first imaged a mouse model and learn that the best MRI measure of dendritic spine loss, a known pathophysiological driver of normal aging, is one that relies on the combined use of functional and structural MRI. In the primary study, we then deployed the combined functional-structural MRI measure to investigate over 100 cognitively-normal people from 20-72 years of age. Next, to cover the tail end of aging, in secondary analyses we investigated structural MRI acquired from cognitively-normal people, 60-84 years of age, who were Alzheimer's-free via biomarkers. Collectively, the results from the primary functional-structural study, and the secondary structural studies revealed that the dentate gyrus is a hippocampal region differentially affected by aging, and that the entorhinal cortex is a region most resistant to aging. Across the cortex, the primary functional-structural study revealed and that the inferior frontal gyrus is differentially affected by aging, however, the secondary structural studies implicated other frontal cortex regions. Together, the results clarify how normal aging may affect the brain and has possible mechanistic and therapeutic implications.
Conflict of interest statement
I have read the journal's policy and the authors of this paper have the following competing interests: FAP is a consultant for and has equity in Imij Technologies. SAS serves on the scientific advisory board of Meira GTX, recently came off the scientific advisory board of Denali Theraputics, and has equity in Imij Technologies. AMB is a scientific consultant to Cognition theraptueics, Keystone Heart, and MedAvante-ProPhase, and recently served on an advisory board for F. Hoffmann-La Roche and Keystone Heart. XF, FAP, SAS and AMB have either granted patents or applications in neuroimaging for which no royalties are received. This does not alter our adherence to PLOS ONE policies on sharing data and materials.
Figures
Similar articles
-
Hippocampal subfield volumes at 7T in early Alzheimer's disease and normal aging.Neurobiol Aging. 2014 Sep;35(9):2039-45. doi: 10.1016/j.neurobiolaging.2014.02.021. Epub 2014 Mar 3. Neurobiol Aging. 2014. PMID: 24684788
-
Functional interactions between entorhinal cortex and posterior cingulate cortex at the very early stage of Alzheimer's disease using brain perfusion single-photon emission computed tomography.Nucl Med Commun. 2006 Feb;27(2):151-6. doi: 10.1097/01.mnm.0000189783.39411.ef. Nucl Med Commun. 2006. PMID: 16404228
-
Neural substrates of cognitive reserve in Alzheimer's disease spectrum and normal aging.Neuroimage. 2019 Feb 1;186:690-702. doi: 10.1016/j.neuroimage.2018.11.053. Epub 2018 Nov 29. Neuroimage. 2019. PMID: 30503934
-
Innervation from the entorhinal cortex to the dentate gyrus and the vulnerability to Zn2.J Trace Elem Med Biol. 2016 Dec;38:19-23. doi: 10.1016/j.jtemb.2016.05.006. Epub 2016 May 24. J Trace Elem Med Biol. 2016. PMID: 27267970 Review.
-
A survey on applications and analysis methods of functional magnetic resonance imaging for Alzheimer's disease.J Neurosci Methods. 2019 Apr 1;317:121-140. doi: 10.1016/j.jneumeth.2018.12.012. Epub 2018 Dec 26. J Neurosci Methods. 2019. PMID: 30593787 Review.
Cited by
-
Aging-Related Alterations of Glymphatic Transport in Rat: In vivo Magnetic Resonance Imaging and Kinetic Study.Front Aging Neurosci. 2022 Mar 10;14:841798. doi: 10.3389/fnagi.2022.841798. eCollection 2022. Front Aging Neurosci. 2022. PMID: 35360203 Free PMC article.
-
[A review on the application of UK Biobank in neuroimaging].Sheng Wu Yi Xue Gong Cheng Xue Za Zhi. 2021 Jun 25;38(3):594-601. doi: 10.7507/1001-5515.202012059. Sheng Wu Yi Xue Gong Cheng Xue Za Zhi. 2021. PMID: 34180206 Free PMC article. Review. Chinese.
-
Sex-specific and cell-type-specific changes in chaperone-mediated autophagy across tissues during aging.Nat Aging. 2025 Apr;5(4):691-708. doi: 10.1038/s43587-024-00799-6. Epub 2025 Feb 5. Nat Aging. 2025. PMID: 39910244 Free PMC article.
-
Anatomical biology guides a search for nutrients for the aging brain.Mol Aspects Med. 2023 Feb;89:101154. doi: 10.1016/j.mam.2022.101154. Epub 2022 Nov 10. Mol Aspects Med. 2023. PMID: 36372583 Free PMC article. Review.
-
Pathological Nuclear Hallmarks in Dentate Granule Cells of Alzheimer's Patients: A Biphasic Regulation of Neurogenesis.Int J Mol Sci. 2022 Oct 25;23(21):12873. doi: 10.3390/ijms232112873. Int J Mol Sci. 2022. PMID: 36361662 Free PMC article.
References
Publication types
MeSH terms
Grants and funding
LinkOut - more resources
Full Text Sources
Medical
