. 2020 Oct;177(20):4645-4665.
doi: 10.1111/bph.15215. Epub 2020 Aug 20.

Small molecule-driven SIRT3-autophagy-mediated NLRP3 inflammasome inhibition ameliorates inflammatory crosstalk between macrophages and adipocytes

Affiliations

Small molecule-driven SIRT3-autophagy-mediated NLRP3 inflammasome inhibition ameliorates inflammatory crosstalk between macrophages and adipocytes

Tian Zhang et al. Br J Pharmacol. 2020 Oct.

Abstract

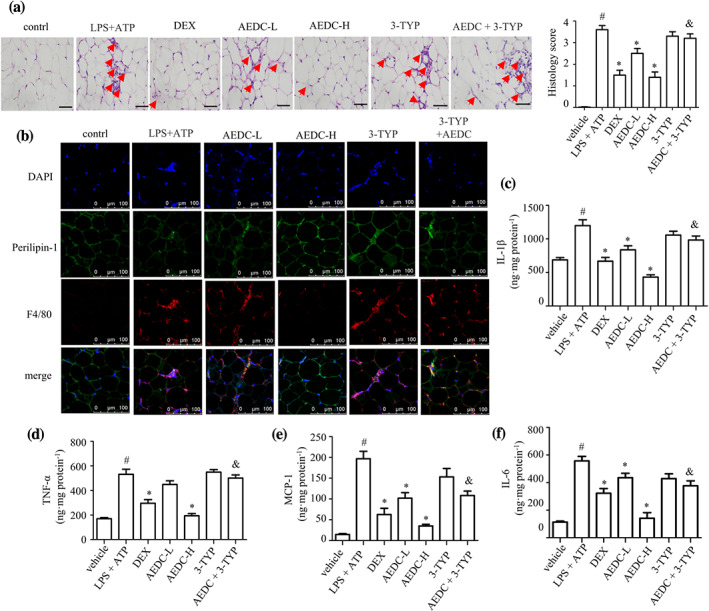
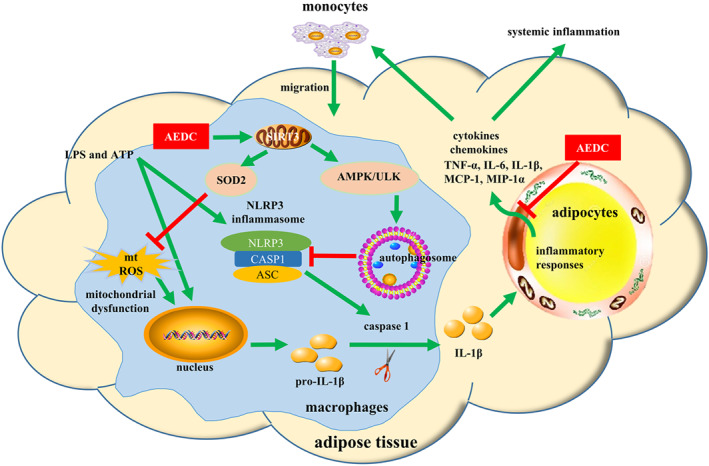
Background and purpose: IL-1β produced by macrophages via the NOD-, LRR- and pyrin domain-containing 3 (NLRP3) inflammasome, mediates the inflammatory crosstalk between macrophages and adipocytes. In our previous study, (16S,20S,24R)-12β-acetoxy-16,23-epoxy-24,25-dihydroxy-3β-(β-D-xylopyranosyloxy)-9,19-cyclolanost-22(23)-ene (AEDC), a cycloartane triterpenoid isolated from Actaea vaginata (Ranunculaceae), was found to possess anti-inflammatory effect on LPS-treated RAW264.7 macrophages. This study was designed to investigate whether AEDC modulates macrophage-adipocyte crosstalk to alleviate adipose tissue inflammation.

Experimental approach: The anti-inflammatory effect of AEDC was evaluated on LPS plus ATP-induced THP-1 macrophages and C57BL/6J mice. The expression of autophagy-related and NLRP3 inflammasome complex proteins was analysed by western blots, immunofluorescence staining and co-immunoprecipitation. The pro-inflammatory cytokines levels were determined by ELISA kits. The adipose tissue inflammation was evaluated by histological analysis and immunohistochemical staining.

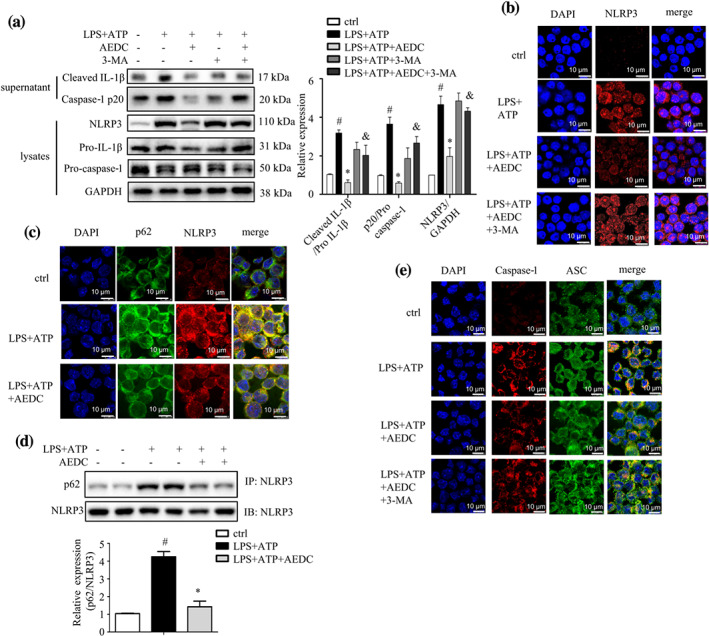
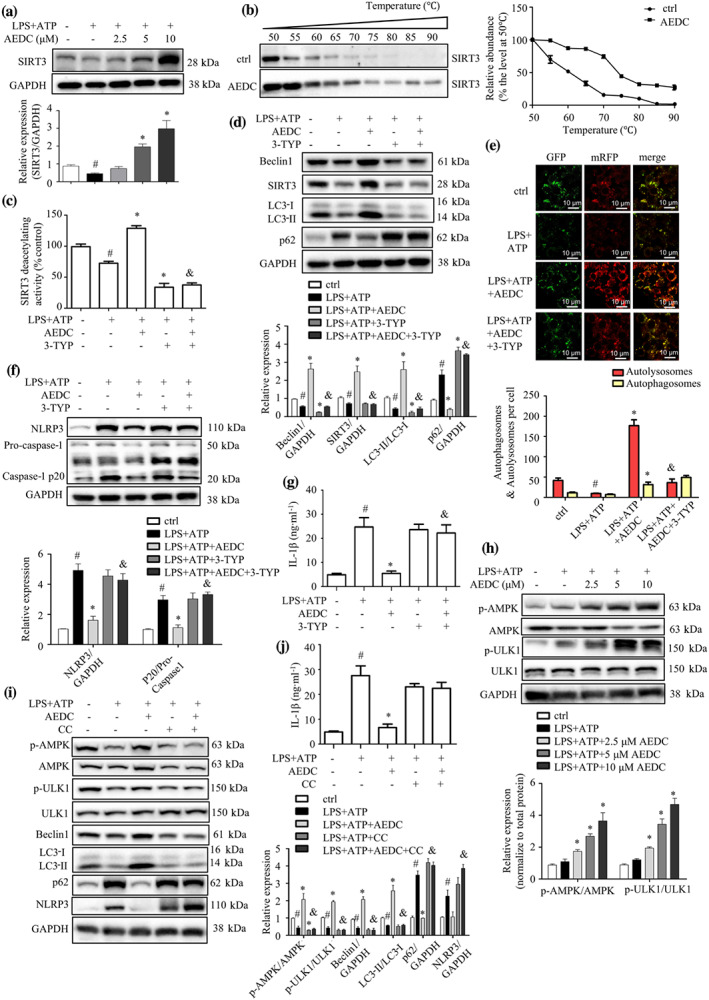
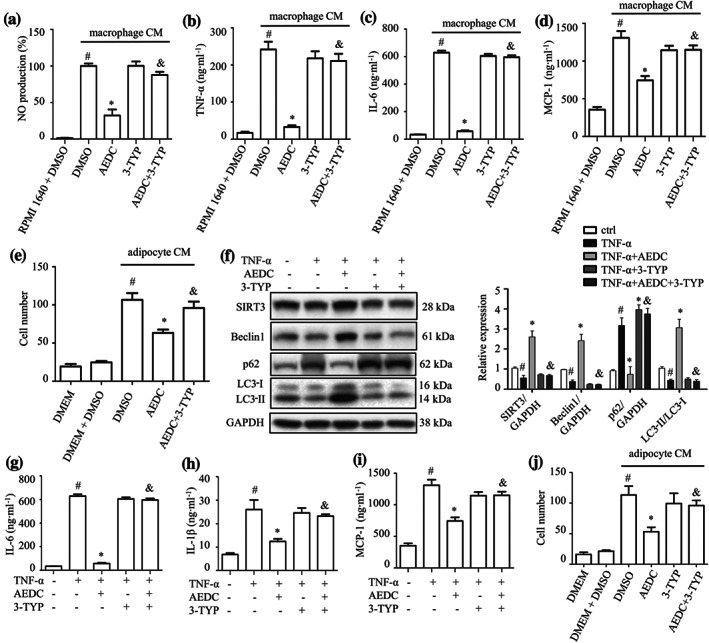
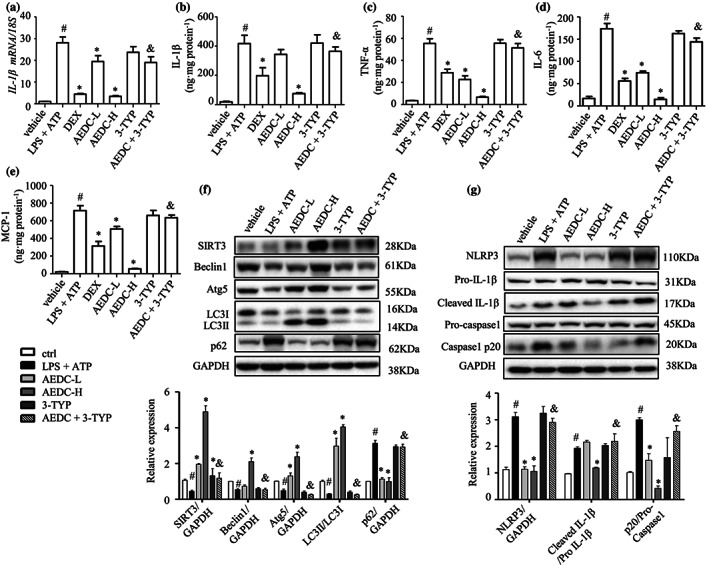
Key results: AEDC (5 and 10 μM) activated autophagy, which in turn suppressed the NLRP3 inflammasome activation and IL-1β secretion in THP-1 macrophages. AEDC increased the expression of SIRT3 deacetylase and enhanced its deacetylating activity to reverse mitochondrial dysfunction and activate AMP-activated protein kinase, which together induced autophagy. Moreover, AEDC (10 μM) attenuated macrophage conditioned medium-induced inflammatory responses in adipocytes and blocked THP-1 macrophages migration towards 3T3-L1 adipocytes. In inflammation mice, AEDC (5 and 20 mg·kg-1 ) treatment reduced the levels of pro-inflammatory cytokines in serum and epididymal adipose tissue and reduced macrophage infiltration to alleviate adipose tissue inflammation.

Conclusion and implications: AEDC attenuated the inflammatory crosstalk between macrophages and adipocytes through SIRT3-autophagy-mediated NLRP3 inflammasome inhibition, which might used for the treatment of adipose tissue inflammation-related metabolic disorders.

Keywords: IL-1β, macrophages; NLRP3 inflammasome; adipocytes; adipose tissue inflammation; autophagy; cycloartane triterpenoid.


Conflict of interest statement

The authors declare no conflicts of interest.

Figures

FIGURE 1
FIGURE 1
AEDC alleviated LPS plus ATP‐induced IL‐1β secretion in THP‐1 macrophages by restoring impaired autophagy. (a) The chemical structure of compound AEDC (16S,20S,24R)‐12β‐acetoxy‐16,23‐epoxy‐24,25‐dihydroxy‐3β‐(β‐D‐xylopyranosyloxy)‐9,19‐cyclolanost‐22(23)‐ene). THP‐1 cells were treated with or without different concentrations of AEDC for 12 h, followed by stimulation with LPS for 18 h and then ATP for 1 h. (b) Immunofluorescence staining of IL‐1β was performed (n = 5). Scale bar = 10 μm. (c) The level of IL‐1β in the culture medium from THP‐1 cells were determined by ELISA (n = 6). THP‐1 cells were treated with or without different concentrations of AEDC for 12 h, followed by stimulation with LPS for 4 h and then ATP for 1 h. (d) NLRP3 and Caspase‐1 in the lysates of THP‐1 cells were detected by Western blotting (n = 6). GAPDH was used as an internal loading control. Data were normalized to the mean value of the control group. (e) Expression of autophagy‐related proteins were detected by Western blotting (n = 6). GAPDH was used as an internal loading control. Data were normalized to the mean value of the control group. (f) THP‐1 cells were treated with or without 10 μM AEDC for 12 h and 5 mM 3‐MA for 6 h, followed by stimulation of LPS for 4 h and then ATP for 1 h. Expression of autophagy‐related proteins were detected by Western blotting (n = 6). GAPDH was used as an internal loading control. Data were normalized to the mean value of the control group. (g) THP‐1 cells were transiently infected with the mRFP‐GFP‐LC3 lentivirus for 24 h. Then, the cells were treated with or without 10 μM AEDC for 12 h and 5 mM 3‐MA for 6 h, followed by stimulation of LPS for 4 h and ATP for 1 h. mRFP‐GFP‐LC3 puncta were measured using a confocal microscope (n = 5). Scale bar = 5 μm. (h) THP‐1 cells were treated with or without 10 μM AEDC for 12 h and 5 mM 3‐MA for 6 h, followed by stimulation of LPS for 18 h and then ATP for 1 h. The levels of IL‐1β in the culture medium were determined by ELISA (n = 6). Data are expressed as means ± SEM. # P < 0.05 LPS + ATP vs. ctrl; *P < 0.05 LPS + ATP + AEDC (3‐MA) vs. LPS + ATP; & P < 0.05 LPS + ATP + AEDC vs. LPS + ATP + AEDC + 3‐MA
FIGURE 2
FIGURE 2
AEDC inhibited the activation of NLRP3 inflammasome by enhancing autophagy. THP‐1 cells were treated with or without 10 μM AEDC for 12 h and 5 mM 3‐MA for 6 h, followed by stimulation with LPS for 4 h and then ATP for 1 h. (a) NLRP3, pro‐caspase 1 and pro‐IL‐1β in the lysates and cleaved caspase‐1 and IL‐1β in the supernatant were analysed by Western blotting (n = 6). GAPDH was used as an internal loading control. Data were normalized to the mean value of the control group. (b) Immunofluorescence staining of NLRP3 was performed (n = 5). Scale bar = 10 μm. (c) Immunofluorescence stainings of endogenous NLRP3 and p62 were performed (n = 5). Scale bar = 10 μm. (d) The level of co‐precipitated p62 with NLRP3 in THP‐1 cells (n = 5). (d) Immunofluorescence stainings of caspase‐1 and ASC were performed (n = 5). Scale bar = 10 μm. Data are expressed as means ± SEM. # P < 0.05 LPS + ATP vs. ctrl; *P < 0.05 LPS + ATP + AEDC vs. LPS + ATP; & P < 0.05 LPS + ATP + AEDC vs. LPS + ATP + AEDC + 3‐MA
FIGURE 3
FIGURE 3
AEDC suppressed IL‐1β production and NLRP3 inflammasome activation by SIRT3‐AMPK‐mediated autophagy. (a) THP‐1 cells were treated with different concentrations of AEDC for 12 h, followed by stimulation with LPS for 4 h and then ATP for 1 h. Expression of SIRT3 was detected by Western blotting (n = 6). GAPDH was used as an internal loading control. Data were normalized to the mean value of the control group. (b) CETSA was performed on THP‐1 cells treated with or without 10 μM AEDC for 12 h. Data were normalized to the mean value of the respective group at 50°C (n = 5). THP‐1 cells were treated with or without 10 μM AEDC for 12 h and 50 μM 3‐TYP for 6 h, followed by stimulation with LPS for 4 h and then ATP for 1 h. (c) The SIRT3 deacetylating activity was evaluated. Data were normalized to the mean value of the control group (n = 6). (d) Expression of autophagy‐related proteins was detected by Western blotting (n = 5). GAPDH was used as an internal loading control. Data were normalized to the mean value of the control group. (e) THP‐1 cells were transiently infected with the mRFP‐GFP‐LC3 lentivirus for 24 h. mRFP‐GFP‐LC3 puncta were measured using a confocal microscope (n = 5). Scale bar = 10 μm. (f) NLRP3 and caspase‐1 in the cell lysates were detected by Western blotting (n = 5). GAPDH was used as an internal loading control. Data were normalized to the mean value of the control group. (g) The level of IL‐1β in the cell culture medium was determined by ELISA, in THP‐1 cells treated with or without 10 μM AEDC for 12 h and 50 μM 3‐TYP for 6 h, followed by stimulation of LPS for 18 h and ATP for 1 h (n = 6). Data are expressed as means ± SEM. # P < 0.05 LPS + ATP vs. ctrl; *P < 0.05 LPS + ATP + AEDC (3‐TYP) vs. LPS + ATP; & P < 0.05 LPS + ATP + AEDC vs. LPS + ATP + AEDC + 3‐TYP. (h) THP‐1 cells were treated with or without different concentrations of AEDC for 12 h, followed by stimulation with LPS for 4 h and then ATP for 1 h. p‐AMPK, AMPK, p‐ULK1 and ULK1 were detected by Western blotting (n = 6). GAPDH was used as an internal loading control. Data were normalized to the mean value of the control group. (i) THP‐1 cells were treated with or without 10 μM AEDC for 12 h and 4 μM compound C (CC) for 6 h, followed by stimulation with LPS for 4 h and then ATP for 1 h. The expression of autophagy‐related proteins was examined by Western blotting (n = 6). GAPDH was used as an internal loading control. Data were normalized to the mean value of the control group. (j) The level of IL‐1β in the culture medium was determined by ELISA, in THP‐1 cells treated with or without 10 μM AEDC for 12 h and 4 μM CC for 6 h, followed by stimulation of LPS for 18 h and ATP for 1 h (n = 6). Data are expressed as means ± SEM. # P < 0.05 LPS + ATP vs. ctrl; *P < 0.05 LPS + ATP + AEDC (CC) vs. LPS + ATP; & P < 0.05 LPS + ATP + AEDC vs. LPS + ATP + AEDC + CC
FIGURE 4
FIGURE 4
AEDC prevented LPS plus ATP‐induced mitochondrial perturbation by activating SIRT3. THP‐1 cells were treated with or without 10 μM AEDC for 12 h and 50 μM 3‐TYP for 6 h, followed by stimulation with LPS for 4 h and then ATP for 1 h. (a) The mtROS level was determined by MitoSOX (n = 6). (b) Mitochondrial membrane potential was evaluated by JC‐1 staining. The percentage of JC‐1 monomers positive cells was quantified (n = 6). Scale bar = 10 μm. (c) The acetylated and total SOD2 protein levels and SOD2 activity were determined (n = 6). Data were normalized to the mean value of the control group. (d) Immunofluorescence stainings of Tubulin Tracker and MitoTracker were performed (n = 5). Scale bar = 2 μm. (e) Immunofluorescence stainings of LC3‐II and MitoTracker were performed (n = 5). Scale bar = 5 μm. (f) Expression of autophagy‐related proteins and NLRP3 in mitochondria and cytosol was detected by Western blotting (n = 5). Data were normalized to the mean value of the control group. Data are expressed as means ± SEM. # P < 0.05 LPS + ATP vs. ctrl; *P < 0.05 LPS + ATP + AEDC (3‐TYP) vs. LPS + ATP; & P < 0.05 LPS + ATP + AEDC vs. LPS + ATP + AEDC + 3‐TYP
FIGURE 5
FIGURE 5
AEDC attenuates macrophage conditioned media (CM) or TNF‐α‐induced inflammatory responses in adipocytes. THP‐1 cells were treated with or without 10 μM AEDC for 12 h and 50 μM 3‐TYP for 6 h. Subsequently, the cells were stimulated with LPS for 4 h and then 1 mM ATP for 1 h. Then, the cells were changed to fresh medium. After 24 h, the medium supernatants were collected as macrophage conditioned media (CM). The fully differentiated 3T3‐L1 adipocytes were incubated in macrophage for 24 h. (a) NO production and the levels of (b) TNF‐α, (c) IL‐6 and (d) MCP‐1 in 3T3‐L1 adipocytes were determined. Data are expressed as means ± SEM (n = 6). # P < 0.05 RPMI 1640 + DMSO vs. macrophage CM + DMSO; *P < 0.05 macrophage CM + AEDC vs. macrophage CM + DMSO; & P < 0.05 macrophage CM + AEDC vs. macrophage CM + AEDC + 3‐TYP. (e) THP‐1 cells were treated with or without 10 μM AEDC for 12 h and 50 μM 3‐TYP for 6 h, followed by co‐culture with adipocyte CM for 4 h. Migrated THP‐1 macrophages were visualized by DAPI staining and quantified. Data are expressed as means ± SEM (n = 6). # P < 0.05 DMEM + DMSO vs. adipocyte CM + DMSO; *P < 0.05 adipocyte CM + AEDC vs. adipocyte CM + DMSO; & P < 0.05 adipocyte CM + AEDC vs. adipocyte CM + AEDC + 3‐TYP. Fully differentiated 3T3‐L1 adipocytes were treated with 10 μM AEDC for 12 h and 50 μM 3‐TYP for 6 h, followed by stimulation with TNF‐α (15 ng·ml−1) for 24 h. (f) The expression of autophagy‐related proteins were examined by Western blotting (n = 6). GAPDH was used as an internal loading control. Data were normalized to the mean value of the control group. The levels of (g) IL‐6, (h) IL‐1β and (i) MCP‐1 in the culture medium from 3T3‐L1 adipocytes were determined by ELISA (n = 6). Data are expressed as means ± SEM. # P < 0.05 TNF‐α vs. ctrl; *P < 0.05 TNF‐α + AEDC vs. TNF‐α; & P < 0.05 TNF‐α + AEDC vs. TNF‐α + AEDC + 3‐TYP. (j) Fully differentiated 3T3‐L1 adipocytes were treated with 10 μM AEDC for 12 h and 50 μM 3‐TYP for 6 h. Then, the cells were changed to fresh medium. After 24 h, the medium supernatants were collected as adipocyte CM. THP‐1 macrophages were cultured in adipocyte CM for 4 h and the migrated THP‐1 macrophages were visualized by DAPI staining and quantified (n = 5). Data are expressed as means ± SEM. # P < 0.05 DMEM + DMSO vs. adipocyte CM + DMSO; *P < 0.05 adipocyte CM + AEDC vs. adipocyte CM + DMSO; & P < 0.05 adipocyte CM + AEDC vs. adipocyte CM + AEDC + 3‐TYP
FIGURE 6
FIGURE 6
AEDC ameliorated LPS and ATP‐mediated inflammatory responses in mice. (a) The experimental procedure of LPS plus ATP‐induced acute inflammation. The male C57BL/6J mice were i.p. administrated with or without compound (AEDC, dexamethasone (DEX), or 3‐TYP) once a day for 5 days. On the sixth day, the control group of mice were i.p. injected with 10 ml·kg−1 PBS and the other six groups of mice were i.p. injected with 4 mg·kg−1 LPS (0.4 mg·ml−1 in PBS) for 4 h followed by 30 mg·kg−1 ATP (3 mg·ml−1 in PBS). Half hour later, the blood samples were collected and the mice were dissected. DEX: 4 mg·kg−1 DEX; AEDC‐L: 5 mg·kg−1 AEDC; AEDC‐H: 20 mg·kg−1 AEDC; 3‐TYP: 4 mg·kg−1 3‐TYP; AEDC + 3‐TYP: 20 mg·kg−1 AEDC and 4 mg·kg−1 3‐TYP. The serum levels of (b) IL‐1β, (c) TNF‐α, (d) MCP‐1 and (e) IL‐6 were determined by ELISA. Data are expressed as means ± SEM (n = 5). # P < 0.05 LPS + ATP vs. vehicle; *P < 0.05 AEDC‐L, AEDC‐H, or DEX vs. LPS + ATP; & P < 0.05 AEDC‐H vs. AEDC + 3‐TYP
FIGURE 7
FIGURE 7
AEDC suppressed inflammation in the peritoneal macrophages from LPS plus ATP‐induced mice. The level of IL‐1β was determined by (a) quantitative RT‐PCR and (b) ELISA. The levels of (c) TNF‐α, (d) IL‐6 and (e) MCP‐1 were determined by ELISA. (f) Expression of autophagy‐related proteins was detected by Western blotting. GAPDH was used as an internal loading control. Data were normalized to the mean value of the control group. (g) NLRP3, pro‐IL‐1β, cleaved IL‐1β, pro‐caspase 1 and caspase 1 p20 in peritoneal macrophages were analysed by Western blotting. GAPDH was used as an internal loading control. Data were normalized to the mean value of the control group. dexamethasone (DEX): 4 mg·kg−1 DEX; AEDC‐L: 5 mg·kg−1 AEDC; AEDC‐H: 20 mg·kg−1 AEDC; 3‐TYP: 4 mg·kg−1 3‐TYP; AEDC + 3‐TYP: 20 mg·kg−1 AEDC and 4 mg·kg−1 3‐TYP. Data are expressed as means ± SEM (n = 5). # P < 0.05 LPS + ATP vs. vehicle; *P < 0.05 AEDC‐L, AEDC‐H, or DEX vs. LPS + ATP; & P < 0.05 AEDC‐H vs. AEDC + 3‐TYP
FIGURE 8
FIGURE 8
AEDC reduced macrophage content in epididymal adipose tissue from LPS plus ATP‐induced mice. (a) H&E staining and histopathological score of epididymal white adipose tissue (eWAT). The infiltrated macrophages in eWAT were indicated by the red arrows. Scale bar = 200 μm. (b) Immunofluorescence staining of perilipin‐1 (green) and F4/80 (red) in eWAT. Scale bar = 100 μm. The levels of (c) IL‐1β, (d) TNF‐α, (e) MCP‐1 and (f) IL‐6 in eWAT were determined by ELISA. Dexamethasone (DEX): 4 mg·kg−1 DEX; AEDC‐L: 5 mg·kg−1 AEDC; AEDC‐H: 20 mg·kg−1 AEDC; 3‐TYP: 4 mg·kg−1 3‐TYP; AEDC + 3‐TYP: 20 mg·kg−1 AEDC and 4 mg·kg−1 3‐TYP. Data are expressed as means ± SEM (n = 5). # P < 0.05 LPS + ATP vs. vehicle; *P < 0.05 AEDC‐L, AEDC‐H, or DEX vs. LPS + ATP; & P < 0.05 AEDC‐H vs. AEDC + 3‐TYP
FIGURE 9
FIGURE 9
AEDC suppressed the expression of chemokines and macrophage markers in epididymal white adipose tissue (eWAT) from LPS plus ATP‐induced mice. (a) Expression of F4/80, CD68, CD11c and CD206 was detected by Western blotting. GAPDH was used as an internal loading control. Data were normalized to the mean value of the control group. (b) Immunohistochemical stainings of CD206 and CD11c in eWAT. The mRNA levels of macrophage markers in eWAT, including (c) F4/80, (d) CD68, (e) CD11c and (f) CD206. The mRNA levels of chemokines, including (g) MCP‐1, (h) MIP‐1α, (i) Cxcl10, (j) Ccl11 and (k) Ccl5. 18S was used as an internal control. DEX: 4 mg·kg−1 DEX; AEDC‐L: 5 mg·kg−1 AEDC; AEDC‐H: 20 mg·kg−1 AEDC; 3‐TYP: 4 mg·kg−1 3‐TYP; AEDC + 3‐TYP: 20 mg·kg−1 AEDC and 4 mg·kg−1 3‐TYP. Data are expressed as means ± SEM (n = 5). # P < 0.05 LPS + ATP vs. vehicle; *P < 0.05 AEDC‐L, AEDC‐H vs. LPS + ATP; & P < 0.05 AEDC‐H vs. AEDC + 3‐TYP
FIGURE 10
FIGURE 10
Schematic models of molecular targets of AEDC in attenuating visceral adipose tissue inflammation signalling pathways

References

    1. Agostini, L. , Martinon, F. , Burns, K. , McDermott, M. F. , Hawkins, P. N. , & Tschopp, J. (2004). NALP3 forms an IL‐1beta‐processing inflammasome with increased activity in Muckle–Wells autoinflammatory disorder. Immunity, 20, 319–325. 10.1016/s1074-7613(04)00046-9 - DOI - PubMed
    1. Alexander, S. P. H. , Kelly, E. , Mathie, A. , Peters, J. A. , Veale, E. L. , Armstrong, J. F. , … Collaborators, C. (2019). The concise guide to pharmacology 2019/20: Introduction and other protein targets. British Journal of Pharmacology, 176(Suppl 1), S1–S20. 10.1111/bph.14747 - DOI - PMC - PubMed
    1. Alexander, S. P. H. , Roberts, R. E. , Broughton, B. R. S. , Sobey, C. G. , George, C. H. , Stanford, S. C. , … Ahluwalia, A. (2018). Goals and practicalities of immunoblotting and immunohistochemistry: A guide for submission to the British Journal of Pharmacology . British Journal of Pharmacology, 175, 407–411. 10.1111/bph.14112 - DOI - PMC - PubMed
    1. Chacón, M. R. , Fernandez‐Real, J. , Richart, C. , Megía, A. , Gómez, J. , Miranda, M. , … Vendrell, J. (2007). Monocyte chemoattractant protein‐1 in obesity and type 2 diabetes. Relationship with insulin‐resistance and proinflammatory cytokines. Obesity, 15, 664–672. 10.1038/oby.2007.578 - DOI - PubMed
    1. Chen, G. Y. , & Nunez, G. (2010). Sterile inflammation: Sensing and reacting to damage. Nature Reviews Immunology, 10, 826–837. 10.1038/nri2873 - DOI - PMC - PubMed

Publication types