. 2020 Dec;588(7836):146-150.
doi: 10.1038/s41586-020-2600-6. Epub 2020 Jul 29.

Association of COVID-19 inflammation with activation of the C5a-C5aR1 axis

Collaborators, Affiliations

Association of COVID-19 inflammation with activation of the C5a-C5aR1 axis

Julien Carvelli et al. Nature. 2020 Dec.

Abstract

Coronavirus disease 2019 (COVID-19) is a disease caused by infection with severe acute respiratory syndrome coronavirus 2 (SARS-CoV-2) and has resulted in a pandemic1. The C5a complement factor and its receptor C5aR1 (also known as CD88) have a key role in the initiation and maintenance of several inflammatory responses by recruiting and activating neutrophils and monocytes1. Here we provide a longitudinal analysis of immune responses, including phenotypic analyses of immune cells and assessments of the soluble factors that are present in the blood and bronchoalveolar lavage fluid of patients at various stages of COVID-19 severity, including those who were paucisymptomatic or had pneumonia or acute respiratory distress syndrome. The levels of soluble C5a were increased in proportion to the severity of COVID-19 and high expression levels of C5aR1 receptors were found in blood and pulmonary myeloid cells, which supports a role for the C5a-C5aR1 axis in the pathophysiology of acute respiratory distress syndrome. Anti-C5aR1 therapeutic monoclonal antibodies prevented the C5a-mediated recruitment and activation of human myeloid cells, and inhibited acute lung injury in human C5aR1 knock-in mice. These results suggest that blockade of the C5a-C5aR1 axis could be used to limit the infiltration of myeloid cells in damaged organs and prevent the excessive lung inflammation and endothelialitis that are associated with acute respiratory distress syndrome in patients with COVID-19.


Conflict of interest statement

Competing interests: O.D., L.B., J.F., S.C., M.-L.T., A.M., R.R., P.A., A.Represa, L.A.M., W.B., N.B., C.C., F. Caraguel, B.Carrette, F.Carrette, F.Chanuc, R.C., A.F., M.Giordano, M.G.-M., M.G.-P., N.G., G.G., F.G., G.H., S.J., J.L., M.L.V., N.L., M.M., E.B., A.S., A.Reboul, E.M., C.N.-C., V.P., P.R., L.S., J.-B.V., M.V., R.Z., Y.M. and E.V. are employees of Innate Pharma. The other authors declare no competing interests.

Figures

Extended Fig. 1
Extended Fig. 1. Immune activation in COVID-19 patients.
a, Number of patients for each level of disease severity, classified according to SARS-CoV-2 seroneutralizing status. Biological samples were collected at T0: < 72 h after the start of hospital care; T1: between days 5 and 10. b, Concentration of C5a desArg in plasma from pneumonia and ARDS patients followed over time. T0: < 72 h after the beginning of hospital care; T1: between days 5 and 10; T2: > day 10. p-values for the comparison of T1 (n=19) and T0 (n=34) in pneumonia group were obtained using two-tailed Wilcoxon signed-rank tests. No statistical tests were performed for T2 (n=4). For ARDS group, a mixed model was computed with timepoint (categorical variable) as a fixed effect and patient as a random effect. n=28 for T0, n=23 for T1 and n=18 for T2. Confidence intervals and p-values are based on the t-distribution, with degrees of freedom according to the Kenward-Roger method. Each symbol represents a single donor. c, Left, Heatmap of genes differentially expressed (logFC >2 & FDR < 5%) between PBMC samples from healthy donors and COVID-19 patients. Right, Heatmap of monocyte and macrophage metagene expression in lung samples from healthy donors and COVID-19 patients. d, Three lung samples from deceased patients were obtained and suitable for IHC analysis. Left, H&E staining of obliterating endarteritis lesions in the lungs of a representative COVID-19 patient. Right, C5b9 IHC staining on lung sections of a representative COVID-19 patients, demonstrating complement pathway activation in lung. Scale bar = 50 μm.
Extended Fig. 2
Extended Fig. 2. C5aR1 expression remained stable on myeloid cells during the course of COVID-19.
a, % C5aR1-expressing neutrophils and monocytes in pneumonia (green) and ARDS (red) patients followed over time. T0: < 72 h after the start of hospital care; T1: between days 5 and 10; T2: > day 10. For pneumonia group, n= 34 for T0, n=18 (neutrophils) and 21 (monocytes) for T1 and n= 3 for T2. For ARDS group, n=28 for T0, n= 23 for T1 and n= 22 for T2. Each symbol represents a single donor.
Extended Fig. 3
Extended Fig. 3. Myeloid cell analysis in COVID-19 patients.
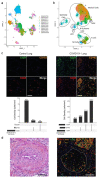
a-b, Integration of transcriptomic single-cell data with Harmony. a, UMAP projection of donors before integration. b, UMAP projection of major cell types and associated clusters after integration by Harmony. c, Representative multiplexed IHC staining of C5aR (green), CD68 (red) and CD163 (orange) on lung sections from control or COVID-19 patients among three samples from deceased patients and suitable for IHC analyses. Scale 100 μm. Quantifications represent cell density per mm2 of multiplexed IHC staining of C5aR1, CD68 and CD163. d, Three samples from deceased patients were obtained and suitable for IHC analysis. Endoarteritis lesions were observed in two out of three patients, consistent with previous reports. The patient without endoarteritis lesions did not die from COVID-19. Left, representative H&E staining of obliterating endarteritis lesions in the lungs of COVID-19 patients. Right, representative multiplexed IHC staining of C5aR1 (green), CD68 (red) and CD163 (orange) showing that obliterating endarteritis was frequently associated with C5aR1+ macrophages surrounding the arteries and in the thrombus (white dotted line). Scale 100 μm.
Extended Fig. 4
Extended Fig. 4. Targeting C5aR1 to block C5a-mediated myeloid cell activation.
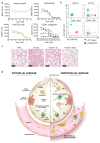
a, Analysis of the efficacy of increasing doses of avdoralimab (purple), an anti-C5a mAb (orange), a C5aR1 antagonist (avacopan, black) or IC (gray) for blocking C5a-induced CD11b upregulation on human neutrophils. Each line represents data from a single donor +/− SD from experimental duplicates (PBS) or triplicates (inhibitors). b, Comparative expression of mouse C5aR1 (moC5aR1) and human C5aR1 (huC5aR1) on CD11b non-myeloid cells, CD11b+ myeloid cells, including Ly6C+Ly6G+ neutrophils and Ly6C+Ly6G monocytes, from WT (blue) and huC5aR1 KI (red) mice. c, H&E staining of lungs from huC5aR1 KI mice treated intranasally with huC5a. Mice were pretreated with avdoralimab (avdo) or isotype control (IC), when indicated. Scale bar =100 μm. Pictures are representative of 2 independent experiments. d, A model of C5a involvement in COVID-19: SARS-CoV-2 infects the human airway epithelium via the ACE2 receptors located principally on type II pneumocytes. Left, in non-severe COVID-19, the infection remains confined to the epithelium (epithelial disease), thanks to the efficient action of the immune system. C5a allows the recruitment of myeloid cells without triggering an inflammatory storm, and the virus is eliminated. Right, in severe COVID-19, SARS-CoV-2 escapes the immune system, crosses the epithelium and infect endothelial cells (endothelial disease). The myeloid cells recruited by C5a and endothelial cells release large amounts of inflammatory cytokines. The COVID-19-related cytokine storm and endothelialitis-associated microthrombosis are triggered. The patient’s condition worsens and the virus can infect other organs.
Fig. 1
Fig. 1. Inflammation is associated with a cytokine storm and C5a production in COVID-19 patients.
a, Concentrations of CRP, IL-6, CCL4, CCL2 and CXCL9 in plasma from healthy donors (HC) and COVID-19 patients. b, Concentration of C5a desArg in plasma of HC and COVID-19 patients. a-b, HC (white, n=10), pauci (blue, n=10), pneumo (green, n=31 to 34) and ARDS (red, n=26 to 28). For CRP and b p-values were computed using two-tailed Wilcoxon rank-sum tests. For IL-6, CCL4, CCL2 and CXCL9: a global comparison was first performed in which all values were classified into two categories: above or below the LOQ (p-values for two-sided Fisher’s exact tests demonstrated an increase in the number of values above the LOQ with increasing severity); Fisher tests: 5×10⁻⁷ for IL-6, 0.02 for CCL4, 0.001 for CCL2, 9×10⁻⁶ for CXCL9. A comparison was then performed between pneumonia and ARDS groups, exclusively for values above the LOQ (p-values were computed using two-tailed Wilcoxon rank-sum tests). Each symbol represents a single donor. Boxplots represent the median and 25th to 75th percentiles and the whiskers denote the maximum and minimum values.
Fig. 2
Fig. 2. C5aR1 is highly expressed on myeloid cells and promotes inflammation.
a, Absolute numbers of circulating neutrophils per μL of peripheral blood from healthy donors and COVID-19 patients at T0. b, Absolute numbers of circulating total monocytes, and percentages of CD14+CD16 conventional monocytes and CD14lowCD16+ inflammatory monocytes in the peripheral blood of healthy donors and COVID-19 patients at T0. c, Percentage of C5aR1+ neutrophils and monocytes in peripheral blood. a-c, HC (healthy controls, white, n=10), pauci (paucisymptomatic, blue, n=10), pneumo (pneumonia, green, n=31) and ARDS (red, n=26); Each symbol represents a single donor. d, IL-6, TNF and CCL2 production by monocytes purified from PBMCs from COVID-19 patients and activated overnight with LPS (0.5 ng/mL) or R848 (50 ng/mL) and C5a (1 μg/mL), when indicated. Each dot represents the mean value obtained from duplicate or triplicate analyses for a single patient (n=12 patients). Boxplots represent the median and 25th to 75th percentiles and the whiskers denote the maximum and minimum values. The p-values were obtained using two-tailed Wilcoxon rank-sum tests for a-c and two-tailed Wilcoxon signed-rank tests for d.
Fig. 3
Fig. 3. C5aR1+ cells and C5a are detected in lung samples from COVID-19 patients.
a, Concentration of C5a desArg and IL-6, CXCL9, CCL2, CCL4, IL-8, TNF and IL-1β in the BALF of ARDS patients (n=4). # above the detection limit of 52200 pg/mL; $ below the detection limit of 29 pg/mL. b, CD45+ immune cell infiltration in BALF from ARDS patients visualized by flow cytometry, and C5aR1 expression (red) vs. FMO (black) staining on CD45+CD14CD15+CD16+ neutrophils and CD45+CD33+HLADR+CD14+ monocytes in BALF from ARDS patients. The images shown are representative of analyses performed on samples from three ARDS patients. c, UMAP of myeloid cell clusters by patient group: healthy controls (n=3) and patients with severe COVID-19 (n=6). d, Dotplot of pro-inflammatory cytokine expression, by cluster.
Fig. 4
Fig. 4. Targeting C5aR1 blocks C5a-mediated myeloid cell activation and migration.
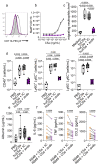
a, Representative flow cytometry histogram of C5a-mediated CD11b upregulation on whole blood neutrophils, inhibited by avdoralimab. The gray line corresponds to non-activated neutrophils; black line corresponds to C5a-activated neutrophils and purple line corresponds to avdoralimab (30 μg/mL)-treated neutrophils activated with C5a. b, CD11b induction through a dose-dependent response to C5a on untreated (gray) or avdoralimab (10 μg/mL)-treated whole-blood neutrophils (purple). Data were obtained from two independent donors. c, Migrating neutrophils attracted by C5a. Neutrophils were treated with 10 μg/mL isotype control (dark gray) or avdoralimab (purple) before the induction of migration. Data for neutrophils purified from four healthy donors are shown. d-e, BALF was collected from huC5aR1 knock-in mice 18 hours after intranasal instillation of recombinant human C5a. Mice were pretreated with avdoralimab (avdo, purple) or isotype control (IC, dark gray), when indicated. Each symbol represents data from a single mouse, n=5 for PBS group and n=7 for the other groups. Data are representative of 2 experiments. d, BALF cell analysis by flow cytometry including CD45+ immune cells, Ly6C+Ly6G+ neutrophils and Ly6C+Ly6G monocytes. e, Albumin concentration in BALF. f, Production of IL-6, TNF and CCL2 by monocytes purified from the PBMCs of COVID-19 patients activated by overnight incubation with R848 (50 ng/mL) and C5a (1 μg/mL). Before activation, monocytes were incubated with 20 μg/mL avdoralimab (avdo) or isotype control (IC). Each dot represents the mean value obtained from duplicate or triplicate analyses of a single donor, n=10 for IL-6 and n=12 for TNF and CCL2. Boxplots represent the median and 25th to 75th percentiles and the whiskers denote the maximum and minimum values. The p-values were computed using paired one-way ANOVA for c, two-tailed Wilcoxon rank-sum tests for d-e and two-tailed Wilcoxon signed-rank tests for f.

References

    1. Wang R, Xiao H, Guo R, Li Y, Shen B. The role of C5a in acute lung injury induced by highly pathogenic viral infections. Emerging microbes & infections. 2015;4:e28. doi: 10.1038/emi.2015.28. - DOI - PMC - PubMed
    1. Cao X. COVID-19: immunopathology and its implications for therapy. Nature reviews Immunology. 2020;20:269–270. doi: 10.1038/s41577-020-0308-3. - DOI - PMC - PubMed
    1. Mehta P, et al. COVID-19: consider cytokine storm syndromes and immunosuppression. Lancet. 2020;395:1033–1034. doi: 10.1016/S0140-6736(20)30628-0. - DOI - PMC - PubMed
    1. Long QX, et al. Antibody responses to SARS-CoV-2 in patients with COVID-19. Nature medicine. 2020 doi: 10.1038/s41591-020-0897-1. - DOI - PubMed
    1. Guo RF, Ward PA. Role of C5a in inflammatory responses. Annual review of immunology. 2005;23:821–852. doi: 10.1146/annurev.immunol.23.021704.115835. - DOI - PubMed

Publication types

MeSH terms