. 2020 Jul 29;19(1):118.
doi: 10.1186/s12943-020-01237-y.

LncRNA PVT1 promotes gemcitabine resistance of pancreatic cancer via activating Wnt/β-catenin and autophagy pathway through modulating the miR-619-5p/Pygo2 and miR-619-5p/ATG14 axes

Affiliations

LncRNA PVT1 promotes gemcitabine resistance of pancreatic cancer via activating Wnt/β-catenin and autophagy pathway through modulating the miR-619-5p/Pygo2 and miR-619-5p/ATG14 axes

Cefan Zhou et al. Mol Cancer. .

Abstract

Background: Pancreatic cancer is one of the most lethal malignancies and has an extremely poor diagnosis and prognosis. The development of resistance to gemcitabine is still a major challenge. The long noncoding RNA PVT1 was reported to be involved in carcinogenesis and chemoresistance; however, the mechanism by which PVT1 regulates the sensitivity of pancreatic cancer to gemcitabine remains poorly understood.

Methods: The viability of pancreatic cancer cells was assessed by MTT assay in vitro and xenograft tumor formation assay in vivo. The expression levels of PVT1 and miR-619-5p were detected by quantitative real-time polymerase chain reaction (qRT-PCR). Western blotting analysis and qRT-PCR were performed to assess the protein and mRNA levels of Pygo2 and ATG14, respectively. Autophagy was explored via autophagic flux detection under confocal microscopy and autophagic vacuole investigation under transmission electron microscopy (TEM). The functional role and mechanism of PVT1 were further investigated by gain- and loss-of-function assays in vitro.

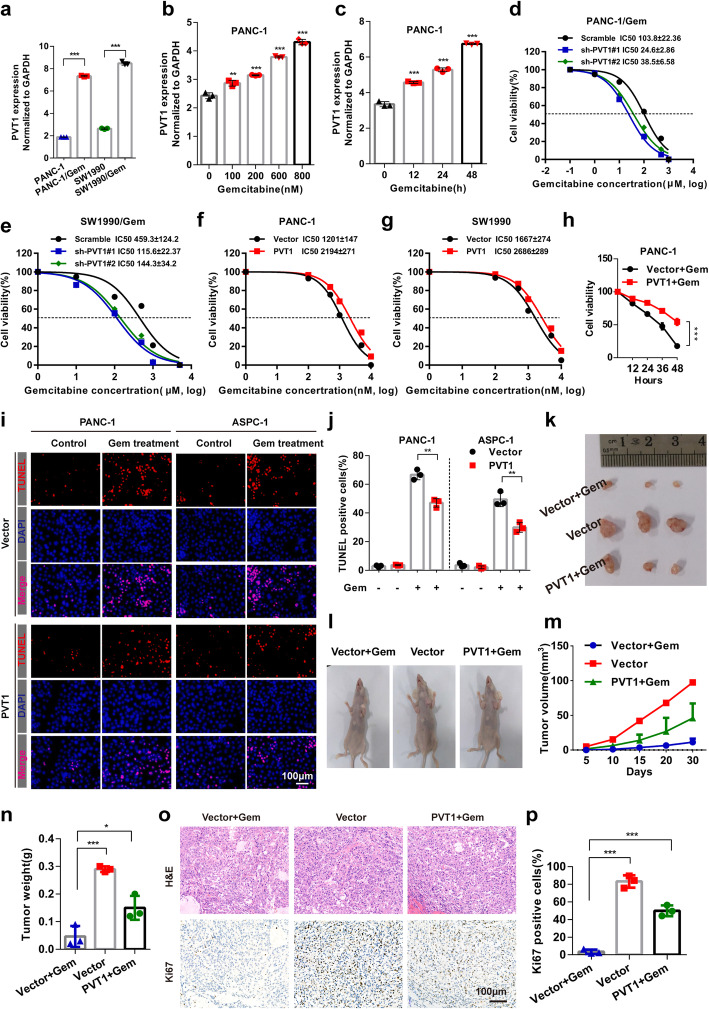
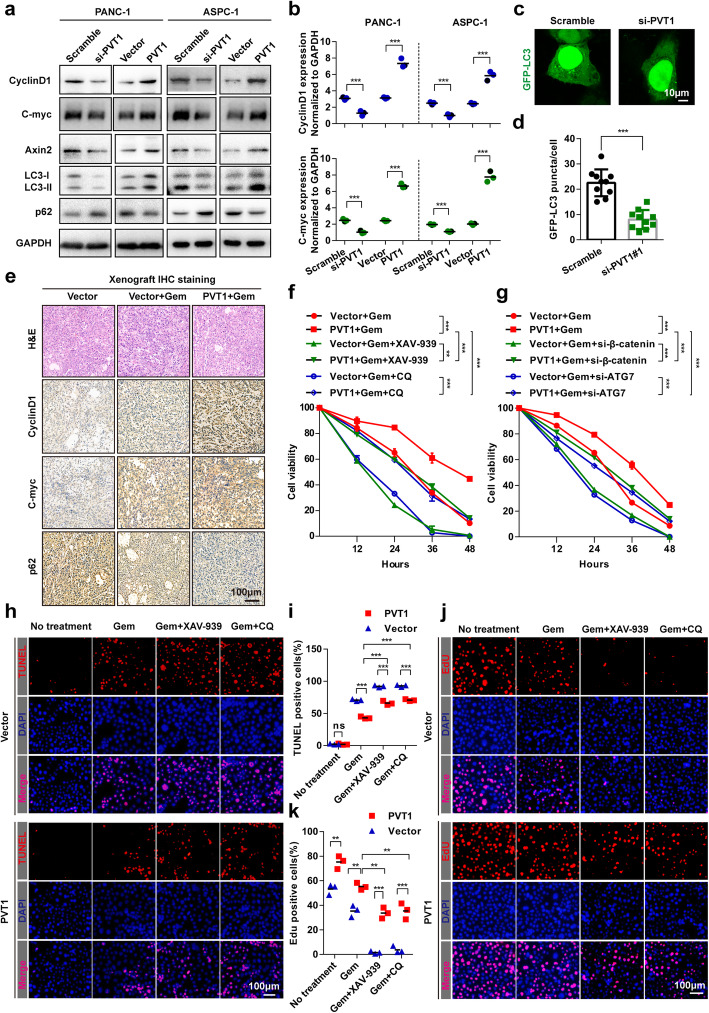
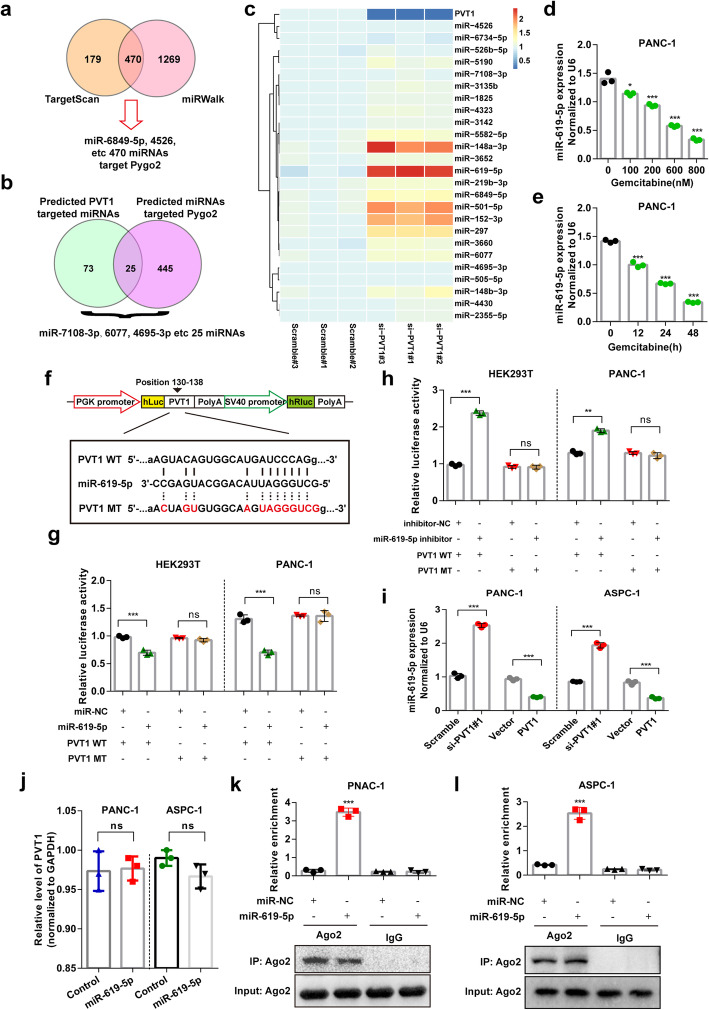
Results: In the present study, we demonstrated that PVT1 was up-regulated in gemcitabine-resistant pancreatic cancer cell lines. Gain- and loss-of-function assays revealed that PVT1 impaired sensitivity to gemcitabine in vitro and in vivo. We further found that PVT1 up-regulated the expression of both Pygo2 and ATG14 and thus regulated Wnt/β-catenin signaling and autophagic activity to overcome gemcitabine resistance through sponging miR-619-5p. Moreover, we discovered three TCF/LEF binding elements (TBEs) in the promoter region of PVT1, and activation of Wnt/β-catenin signaling mediated by the up-regulation of Pygo2 increased PVT1 expression by direct binding to the TBE region. Furthermore, PVT1 was discovered to interact with ATG14, thus promoting assembly of the autophagy specific complex I (PtdIns3K-C1) and ATG14-dependent class III PtdIns3K activity.

Conclusions: These data indicate that PVT1 plays a critical role in the sensitivity of pancreatic cancer to gemcitabine and highlight its potential as a valuable target for pancreatic cancer therapy.

Keywords: Autophagy; Gemcitabine resistance; PVT1; Wnt/β-catenin; miR-619-5p.


Conflict of interest statement

The authors declare no conflict of interest.

Figures

Fig. 1
Fig. 1
PVT1 promotes pancreatic cancer cell resistance to gemcitabine in vitro and in vivo.a After nocodazole treatment for 12 h, the expression level of PVT1 in PANC-1 and SW1990 human pancreatic cancer cell lines and the PANC-1/Gem and SW1990/Gem gemcitabine resistant cell lines was examined by real-time qPCR. b and c PANC-1 cells were treated with gemcitabine at different concentrations and for different durations as indicated. Then, the expression levels of PVT1 were determined. d-g PANC-1/Gem and SW1990/Gem cells with stable PVT1knockdown and PANC-1 and SW1990 cells with stable PVT1 expression were treated with gemcitabine at different concentrations for 48 h, and cell viability was then measured by MTT assay. h PANC-1 cells stably expressing PVT1 were treated with gemcitabine (1 μM) for different durations as indicated, and cell viability was measured by MTT assay. i and j Apoptotic cells among PVT1 overexpressing PANC-1 and ASPC-1 cells treated with gemcitabine were analyzed by TUNEL assay, the number of TUNEL-positive cells was quantified. Scale bars: 100 μm. k and l Representative photographs of tumor-bearing mice in different groups and tumors excised from the mice were shown. m Growth curve showing changes in tumor volume in mice from different groups; growth was assessed every 5 days beginning from the injection and during gemcitabine (50 mg/kg) treatment. n Weight of the tumors excised from mice in each group. o and p Representative H&E staining images and immunohistochemical images of Ki67 in excised tumor tissues. Scale bars: 100 μm. Data were represented as mean ± SD, *P < 0.05; **P < 0.01; ***P < 0.001
Fig. 2
Fig. 2
Gemcitabine resistance induced by PVT1 was associated with increased Wnt/β-catenin signaling pathway and autophagic activity. a Whole cell lysates from PANC-1 and ASPC-1 cells transfected with PVT1 overexpression plasmid or PVT1 siRNA were analyzed by western blotting using the indicated antibodies. b The expression levels of CyclinD1 and C-myc in PANC-1 and ASPC-1 cells transfected with PVT1 overexpression plasmid or PVT1 siRNA were analyzed by real-time qRT-PCR. c and d Representative confocal images of GFP-LC3 puncta in PANC-1 cells transfected with PVT1 siRNA. The number of GFP-LC3 puncta was quantified using ImageJ software. (n = 10). Scale bars: 10 μm. e Representative H&E staining images and immunohistochemical images of CyclinD1, C-myc and p62 in excised xenograft tumor tissues. Scale bars: 100 μm. f PANC-1 cells stably expressing PVT1 were treated with gemcitabine (1 μM), XAV-939 (10 μM) or CQ (10 μM) for different durations as indicated, and cell viability was measured by MTT assay. g PANC-1 cells stably expressing PVT1 were transfected with β-catenin siRNA or ATG7 siRNA, and the cells were then treated with gemcitabine (1 μM) for different durations as indicated. Cell viability was measured by MTT assay. h and i Apoptotic cells among PVT1 overexpressed PANC-1 cells treated with gemcitabine (1 μM), XAV-939 (10 μM) or CQ (10 μM) were analyzed by TUNEL assay, and the number of TUNEL-positive cells was quantified. Scale bars: 100 μm. j and k Representative images and quantification of EdU incorporation in PVT1 overexpressing PANC-1 cells treated with gemcitabine (1 μM), XAV-939 (10 μM) or CQ (10 μM). Scale bars: 100 μm. Data were represented as mean ± SD, *P < 0.05; **P < 0.01; ***P < 0.001
Fig. 3
Fig. 3
PVT1 promotes the Wnt/β-catenin signaling pathway through enhancing Pygo2 expression. a and b The protein and mRNA expression levels of Pygo2 in PANC-1 and ASPC-1 cells transfected with PVT1 overexpression plasmid or PVT1 siRNA were analyzed by western blotting and real-time qRT-PCR, respectively. c The mRNA expression level of Pygo2 in PANC-1, SW1990 and the gemcitabine resistant PANC-1/Gem, SW1990/Gem cell lines was examined by real-time qPCR. d The mRNA and protein expression levels of Pygo2 in PANC-1 cells transfected with PVT1 siRNA with or without gemcitabine treatment were analyzed. e The expression levels of C-myc, CyclinD1 and Axin2 in PANC-1 cells transfected with PVT1 siRNA or HA-Pygo2 plasmid treated with or without gemcitabine were analyzed by real-time qRT-PCR. f The whole cell lysates of PANC-1 and ASPC-1 cells transfected with PVT1 overexpression plasmid or PVT1 siRNA combined with Pygo2 overexpression plasmid or Pygo2 siRNA transfection were analyzed by western blotting using the indicated antibodies. g and h The cytoplasmic and nuclear distributions of β-catenin after PVT1 or Pygo2 siRNA transfection were assessed by immunofluorescence. The ratio of nuclear fluorescence intensity/total fluorescence intensity was quantified using GraphPad Prism 6.0 software. Scale bars: 50 μm. i and j TCF transcriptional activity was compared between PVT1 knockdown and Pygo2 overexpressing cells with or without Wnt3a (100 ng/ml). Cells were transiently transfected with TOP/FOP Flash reporter, and the luciferase activity was measured. k-n The protein and mRNA levels of MDR1 (P-gp) were measured in PANC-1 cells with PVT1 overexpression or knockdown with or without Pygo2/β-catenin knockdown treated with gemcitabine (1 μM) or XAV-939 (10 μM). Data were represented as mean ± SD, *P < 0.05; **P < 0.01; ***P < 0.001
Fig. 4
Fig. 4
Up-regulation of Pygo2 elevated PVT1 levels through the Wnt/β-catenin signaling pathway. a TCF4 binding sequence in the PVT1 promoter region predicted with the JASPAR website; the predicted sequence and score were shown. b Relative levels of PVT1 in PANC-1 and ASPC-1 cells treated with the Wnt/β-catenin signaling activator Wnt3a (100 ng/ml) and inhibitor XAV939 (10 μM). c Relative levels of PVT1 in PANC-1 and ASPC-1 cells treated with gemcitabine (1 μM) with or without Pygo2 siRNA or β-catenin siRNA transfection. d pGL-PVT1 promoter reporter luciferase activity in PANC-1 cells transfected with β-catenin and Pygo2 overexpression vector or Pygo2 siRNA and β-catenin siRNA treated with Wnt3a (100 ng/ml) or gemcitabine (1 μM). e Deletion mutants of the PVT1 promoter. f PANC-1 cells were subjected to ChIP assay using an antibody against TCF4, and enrichment of the PVT1 promoter fragments was shown. g and h ChIP assay in PANC-1 and ASPC-1 cells with the indicated primers and antibodies with or without Pgyo2 siRNA transfection. The Axin2 promoter was used as a positive control, and the primers to amplify its ORF regions were used as negative controls. i Schematic diagram of the generated luciferase reporter plasmids containing wild-type and mutant predicted TCF4 binding elements and relative luciferase activity after the transfection of HEK293T cells with these plasmids with or without LiCl (50 mM) treatment. j The effects of β-catenin and Pygo2 knockdown on the luciferase activity in PANC-1 and ASPC-1 cells transfected with wild-type PVT1 and PVT1 1–3 deletion mutant reporter plasmids with or without gemcitabine treatment. Data were represented as mean ± SD, *P < 0.05; **P < 0.01; ***P < 0.001
Fig. 5
Fig. 5
PVT1 directly targets miR-619-5p. a and b Potential miRNAs that target both Pygo2 and PVT1 were predicted using the miRWalk and TargetScan databases. c The expression of predicted miRNAs that target both Pygo2 and PVT1 was assessed by qRT-PCR after PVT1 transfected with siRNA for 48 h. Heatmap were drawn by using ImageGP online software (http://www.ehbio.com/ImageGP/). d and e The expression of miR-619-5p was measured in PANC-1 cells treated with indicated concentration and time. f The predicted miR-619-5p binding sequence in PVT1 and the generation of dual-luciferase reporter plasmids of wild-type (WT) or mutant (MT) were shown. g Luciferase activity assays were performed in HEK293T or PANC-1 cells co-transfected with PVT1 WT or PVT1 MT and miR-NC or miR-619-5p. h Luciferase activity assays were performed in HEK293T or PANC-1 cells co-transfected with PVT1 WT or PVT1 MT and miR-619-5p inhibitor or inhibitor-NC. i The relative expression of miR-619-5p in PANC-1 and ASPC-1 cells transfected with PVT1 siRNA or PVT1 overexpression plasmid. j The relative expression of PVT1 in PANC-1 and ASPC-1 cells transfected with miR-619-5p mimics. k and l Anti-Ago2 RIP was performed in PANC-1 and ASPC-1 cells transfected with miR-619-5p mimics or miR-NC, followed by qRT-PCR to detect PVT1 enrichment. Data were represented as mean ± SD, *P < 0.05; **P < 0.01; ***P < 0.001
Fig. 6
Fig. 6
miR-619-5p negatively regulates Pygo2 and ATG14 expression. a The predicted miR-619-5p binding sequence in the Pygo2 3’UTR and the generation of dual-luciferase reporter plasmids of wild-type (WT) or mutant (MT) were shown. b Luciferase activity assays were performed in PANC-1 cells co-transfected with Pygo2 WT or Pygo2 MT and miR-619-5p mimic or miR-619-5p inhibitor. c and d The mRNA and protein levels of Pygo2 in PANC-1 and ASPC-1 cells after transfection with miR-619-5p mimics or miR-619-5p inhibitor. e Western blotting in PANC-1 cells transfected with PVT1 siRNA was carried out using the indicated antibodies. f and g The miR-619-5p binding sequence in the ATG14 3’UTR and the generation of dual-luciferase reporter plasmids of wild-type (WT) or mutant (MT) were shown. h Luciferase activity assays were performed in PANC-1 cells co-transfected with ATG14 WT or ATG14 MT and miR-619-5p mimic or miR-619-5p inhibitor. i-k The mRNA and protein levels of ATG14 in PANC-1 and ASPC-1 cells after transfection with miR-619-5p mimics or miR-619-5p inhibitor. l and m The expression of ATG14 after co-transfection with PVT1 and miR-619-5p mimics or PVT1 siRNA and miR-619-5p inhibitor. Data were represented as mean ± SD, *P < 0.05; **P < 0.01; ***P < 0.001
Fig. 7
Fig. 7
PVT1/miR-619-5p axis promotes autophagic activity by regulating ATG14. a Western blotting analysis of PANC-1 and ASPC-1 cells after PVT1 knockdown with or without ATG14 overexpression was carried out with the indicated antibodies. b Western blotting analysis of PANC-1 and ASPC-1 cells after PVT1 overexpression with or without ATG14 knockdown was carried out with the indicated antibodies. c and d Representative confocal images of GFP-LC3 puncta in PANC-1 cells transfected with PVT1 siRNA with or without co-transfection of ATG14 overexpression plasmid with and without gemcitabine treatment. The number of GFP-LC3 puncta was quantified using ImageJ software. (n = 10). Scale bars: 10 μm. e and f Representative confocal images of GFP-LC3 puncta in PANC-1 cells transfected with PVT1 overexpression plasmid with or without co-transfection with ATG14 siRNA with and without gemcitabine treatment. The number of GFP-LC3 puncta was quantified using ImageJ software. (n = 10). Scale bars: 10 μm. g and h Representative electronic micrographs of the autophagosomes or autolysosomes of PANC-1 cells co-transfected with PVT1 overexpression plasmid and/or ATG14 siRNA with or without gemcitabine treatment. Red arrows indicate autophagic structures. The number of autophagic structures per cell was quantified (n = 10). Scale bars: 2 μm. i and j Representative electronic micrographs of the autophagosomes or autolysosomes of PANC-1 cells co-transfected with miR-619-5p mimics and/or ATG14 siRNA with or without gemcitabine treatment. Red arrows indicate autophagic structures. The number of autophagic structures per cell was quantified (n = 10). Scale bars: 2 μm. k and l Western blotting analysis of PANC-1 and ASPC-1 cells after transfection with miR-619-5p mimics with or without ATG14 overexpression was carried out with the indicated antibodies. Data were represented as mean ± SD, *P < 0.05; **P < 0.01; ***P < 0.001
Fig. 8
Fig. 8
PVT1 interacts with ATG14 and promotes PtdIns3K-C1 complex assembly. a The interaction between PVT1 and ATG14 in PANC-1 and ASPC-1 cells was confirmed by RNA pulldown followed by western blotting. b and c qRT-PCR analysis of PVT1 following RNA immunoprecipitation (RIP) assays in PANC-1 and ASPC-1 cells using anti-ATG14 antibody. RNA enrichment was determined relative to the IgG control. U6 was used as a non-specific control. d and e The interaction between PIK3C3 and ATG14 or BECN1 after PVT1 knockdown in PANC-1 cells. Immunoprecipitated endogenous PIK3C3 was quantified using Image Lab software and normalized against the amount of PIK3C3 in whole-cell lysates. f and g The interaction between PIK3C3 and ATG14 or BECN1 after PVT1 overexpression and/or miR-619-5p co-transfection in PANC-1 cells with or without gemcitabine (1 μM) treatment. Immunoprecipitated endogenous PIK3C3 was quantified using Image Lab software and normalized against the amount of PIK3C3 in whole-cell lysates. h The interaction between Bcl2 and BECN1 after PVT1 overexpression in PANC-1 cells with or without gemcitabine (1 μM) treatment. Immunoprecipitated endogenous Bcl2 was quantified using Image Lab software and normalized against the amount of PIK3C3 in whole-cell lysates. i The interaction between PIK3C3 and BECN1 after the overexpression of miR-619-5p mimics in PANC-1 cells with or without gemcitabine (1 μM) treatment. Immunoprecipitated endogenous PIK3C3 was quantified using Image Lab software and normalized against the amount of PIK3C3 in whole-cell lysates. j-l Different PtdIns3K-C1 complex components were immunoprecipitated from PANC-1 and ASPC-1 cells overexpressing PVT1 or miR-619-5p mimics with or without gemcitabine (1 μM) treatment with ATG14 antibody. PIK3C3 activity was measured by analyzing PtdIns3P production using ELISA as described in the Materials and Methods section. The fold change in PtdIns3P activity was calculated based on the concentration of PtdIns3P and normalized to the amount of ATG14 used in the assay. m and n Representative confocal images of GFP-ZFYVE1 puncta in control or PVT1- or miR-619-5p-transfected PANC-1 cells with or without gemcitabine induction. The numbers of GFP-ZFYVE1 puncta was quantified (n = 10). Scale bars: 10 μm. Data were represented as mean ± SD, *P < 0.05; **P < 0.01; ***P < 0.001
Fig. 9
Fig. 9
miR-619-5p reverse the effects of PVT1 on gemcitabine resistant in pancreatic cancer cells. a-d PANC-1 cells were co-transfected with the indicated vectors/siRNAs/miR-619-5p and treated with gemcitabine at different concentrations for 48 h, after which cell viability was measured by MTT assay. e and f Colony formation assays were performed in PANC-1 cells after co-transfection with PVT1 and/or miR-619-5p mimics. g-j PANC-1 cells were co-transfected with the indicated vectors/siRNAs/miR-619-5p and treated with gemcitabine for 48 h, after which the apoptotic cells were analyzed by TUNEL assay, and the number of TUNEL-positive cells was quantified. Scale bars: 100 μm. k and l The caspase-3/7 activities of PANC-1 cells co-transfected with the indicated vectors/siRNAs/miR-619-5p and treated with gemcitabine were measured with a Caspase-Glo® 3/7 assay kit. Data were represented as mean ± SD, *P < 0.05; **P < 0.01; ***P < 0.001
Fig. 10
Fig. 10
Schematic illustration depicting a proposed model of the molecular mechanism of PVT1 in gemcitabine resistance in human pancreatic cancer

References

    1. Siegel RL, Miller KD, Jemal A. Cancer statistics, 2018. CA Cancer J Clin. 2018;68:7–30. - PubMed
    1. Rothenberg ML. New developments in chemotherapy for patients with advanced pancreatic cancer. Oncology (Williston Park) 1996;10:18–22. - PubMed
    1. Conroy T, Hammel P, Hebbar M, Ben Abdelghani M, Wei AC, Raoul JL, Chone L, Francois E, Artru P, Biagi JJ, et al. FOLFIRINOX or gemcitabine as adjuvant therapy for pancreatic Cancer. N Engl J Med. 2018;379:2395–2406. - PubMed
    1. Ghosal S, Das S, Chakrabarti J. Long noncoding RNAs: new players in the molecular mechanism for maintenance and differentiation of pluripotent stem cells. Stem Cells Dev. 2013;22:2240–2253. - PMC - PubMed
    1. Zhang A, Zhao JC, Kim J, Fong KW, Yang YA, Chakravarti D, Mo YY, Yu J. LncRNA HOTAIR enhances the androgen-receptor-mediated transcriptional program and drives castration-resistant prostate Cancer. Cell Rep. 2015;13:209–221. - PMC - PubMed

Publication types

MeSH terms