. 2020 Jul 30;18(1):240.
doi: 10.1186/s12916-020-01698-4.

Impact of lockdown on COVID-19 epidemic in Île-de-France and possible exit strategies

Affiliations

Impact of lockdown on COVID-19 epidemic in Île-de-France and possible exit strategies

Laura Di Domenico et al. BMC Med. .

Abstract

Background: More than half of the global population is under strict forms of social distancing. Estimating the expected impact of lockdown and exit strategies is critical to inform decision makers on the management of the COVID-19 health crisis.

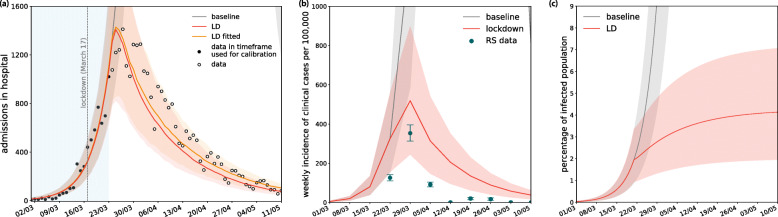
Methods: We use a stochastic age-structured transmission model integrating data on age profile and social contacts in Île-de-France to (i) assess the epidemic in the region, (ii) evaluate the impact of lockdown, and (iii) propose possible exit strategies and estimate their effectiveness. The model is calibrated to hospital admission data before lockdown. Interventions are modeled by reconstructing the associated changes in the contact matrices and informed by mobility reductions during lockdown evaluated from mobile phone data. Different types and durations of social distancing are simulated, including progressive and targeted strategies, with large-scale testing.

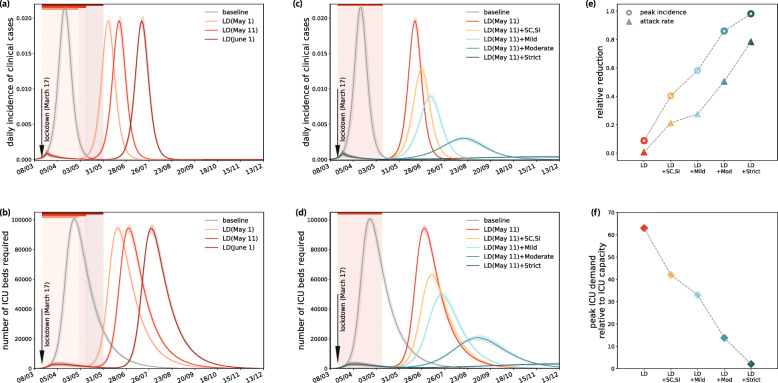
Results: We estimate the reproductive number at 3.18 [3.09, 3.24] (95% confidence interval) prior to lockdown and at 0.68 [0.66, 0.69] during lockdown, thanks to an 81% reduction of the average number of contacts. Model predictions capture the disease dynamics during lockdown, showing the epidemic curve reaching ICU system capacity, largely strengthened during the emergency, and slowly decreasing. Results suggest that physical contacts outside households were largely avoided during lockdown. Lifting the lockdown with no exit strategy would lead to a second wave overwhelming the healthcare system, if conditions return to normal. Extensive case finding and isolation are required for social distancing strategies to gradually relax lockdown constraints.

Conclusions: As France experiences the first wave of COVID-19 pandemic in lockdown, intensive forms of social distancing are required in the upcoming months due to the currently low population immunity. Extensive case finding and isolation would allow the partial release of the socio-economic pressure caused by extreme measures, while avoiding healthcare demand exceeding capacity. Response planning needs to urgently prioritize the logistics and capacity for these interventions.

Keywords: COVID-19; Exit strategies; Lockdown; Mathematical modeling; Non-pharmaceutical interventions; Reproductive number; Social distancing.


Conflict of interest statement

We declare no competing interests.

Figures

Fig. 1
Fig. 1
a Number of hospitalizations per 100,000 inhabitants per region in France as of April 2, 2020 [15]. b Number of ICU beds in Île-de-France and increase of capacity over time [16]. c Age profile in Île-de-France region corresponding to younger children, teenagers, adults, seniors (0, 11; 11, 19; 19, 65; and 65+ years old, respectively). d Contact matrices in the baseline scenario (no intervention) obtained from data [17] (left) and estimated for lockdown (right)
Fig. 2
Fig. 2
Compartmental model. S, susceptible; E, exposed; Ip, infectious in the prodromic phase (the length of time including E and Ip stages is the incubation period); Ia, asymptomatic infectious; Ips, paucysymptomatic infectious; Ims, symptomatic infectious with mild symptoms; Iss, symptomatic infectious with severe symptoms; ICU, severe case admitted to ICU; H, severe case admitted to the hospital but not in intensive care; R, recovered; D, deceased
Fig. 3
Fig. 3
Scenarios (color code as in Table 1; CI refers to case isolation)
Fig. 4
Fig. 4
Calibration of the model and estimates of weekly incidence and percentage of population infected. a Calibration of the model on data of daily hospital admissions in Île-de-France prior to lockdown, and projections for the lockdown phase. Black dots indicate data in the timeframe used for calibration, also indicated by the region in light blue; white dots indicate data in the prediction timeframe. Our model predictions are compared to results obtained by fitting out model also in the lockdown phase (orange line for the median curve). b Simulated weekly incidence of clinical cases (mild and severe) compared to estimates of COVID-19-positive cases in the region provided by syndromic and virological surveillance (Reseau Sentinelles (RS) data) [42]. c Simulated percentage of population infected over time. Results are shown for pa= 0.2. Shaded areas correspond to 95% CI
Fig. 5
Fig. 5
Lockdown projections compared to data. a Simulated daily incidence of admissions in ICU over time. b Simulated number of ICU beds occupied during lockdown. In panels a and b, black dots indicate data in the timeframe used for calibration (fit to hospital admission data before lockdown, see Fig. 4) and white dots indicate data in the prediction timeframe. c Simulated number of ICU beds occupied assuming a less stringent lockdown, under the reduction of contacts measured in the UK [45] (73%), and a more stringent lockdown, under the reduction of contacts measured in China [46] (90%). The median prediction of our model is also shown for comparison (red curve). d Simulated number of ICU beds occupied resulting from considering the inclusion of physical contacts during lockdown. The median prediction of our model is also shown for comparison (red curve). In all plots, vertical dashed line refers to the start of the lockdown, horizontal lines refer to ICU capacity in the region (see Fig. 1b), and shaded areas correspond to 95% probability ranges. Results are shown for pa= 0.2
Fig. 6
Fig. 6
Simulated impact of lockdown of different durations and exit strategies. a Simulated daily incidence of clinical cases assuming lockdown till end of April, May 11, and end of May. b Corresponding demand of ICU beds. c Simulated daily incidence of clinical cases assuming lockdown till May 11, followed by interventions of varying degree of intensity. d Corresponding demand of ICU beds. e Relative reduction of peak incidence and epidemic size after 1 year for each scenario. f Peak ICU demand relative to restored ICU capacity of the region (1500 beds). In all panels, the color code is as in Table 1, and scenarios are identified as reported in Fig. 3. Vertical colored areas indicate the time period of lockdown under the different measures. Baseline scenario corresponds to no intervention. Results are shown for pa= 0.2. Shaded areas correspond to 95% probability ranges
Fig. 7
Fig. 7
Simulated impact of lockdown and exit strategies with large-scale testing and case isolation. a Simulated daily new number of clinical cases assuming the progressive exit strategies illustrated in Fig. 3. b Corresponding demand of ICU beds. c As in a with exit strategies implemented after a lockdown till the end of May. d Corresponding demand of ICU beds

References

    1. Coronavirus: près de la moitié du monde en confinement, l’épidémie s’étend. AFP.com. https://www.afp.com/fr/infos/334/coronavirus-pres-de-la-moitie-du-monde-.... Accessed 28 Mar 2020.
    1. Epicentre. COVID-19 Epi Dashboard. https://reports.msf.net/public/covid19/. Accessed 5 Apr 2020.
    1. Info Coronavirus COVID-19 - Stratégie de déconfinement. Gouvernement.fr. https://www.gouvernement.fr/info-coronavirus/strategie-de-deconfinement. Accessed 4 May 2020.
    1. WHO. Report of the WHO-China Joint Mission on Coronavirus Disease 2019 (COVID-19). https://www.who.int/docs/default-source/coronaviruse/who-china-joint-mis.... Accessed 18 Mar 2020.
    1. Kraemer MUG, Yang C-H, Gutierrez B, et al. The effect of human mobility and control measures on the COVID-19 epidemic in China. Science. 2020;368:493–497. doi: 10.1126/science.abb4218. - DOI - PMC - PubMed

Publication types