. 2020 Jul 29;8(1):119.
doi: 10.1186/s40478-020-00988-5.

Different effects of constitutive and induced microbiota modulation on microglia in a mouse model of Alzheimer's disease

Affiliations

Different effects of constitutive and induced microbiota modulation on microglia in a mouse model of Alzheimer's disease

Charlotte Mezö et al. Acta Neuropathol Commun. .

Abstract

It was recently revealed that gut microbiota promote amyloid-beta (Aβ) burden in mouse models of Alzheimer's disease (AD). However, the underlying mechanisms when using either germ-free (GF) housing conditions or treatments with antibiotics (ABX) remained unknown. In this study, we show that GF and ABX-treated 5x familial AD (5xFAD) mice developed attenuated hippocampal Aβ pathology and associated neuronal loss, and thereby delayed disease-related memory deficits. While Aβ production remained unaffected in both GF and ABX-treated 5xFAD mice, we noticed in GF 5xFAD mice enhanced microglial Aβ uptake at early stages of the disease compared to ABX-treated 5xFAD mice. Furthermore, RNA-sequencing of hippocampal microglia from SPF, GF and ABX-treated 5xFAD mice revealed distinct microbiota-dependent gene expression profiles associated with phagocytosis and altered microglial activation states. Taken together, we observed that constitutive or induced microbiota modulation in 5xFAD mice differentially controls microglial Aβ clearance mechanisms preventing neurodegeneration and cognitive deficits.

Keywords: Alzheimer’s disease; Antibiotics; Germ-free; Gut microbiota; Microglia.


Conflict of interest statement

The authors declare no competing interests.

Figures
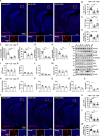
Fig. 1
Fig. 1
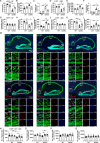
Absence of host microbiota reduces hippocampal Aβ depositions of 5xFAD mice. (a) Representative fluorescence images of thiazine red+ (TR; red) compact Aβ plaques in the hippocampus of 4 months old SPF, GF and ABX-treated 5xFAD mice. Nuclei were stained with DAPI (blue). Overview of hippocampus and magnification of subiculum (dashed line) are shown. Scale bars represent 300 μm (overview) and 50 μm (insert). (b) Quantification of the number of TR+ Aβ-plaques per mm2, (c) percentage of TR+ area and (d) average TR+ plaque size (μm2) in coronal hippocampal sections. Each symbol represents one mouse. Data are presented as mean ± s.e.m. Significant differences were determined by one-way ANOVA followed by Tukey’s post-hoc comparison test (*P < 0.05, **P < 0.01, ***P < 0.001). Data are representative of four independent experiments. Enzyme-linked immunosorbent assay (ELISA) for (e) insoluble Aβ42, (f) insoluble Aβ40, (g) soluble Aβ42 and (h) soluble Aβ40 fractions of hippocampal brain extracts from 4 months old SPF, GF and ABX-treated 5xFAD mice. Each symbol represents one mouse. Data are presented as mean ± s.e.m. Significant differences were determined by one-way ANOVA followed by Tukey’s post-hoc comparison test (**P < 0.01, ***P < 0.001). Data are representative of two independent experiments. (i) Representative immunoblots of hippocampal brain homogenates from 4 months old SPF, GF and ABX-treated 5xFAD mice against human full-length amyloid precursor protein (APP-FL), C-terminal fragment (CTF) α, CTF-β, β-site of APP cleaving enzyme (BACE) 1, A Disintegrin And Metalloproteinase (ADAM10), γ-secretase complex (Nicastrin, presenilin enhancer (PEN) 2, Presenilin (PS) 1, PS2) and Aβ (6E10). β-Actin was used as loading control. Each lane represents one mouse. Quantification of (j) APP-FL, (k), CTF-β, (l) CTF-α, (m) BACE1, (n) ADAM10, (o) PS1, (p) PS2, (q) PEN2, (r) Nicastrin, and (s) Aβ protein levels normalized to β-Actin are shown. Each symbol represents one mouse. Data are presented as mean ± s.e.m. Significant differences were determined by one-way ANOVA followed by Tukey’s post-hoc comparison test (*P < 0.05). Data are representative of two independent experiments. (t) Representative fluorescence images of TR+ compact Aβ plaques in the hippocampus of 10 months old 5xFAD mice. Nuclei were stained with DAPI (blue). Overview of hippocampus and magnification of subiculum (dashed line) are shown. Scale bars represent 300 μm (overview) and 50 μm (insert). (u) Quantification of the number of TR+ Aβ-plaques per area (mm2), (v) percentage of TR+ area and (w) average of TR+ plaque size (μm2). Each symbol represents one mouse. Data are presented as mean ± s.e.m. Significant differences were determined by one-way ANOVA followed by Tukey’s post-hoc comparison test (**P < 0.01, ***P < 0.001). Data are representative of four independent experiments
Fig. 2
Fig. 2
Restored memory deficits in 5xFAD mice lacking microbes. (a-c) T-maze test performance of 10 months old SPF and GF 5xFAD mice, as well as aged-matched WT controls or (d-f) of 10 months old SPF and ABX 5xFAD mice, as well as WT controls. (g-i) Novel object recognition test (NOR) of 10 months old SPF and GF 5xFAD mice, as well as age-matched WT controls or (j-l) of 10 months old SPF and ABX 5xFAD mice, as well as respective WT controls. Each symbol represents one mouse. Data are presented as mean ± s.e.m. Significant differences were determined by two-way ANOVA followed by Bonferroni’s post-hoc comparison test (*P < 0.05, **P < 0.01, ***P < 0.001). Data are representative of three independent experiments. (m) Representative immunofluorescence images of NeuN+ neurons (green) and TR+ (red) compact Aβ plaques in the subiculum (Sub), cornu ammonis (CA) 1, CA3 and dentate gyrus (DG) of the hippocampus of 10 months old SPF, GF and ABX-treated 5xFAD mice. Nuclei were stained with DAPI (blue). Overview of hippocampus and magnifications of subiculum, CA1, CA3 and DG (dashed lines) are shown. Scale bars represent 200 μm (overview) and 50 μm (inserts). Quantification of the number of NeuN+ neurons per mm2 in the subiculum (n), CA1 (o), CA3 (p) and DG (q) of sagittal hippocampal sections from SPF, GF and ABX-treated 5xFAD and age-matched WT mice. Each symbol represents one mouse. Data are presented as mean ± s.e.m. Significant differences were determined by two-way ANOVA followed by Bonferroni’s post-hoc comparison test (**P < 0.01, ***P < 0.001). Data are representative of two independent experiments
Fig. 3
Fig. 3
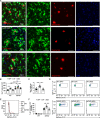
Increased microglial phagocytosis in the hippocampus of 4 months old GF 5xFAD mice. (a) Representative immunofluorescence images of TR+ (red) Aβ depositions and Iba1+ (green) microglia on coronal hippocampal sections of SPF, GF and ABX-treated 5xFAD mice and age-matched WT controls. Nuclei were stained with DAPI (blue). Scale bar: 50 μm. Quantification of (b) Iba1+ parenchymal microglia in hippocampus of 5xFAD and age-matched WT mice. Quantification of (c) TR+ plaque-associated microglia in 5xFAD mice. Each symbol represents one mouse. Data are presented as mean ± s.e.m. Significant differences were determined by two-way ANOVA followed by Bonferroni’s post-hoc comparison test or by one-way ANOVA followed by Tukey’s post-hoc comparison test (**P < 0.01, ***P < 0.001). Data are representative of four independent experiments. (d) Gating of CD11b+methoxy-XO-4+ microglia from SPF, GF and ABX-treated 5xFAD mice and age-matched WT controls. Representative dot plots are shown. (e) Representative cytometric graph of methoxy-X-O4+ labelled microglia from SPF (black line), GF (red line) and ABX-treated (blue line) 5xFAD mice and respective WT controls (dashed lines). (f) Quantification of percentages of methoxy-X-O4+ labelled microglia cells are depicted. Each symbol represents one mouse. Data are presented as mean ± s.e.m. Significant differences were determined by two-way ANOVA followed by Bonferroni’s post-hoc comparison test (***P < 0.001). Data are representative of four independent experiments
Fig. 4
Fig. 4
Altered microglial gene expression profiles in 5xFAD mice housed under GF conditions. (a) Venn diagram depicting the different regulated and overlapping genes between FACS-isolated hippocampal microglia of SPF, GF and ABX-treated 5xFAD animals compared to respective non-transgenic littermates of the same conditions (SPF/GF/ABX). (b) RNA-Seq analysis presenting mRNA expression profile of genes, whose expression was either induced or reduced with an adjusted P value < 0.0001 in hippocampal microglia of SPF, GF and ABX-treated transgenic 5xFAD animals and respective age-matched WT littermates. Representative genes are noted on the right. One column represents microglia from one individual mouse. Three to five mice were investigated per condition. Color code presents z-score (red: upregulated, blue: downregulated). Ingenuity pathway analysis (Qiagen) on differentially expressed genes in hippocampal microglia of SPF (c), GF (d) and ABX-treated (e) 5xFAD animals compared to respective WT littermates of the same housing/treatment conditions (SPF/GF/ABX) based on an RNA-sequencing analysis. Diagram depicts –log(p) value and predicted activation z-scores (red: increased activity, blue: reduced activity; grey: no predicted z-score available). (f) Heatmap of differently expressed genes attributed to the pathway ‘phagosome maturation’ of hippocampal microglia from SPF, GF and ABX-treated transgenic 5xFAD animals and respective age-matched WT littermates. Representative genes are noted on the bottom. One row represents microglia from one individual mouse. Three to five mice were investigated per condition. Color code presents z-score (red: upregulated, blue: downregulated)
Fig. 5
Fig. 5
Altered expression of activation markers in hippocampal microglia from GF 5xFAD mice. Expression levels (counts per million) of (a) ApoE, (b) P2ry12, (c) Clec7a and (d) Itgax in hippocampal microglia from SPF, GF and ABX-treated 5xFAD and age-matched WT mice, based on RNA-seq data depicted in Fig. 4. Each symbol represents one mouse. Data are presented as mean ± s.e.m. (e) Representative immunofluorescence images of Iba1+ (red), P2ry12+ (green) microglia and TR+ (white) Aβ on parasagittal hippocampal sections from SPF, GF and ABX-treated 5xFAD mice. Nuclei were stained with DAPI (blue). Scale bar: 50 μm. White arrowheads indicate P2ry12dim/Iba1+ microglia and non-filled arrowheads show P2ry12bright/Iba1+ microglia. Quantification of the percentage of (f) total parenchymal P2ry12dim/Iba1+ microglia (g) TR+ plaque-associated P2ry12dim/Iba1+ microglia and (h) non-plaque-associated P2ry12dim/Iba1+ microglia in hippocampi of SPF, GF and ABX-treated 5xFAD mice. (i) Representative immunofluorescence images of Iba1+ (red) ApoE+ (green) microglia and TR+ (white) Aβ on parasagittal hippocampal sections from SPF, GF and ABX-treated 5xFAD mice. Nuclei were stained with DAPI (blue). Scale bar: 50 μm. White arrowheads indicate ApoE+/Iba1+ microglia and non-filled arrowheads show ApoE/Iba1+ microglia. Quantification of the percentage of (j) total parenchymal ApoE+/Iba1+ microglia (k) TR+ plaque-associated ApoE+/Iba1+ microglia and (l) non-plaque-associated ApoE+/Iba1+ microglia in hippocampus from SPF, GF and ABX-treated 5xFAD mice. (m) Representative immunofluorescence images of Iba1+ (red) Clec7a+ microglia (green) and TR+ (white) on coronal hippocampal sections from SPF, GF and ABX-treated 5xFAD mice. Nuclei were stained with DAPI (blue). Scale bar: 50 μm. White arrowheads indicate Clec7a+/Iba1+ microglia and non-filled arrowheads show Clec7a/Iba1+ microglia. Quantification of the percentage of (n) total parenchymal Clec7a+/Iba1+ microglia (o) TR+ plaque-associated Clec7a+/Iba1+ microglia and (p) non-plaque-associated Clec7a+/Iba1+ microglia in hippocampus of SPF, GF and ABX-treated 5xFAD mice. Each symbol represents one mouse. At least three slides were examined per individual mouse. Data are presented as mean ± s.e.m. Significant differences were determined by one-way ANOVA (*P < 0.05, **P < 0.01, ***P<0.001). Data are representative of two independent experiments. (q) Representative cytometric graph of CD11c+ labelled microglia from SPF (black line), GF (red line) and ABX-treated (blue line) 5xFAD mice and respective age-matched WT mice (dashed lines), compared to the isotype control (green line). In addition, quantifications of (r) percentages and (s) geometric mean fluorescence intensities (gMFI) of CD11c+ microglia cells are depicted. Each symbol represents one mouse. Data are presented as mean ± s.e.m. Significant differences were determined by two-way ANOVA followed by Bonferroni’s post-hoc comparison test or by one-way ANOVA followed by Tukey’s post-hoc comparison test (*P<0.05, ***P < 0.001). Data are representative of three independent experiments
Fig. 6
Fig. 6
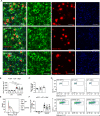
Equalized microglial Aβ phagocytosis in the hippocampus of aged 5xFAD mice. (a) Representative immunofluorescence images of TR (red) and Iba1 (green) on coronal hippocampal sections from 10 months old 5xFAD mice. Nuclei were stained with DAPI (blue). Scale bar: 50 μm. Quantification of (b) Iba1+ parenchymal in hippocampus of 5xFAD and age-matched WT mice. Quantification of (c) TR+ plaque-associated microglia in 5xFAD mice. Each symbol represents one mouse. Data are presented as mean ± s.e.m. Significant differences were determined by two-way ANOVA followed by Bonferroni post-hoc comparison test (**P < 0.01, ***P < 0.001). (d) Gating of CD11b+methoxy-XO4+microglia from SPF, GF and ABX-treated 5xFAD mice and age-matched WT controls. Representative flow cytometric dot plots are shown. (e) Representative cytometric graph of methoxy-X-O4+ labelled microglia from SPF (black line), GF (red line) and ABX-treated (blue line) 5xFAD mice and respective WT controls (dashed lines). (f) Quantification of percentages of methoxy-X-O4+ labelled microglia cells are depicted. Each symbol represents one mouse. Data are presented as mean ± s.e.m.: No significant differences were detected by two-way ANOVA followed by Bonferroni post-hoc comparison test. Data are representative of three independent experiments

References

    1. Andrews S (2019) FastQC: a quality control tool for high throughput sequence data. http://www.bioinformatics.babraham.ac.uk/projects/fastqc
    1. Antunes M, Biala G. The novel object recognition memory: neurobiology, test procedure, and its modifications. Cogn Process. 2012;13:93–110. doi: 10.1007/s10339-011-0430-z. - DOI - PMC - PubMed
    1. Babcock AA, Ilkjaer L, Clausen BH, Villadsen B, Dissing-Olesen L, Bendixen AT, Lyck L, Lambertsen KL, Finsen B. Cytokine-producing microglia have an altered beta-amyloid load in aged APP/PS1 Tg mice. Brain Behav Immun. 2015;48:86–101. doi: 10.1016/j.bbi.2015.03.006. - DOI - PubMed
    1. Blacher E, Bashiardes S, Shapiro H, Rothschild D, Mor U, Dori-Bachash M, Kleimeyer C, Moresi C, Harnik Y, Zur Met al (2019) Potential roles of gut microbiome and metabolites in modulating ALS in mice. Nature 10.1038/s41586-019-1443-5 - PubMed
    1. Brandscheid C, Schuck F, Reinhardt S, Schafer KH, Pietrzik CU, Grimm M, Hartmann T, Schwiertz A, Endres K. Altered gut microbiome composition and Tryptic activity of the 5xFAD Alzheimer's mouse model. J Alzheimers Dis. 2017;56:775–788. doi: 10.3233/JAD-160926. - DOI - PubMed

Publication types

Substances