. 2020 Sep 18;295(38):13338-13352.
doi: 10.1074/jbc.RA120.013988. Epub 2020 Jul 29.

15-Keto-PGE2 acts as a biased/partial agonist to terminate PGE2-evoked signaling

Affiliations

15-Keto-PGE2 acts as a biased/partial agonist to terminate PGE2-evoked signaling

Suzu Endo et al. J Biol Chem. .

Abstract

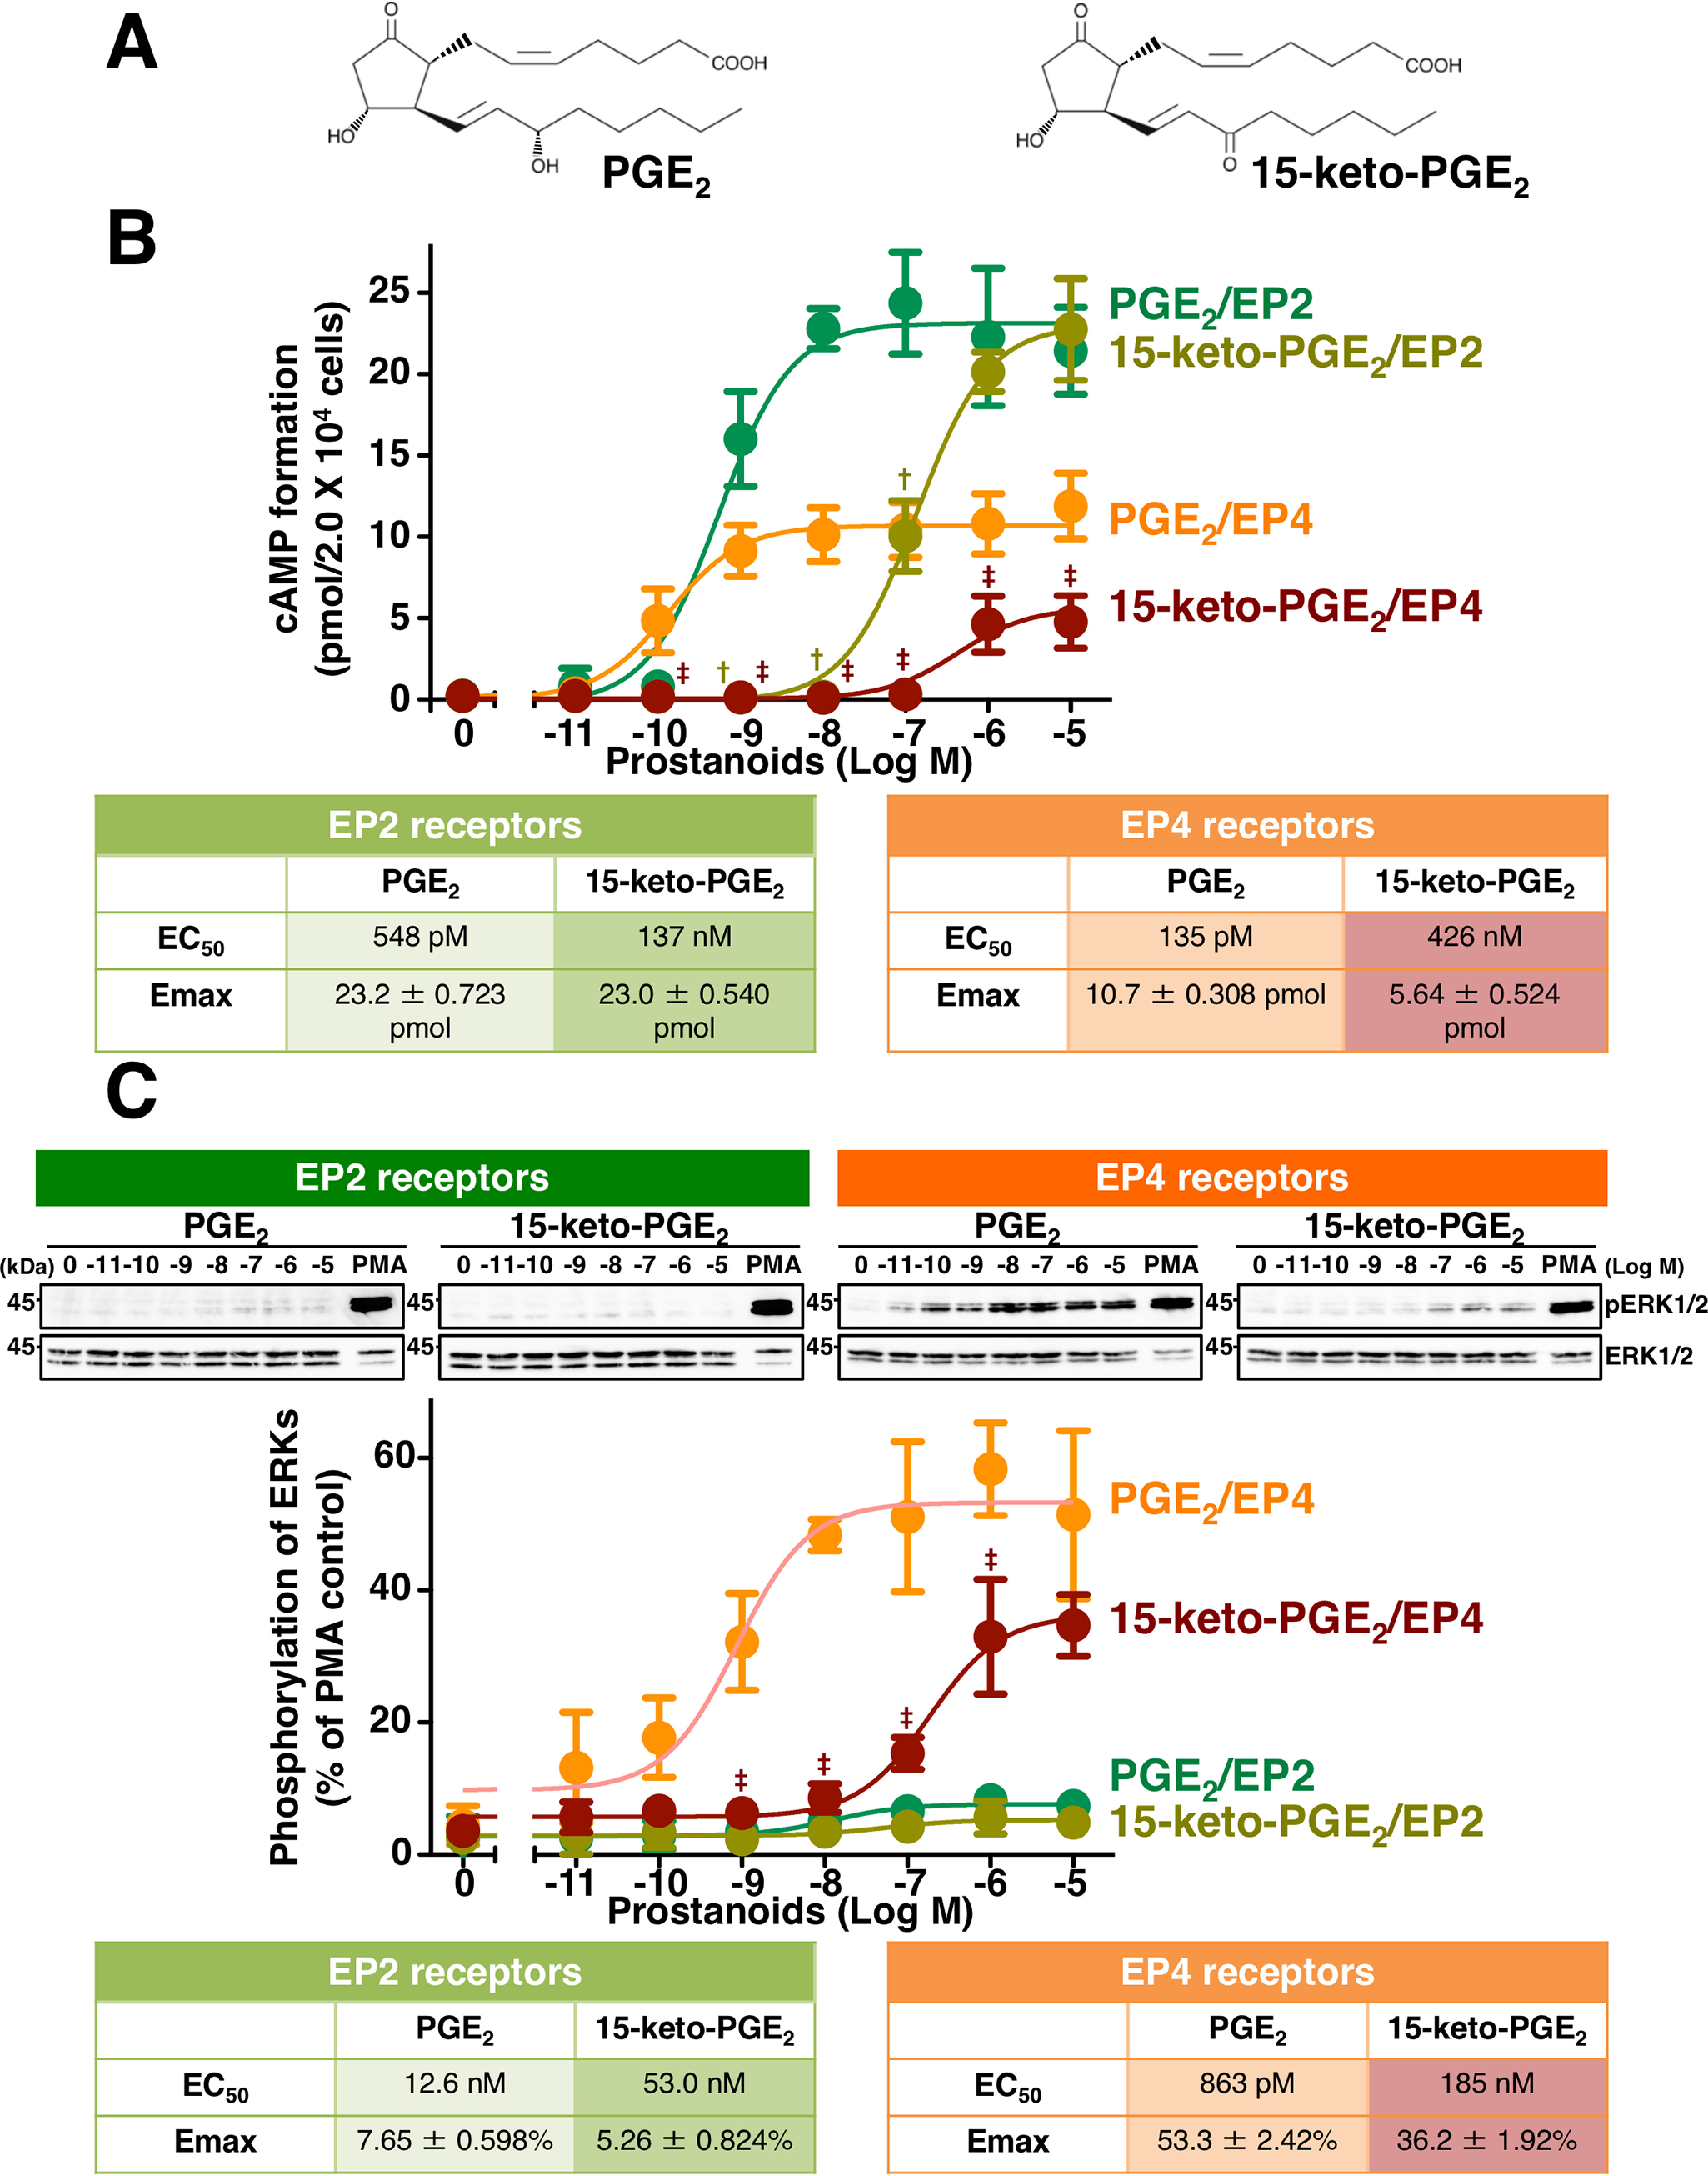
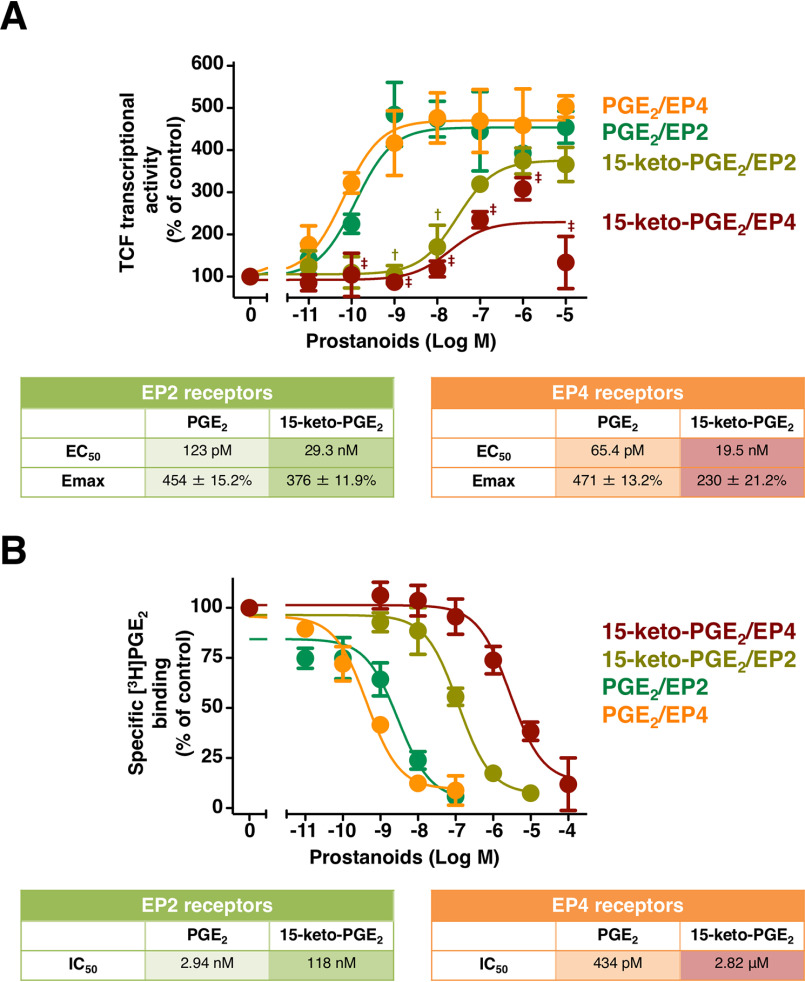
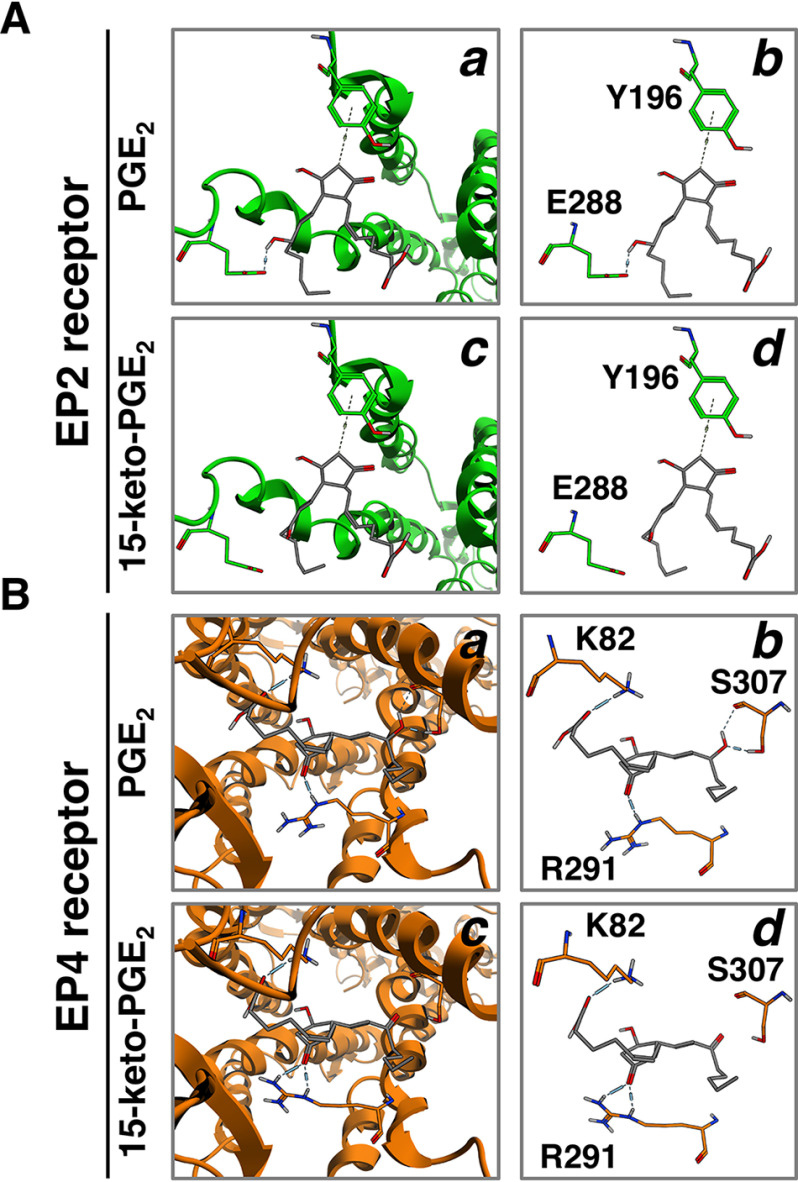
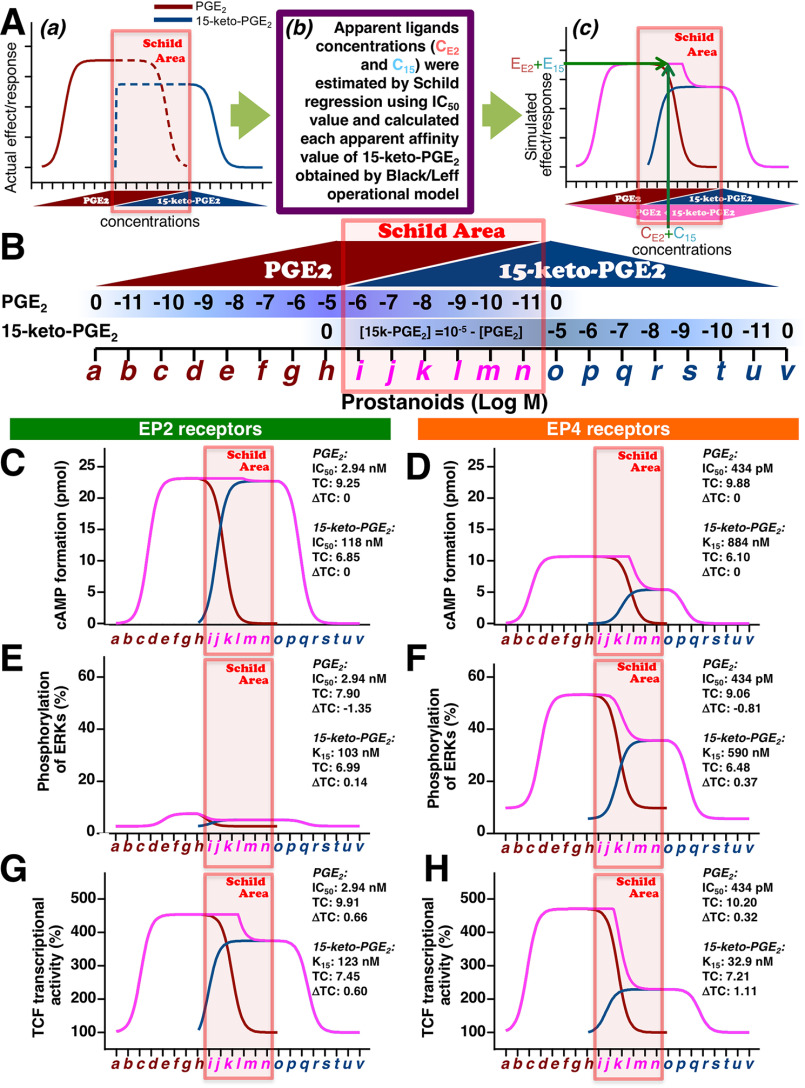
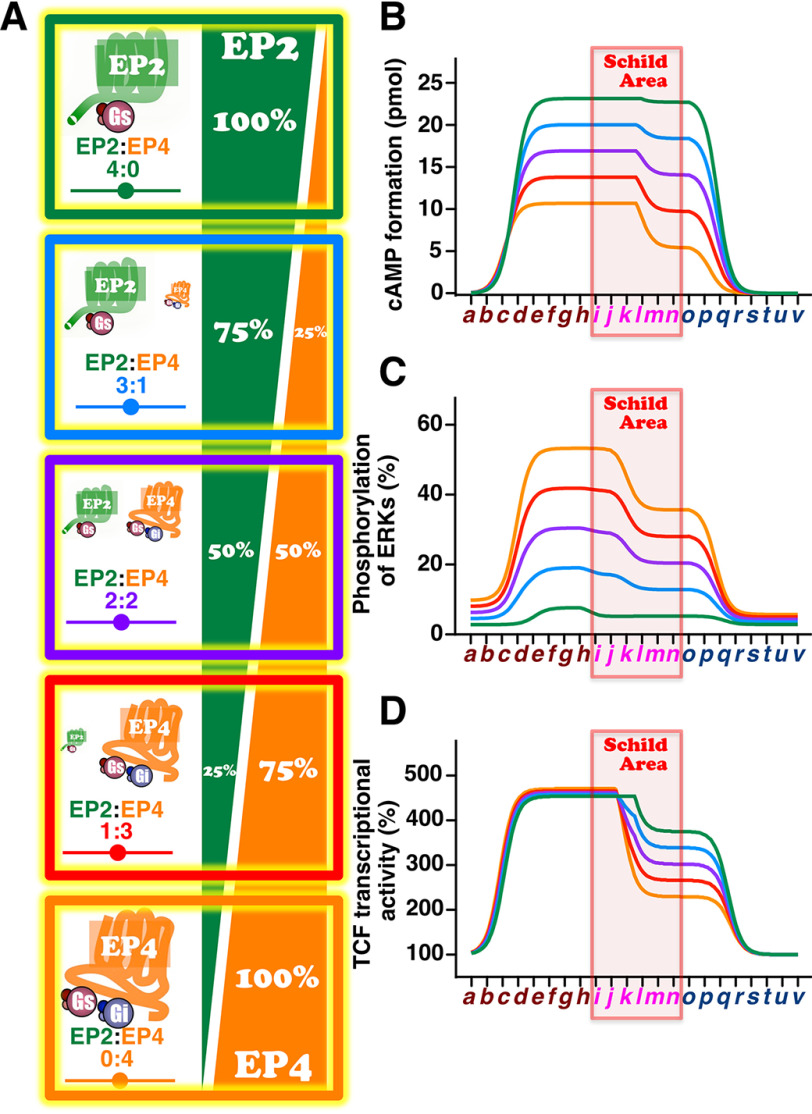
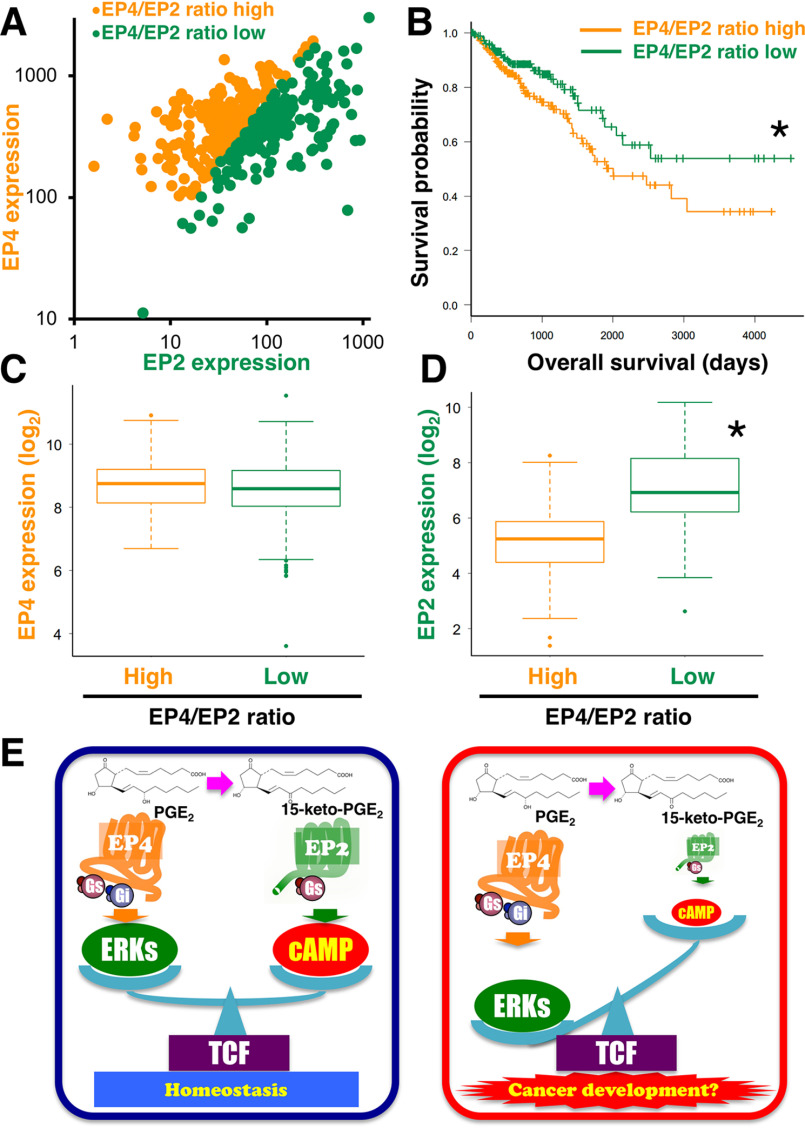
Prostaglandin E2 (PGE2) is well-known as an endogenous proinflammatory prostanoid synthesized from arachidonic acid by the activation of cyclooxygenase-2. E type prostanoid (EP) receptors are cognates for PGE2 that have four main subtypes: EP1 to EP4. Of these, the EP2 and EP4 prostanoid receptors have been shown to couple to Gαs-protein and can activate adenylyl cyclase to form cAMP. Studies suggest that EP4 receptors are involved in colorectal homeostasis and cancer development, but further work is needed to identify the roles of EP2 receptors in these functions. After sufficient inflammation has been evoked by PGE2, it is metabolized to 15-keto-PGE2 Thus, 15-keto-PGE2 has long been considered an inactive metabolite of PGE2 However, it may have an additional role as a biased and/or partial agonist capable of taking over the actions of PGE2 to gradually terminate reactions. Here, using cell-based experiments and in silico simulations, we show that PGE2-activated EP4 receptor-mediated signaling may evoke the primary initiating reaction of the cells, which would take over the 15-keto-PGE2-activated EP2 receptor-mediated signaling after PGE2 is metabolized to 15-keto-PGE2 The present results shed light on new aspects of 15-keto-PGE2, which may have important roles in passing on activities to EP2 receptors from PGE2-stimulated EP4 receptors as a "switched agonist." This novel mechanism may be significant for gradually terminating PGE2-evoked inflammation and/or maintaining homeostasis of colorectal tissues/cells functions.

Keywords: 15-keto-PGE2; EP2 prostanoid receptors; EP4 prostanoid receptors; G-protein–coupled receptor (GPCR); PGE2; Schild regression; biased agonist; biased ligand; bioinformatics; cancer biology; pharmacology; prostaglandin; switched agonist; switched ligand.


Conflict of interest statement

Conflict of interest—The authors declare that they have no conflicts of interest with the contents of this article.

Figures

Figure 1.
Figure 1.
Effects of PGE2 or 15-keto-PGE2 on cAMP formation and the phosphorylation of ERKs in HEK-EP2 and HEK-EP4 cells. A, structures of PGE2 and 15-keto-PGE2. B and C, HEK-EP2 cells or HEK-EP4 cells were treated with vehicle or the indicated concentration of PGE2 or 15-keto-PGE2 for 60 min in the cAMP assay (B) or for 5 min in Western blots detecting the phosphorylation of ERKs (C). The tables show EC50 values and Emax values of PGE2– or 15-keto-PGE2–stimulated formation of cAMP (B) or phosphorylation of ERKs (C) in HEK-EP2 or HEK-EP4 cells. The amounts of cAMP formed are shown in pmol/2.0 × 104 cells/sample and are the mean ± S.E. (error bars) of at least three independent experiments, each performed in duplicate (B). Data are normalized to 10 nm PMA-stimulated phosphorylation of ERKs as 100% and are the mean ± S.D. (error bars) of at least three independent experiments (C). †, p < 0.05: analysis of variance for 15-keto-PGE2 significantly different from the corresponding concentrations of PGE2 in HEK-EP2 cells. ‡, p < 0.05: analysis of variance for 15-keto-PGE2 significantly different from the corresponding concentrations of PGE2 in HEK-EP4 cells.
Figure 2.
Figure 2.
Effects of PGE2 or 15-keto-PGE2 on β-catenin/TCF–mediated luciferase transcriptional activities and the competitive whole-cell radioligand binding of [3H]PGE2 in HEK-EP2 and HEK-EP4 cells. A, HEK-EP2 or HEK-EP4 cells were treated with vehicle or the indicated concentration of PGE2 or 15-keto-PGE2 for 16 h for the β-catenin/TCF–mediated luciferase assay. The table shows EC50 values and Emax values of PGE2– or 15-keto-PGE2–stimulated β-catenin/TCF–mediated luciferase activities in HEK-EP2 or HEK-EP4 cells. B, HEK-EP2 or HEK-EP4 cells were trypsinized and resuspended in MES buffer, and cell samples were then treated with vehicle or the indicated concentration of PGE2 or 15-keto-PGE2 for 120 min, followed by washing, and were then assayed for specific binding for [3H]PGE2. The table shows IC50 values obtained from the PGE2– or 15-keto-PGE2–competitive [3H]PGE2 radioligand whole-cell binding assay in HEK-EP2 or HEK-EP4 cells. Data are normalized to each vehicle-treated control as 100% and are the mean ± S.E. (error bars) of at least three independent experiments, each performed in duplicate (A and B). †, p < 0.05: analysis of variance for 15-keto-PGE2 significantly different from the corresponding concentrations of PGE2 in HEK-EP2 cells. ‡, p < 0.05: analysis of variance for 15-keto-PGE2 significantly different from the corresponding concentrations of PGE2 in HEK-EP4 cells.
Figure 3.
Figure 3.
Binding models of EP2 receptors (A) or EP4 receptors (B) with PGE2 or 15-keto-PGE2. Shown are molecular interactions within PGE2 (a), 15-keto-PGE2 (c), or the binding cavity of the EP2 receptor (A) or EP4 receptor (B). Shown is a schematic representation of hydrogen-bonding interactions between PGE2 (b) or 15-keto-PGE2 (d) and Tyr-196 and Glu-288 of the EP2 receptor (A) or Lys-82, Arg-291, and Ser-307 of the EP4 receptor (B). Dashed lines, hydrogen bonds.
Figure 4.
Figure 4.
The simulated total effects/responses of cAMP, phosphorylation of ERKs, and TCF-mediated transcriptional activities of EP2 and EP4 receptors evoked by PGE2 followed by 15-keto-PGE2. A, schematic methods to estimate the apparent affinities by operational model followed by Schild regression analysis simulation based on the obtained experimental data, including IC50 values. a, as illustrated, the regressed best-fit concentration-effect/response curves based on EC50 values and Emax values obtained in Figs. 1 (B and C) and 2A. The increase of PGE2 reached the maximal concentration (solid wine-red line) and was assumed to decrease in the reverse way of increment (dashed wine-red line). The curves of the regressed best-fit concentration-effect/response of 15-keto-PGE2 were plotted in reverse order, from left to right as 10−5 to 0 m (blue-gray line). Accompanying the decrease in the concentration of PGE2 (dashed wine-red line), 15-keto-PGE2 was increased based on the formula, [15-keto-PGE2] = 10−5 − [PGE2], and it reached the maximal concentration when all PGE2 had been completely metabolized to 15-keto-PGE2 (dashed blue-gray line), followed by the reduction (solid blue-gray line). Because those prostanoids could compete with each other at each receptor during the period when PGE2 was metabolized to 15-keto-PGE2 (dashed lines), because both prostanoids concomitantly exist in the same environment, the apparent concentrations of each prostanoid competing with either EP2 or EP4 receptors were calculated by Schild regression analysis as described under “Experimental procedures” (Schild Area). b, apparent concentrations of PGE2 (CE2) and 15-keto-PGE2 (C15) were estimated by Schild regression using actual results of Figs. 1 (B and C) and 2A with IC50 values of PGE2 and 15-keto-PGE2 obtained in Fig. 2B, and each apparent affinity value of 15-keto-PGE2 was determined by the Black/Leff operational model calculation (K15). c, the effect/response of PGE2 (EE2) for PGE2 at the concentration of CE2 and effect/response of 15-keto-PGE2 (E15) for 15-keto-PGE2 at the concentration of C15 were estimated from each regressed best-fit curve obtained in Figs. 1 (B and C) and 2A. Total effect/response in the Schild area, which was combined EE2 and E15, was plotted to the corresponding concentration of CE2 and C15 (pink-violet line). B, schema of the increase or decrease of PGE2 and 15-keto-PGE2, where the area in which both prostanoids exist is named the Schild area, from ∼10−6 to 10−11 m PGE2 and corresponding 15-keto-PGE2. Shown are the simulated total amounts of cAMP formation (C and D), phosphorylated ERKs (E and F), and TCF transcriptional activities (G and H) of EP2 and EP4 receptors with PGE2 followed by 15-keto-PGE2. Wine-red line, PGE2 alone; blue-gray line, 15-keto-PGE2 alone; pink-violet line, PGE2 with 15-keto-PGE2. ΔTC represents each signaling TC – TC of cAMP signaling (set as the standard).
Figure 5.
Figure 5.
Simulations of the effects of altering the ratios of EP2 and EP4 receptors on PGE2 followed by 15-keto-PGE2-stimulated cAMP formation, phosphorylation of ERKs, and TCF transcriptional activations. A, schema of altering the ratios of EP2 and EP4 receptors (EP2/EP4) as 4:0, 3:1, 2:2, 1:3, and 0:4. Shown are the amounts of cAMP formation (B), phosphorylated ERKs (C), and TCF transcriptional activities (D) of EP2 and EP4 receptors with PGE2 followed by 15-keto-PGE2. Green line, EP2/EP4 as 4:0; sky-blue line, EP2/EP4 as 3:1; purple line, EP2/EP4 as 2:2; red line, EP2/EP4 as 1:3; orange line, EP2/EP4 as 0:4.
Figure 6.
Figure 6.
The relationship between the ratio difference of EP2 and EP4 receptors and the possibility of cancer development using the TCGA database and schema of homeostasis or cancer development mechanisms regulated by expression levels of EP2 and EP4 receptors. A, the mRNA expression of 383 colorectal cancer samples, which were extracted from the COADREAD data set, and the mRNA expression ratio of EP4 and EP2 were calculated and plotted. B, with Kaplan–Meier analysis, the probabilities of survival were calculated and plotted between EP4/EP2 ratio-high and ratio-low groups. The expression levels of EP4 receptors (C) and EP2 receptors (D) are shown side by side between high- and low-ratio groups. E, homeostatic mechanism regulated by the expression levels of EP2 and EP4 receptors (left scheme). Relatively higher EP4 receptor–dominated signaling would turn to cancer malignancy signaling, probably by reducing the expression of EP2 receptors (right scheme).

References

    1. Woodward D. F., Jones R. L., and Narumiya S. (2011) International Union of Basic and Clinical Pharmacology. LXXXIII: classification of prostanoid receptors, updating 15 years of progress. Pharmacol. Rev. 63, 471–538 10.1124/pr.110.003517 - DOI - PubMed
    1. Abramovitz M., Adam M., Boie Y., Carrière M., Denis D., Godbout C., Lamontagne S., Rochette C., Sawyer N., Tremblay N. M., Belley M., Gallant M., Dufresne C., Gareau Y., Ruel R., et al. (2000) The utilization of recombinant prostanoid receptors to determine the affinities and selectivities of prostaglandins and related analog. Biochim. Biophys. Acta 1483, 285–293 10.1016/S1388-1981(99)00164-X - DOI - PubMed
    1. Suganami A., Fujino H., Okura I., Yanagisawa N., Sugiyama H., Regan J. W., Tamura Y., and Murayama Y. (2016) Human DP and EP2 prostanoid receptors take on distinct forms depending on the diverse binding of different ligands. FEBS J. 283, 3931–3940 10.1111/febs.13899 - DOI - PubMed
    1. Araki Y., Suganami A., Endo S., Masuda Y., Fukushima K., Regan J. W., Murayama T., Tamura Y., and Fujino H. (2017) PGE1 and E3 show lower efficacies than E2 to β-catenin-mediated activity as biased ligands of EP4 prostanoid receptors. FEBS Lett. 591, 3771–3780 10.1002/1873-3468.12878 - DOI - PubMed
    1. Srivastava S., Verma M., and Henson D. E. (2001) Biomarkers for early detection of colon cancer. Clin. Cancer Res. 7, 1118–1126 - PubMed

Publication types

MeSH terms

Substances

Associated data

LinkOut - more resources