. 2020 Jul 29;10(1):12738.
doi: 10.1038/s41598-020-69539-1.

Assessing the current and potential future distribution of four invasive forest plants in Minnesota, U.S.A., using mixed sources of data

Affiliations

Assessing the current and potential future distribution of four invasive forest plants in Minnesota, U.S.A., using mixed sources of data

Jason R Reinhardt et al. Sci Rep. .

Abstract

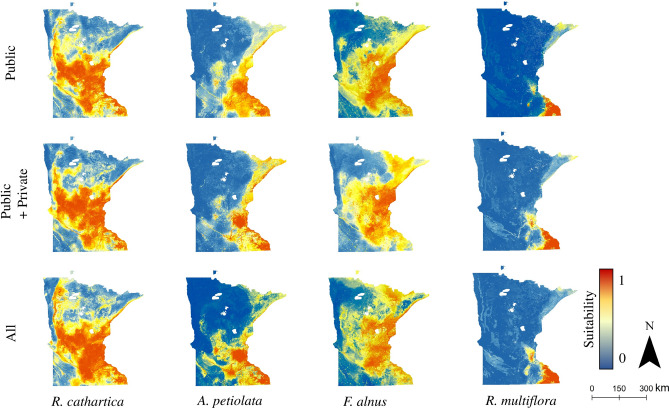
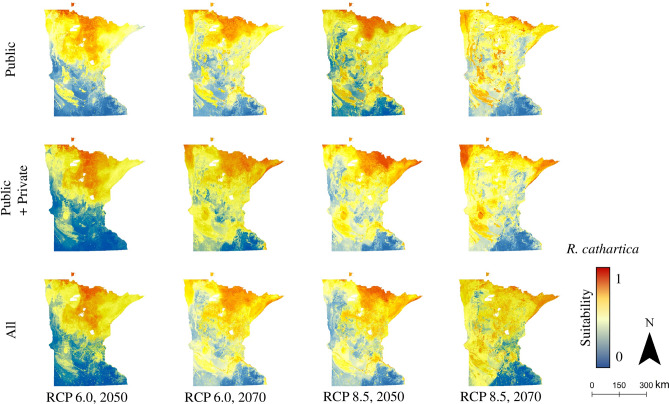
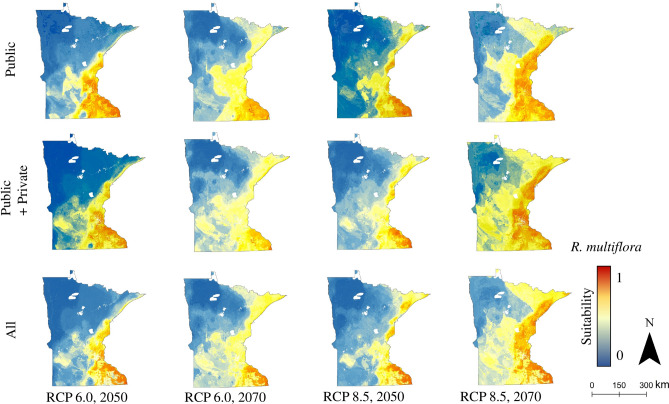
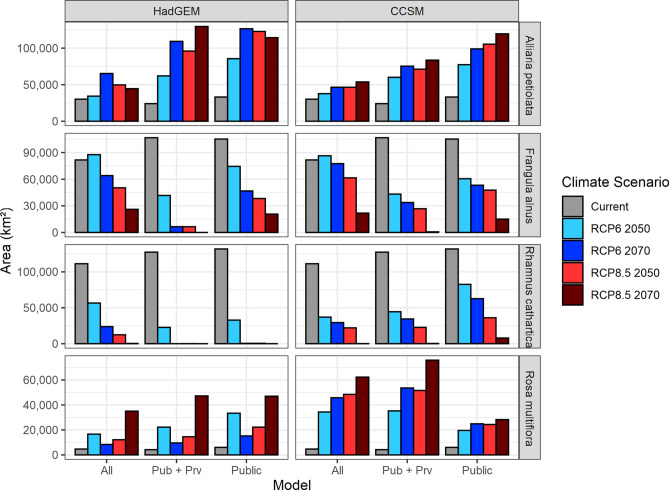
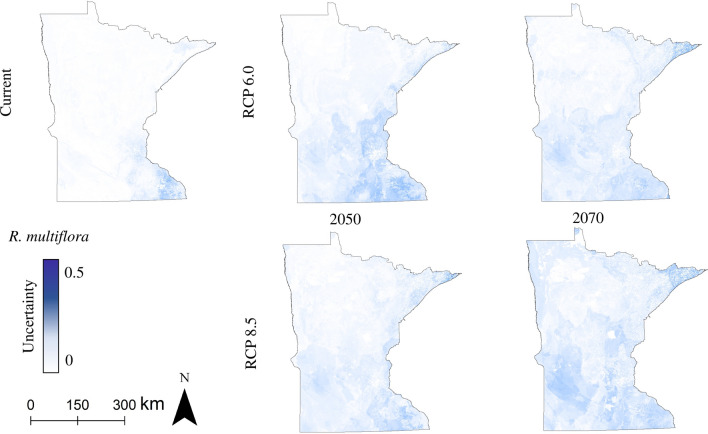
Invasive plants are an ongoing subject of interest in North American forests, owing to their impacts on forest structure and regeneration, biodiversity, and ecosystem services. An important component of studying and managing forest invaders involves knowing where the species are, or could be, geographically located. Temporal and environmental context, in conjunction with spatially-explicit species occurrence information, can be used to address this need. Here, we predict the potential current and future distributions of four forest plant invaders in Minnesota: common buckthorn (Rhamnus cathartica), glossy buckthorn (Frangula alnus), garlic mustard (Alliaria petiolata), and multiflora rose (Rosa multiflora). We assessed the impact of two different climate change scenarios (IPCC RCP 6.0 and 8.5) at two future timepoints (2050s and 2070s) as well as the importance of occurrence data sources on the potential distribution of each species. Our results suggest that climate change scenarios considered here could result in a potential loss of suitable habitat in Minnesota for both buckthorn species and a potential gain for R. multiflora and A. petiolata. Differences in predictions as a result of input occurrence data source were most pronounced in future climate projections.


Conflict of interest statement

The authors declare no competing interests.

Figures

Figure 1
Figure 1
Distribution model (Random Forest) output for all four species, across data source sets. Current climate conditions, based on 30-year normals (Hijmans et al. 2005). Public: models trained based on occurrence data obtained from public (i.e., governmental) sources; Public + Private: models trained on data obtained from public as well as private sources; All: models trained on all available data, regardless of reported source.
Figure 2
Figure 2
R. cathartica distribution model (Random Forest) output across data source sets, for future climate conditions (RCP 6.0 and 8.5, 2050s and 2070s) under the HadGEM climate model. Public: models trained based on occurrence data obtained from public (i.e., governmental) sources; Public + Private: models trained on data obtained from public as well as private sources; All: models trained on all available data, regardless of reported source.
Figure 3
Figure 3
R. multiflora distribution model (Random Forest) output across data source sets, for future climate conditions (RCP 6.0 and 8.5, 2050s and 2070s) under the HadGEM climate model. Public: models trained based on occurrence data obtained from public (i.e., governmental) sources; Public + Private: models trained on data obtained from public as well as private sources; All: models trained on all available data, regardless of reported source.
Figure 4
Figure 4
Mean area (km2) estimates for current and future projections of suitable habitat, across varying climate scenarios using two climate models (HadGEM and CCSM) and across three data sources for four invasive plant species in Minnesota, USA. Public: models trained based on occurrence data obtained from public (i.e., governmental) sources; Pub + Priv: models trained on data obtained from public as well as private sources; All: models trained on all available data, regardless of reported source.
Figure 5
Figure 5
Distribution model uncertainty attributable to data set source, R. cathartica. Uncertainty is quantified as the standard deviation between rasters of different data set sources (Public, Public + Private, All) for all climate scenarios using the HadGEM climate model.
Figure 6
Figure 6
Distribution model uncertainty attributable to data set source, R. multiflora. Uncertainty is quantified as the standard deviation between rasters of different data set sources (Public, Public + Private, All) for all climate scenarios using the HadGEM climate model.

References

    1. Chornesky EA, et al. Science priorities for reducing the threat of invasive species to sustainable forestry. Bioscience. 2005;55:335–348.
    1. Holmes TP, Aukema JE, Von Holle B, Liebhold A, Sills E. Economic impacts of invasive species in forests. Ann. N. Y. Acad. Sci. 2009;1162:18–38. - PubMed
    1. Oswalt CM, Oswalt SN, Clatterbuck WK. Effects of Microstegium Vimineum (Trin.) A. Camus on native woody species density and diversity in a productive mixed-hardwood forest in Tennessee. For. Ecol. Manag. 2007;242:727–732.
    1. Gould AMA, Gorchov DL. Effects of the exotic invasive shrub Lonicera maackii on the survival and fecundity of Three species of Native annuals. Am. Midland Nat. 2000 doi: 10.1674/0003-0031(2000)144[0036:EOTEIS]2.0.CO;2144,36-50. - DOI
    1. Gorchov DL, Trisel DE. Competitive effects of the invasive shrub, Lonicera maackii (Rupr.) Herder (Caprifoliaceae), on the growth and survival of native tree seedlings. Plant Ecol. 2003;166:13–24.

Publication types