. 2020 Jul 29;11(1):3695.
doi: 10.1038/s41467-020-17157-w.

Transcriptional activity and strain-specific history of mouse pseudogenes

Affiliations

Transcriptional activity and strain-specific history of mouse pseudogenes

Cristina Sisu et al. Nat Commun. .

Abstract

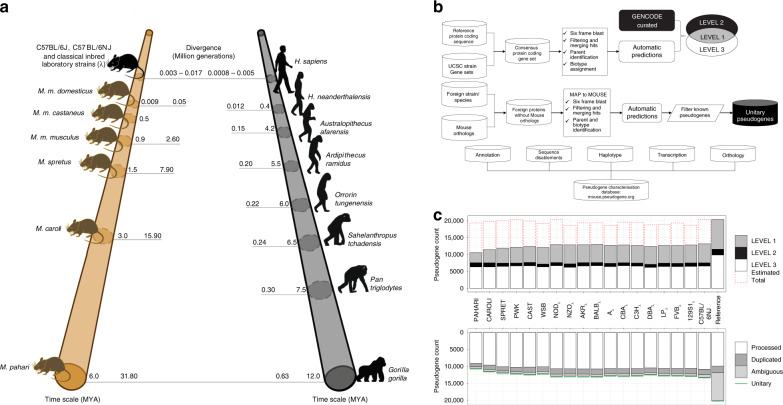
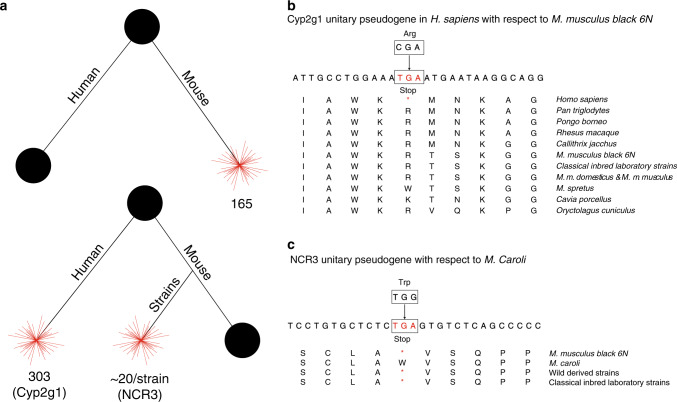
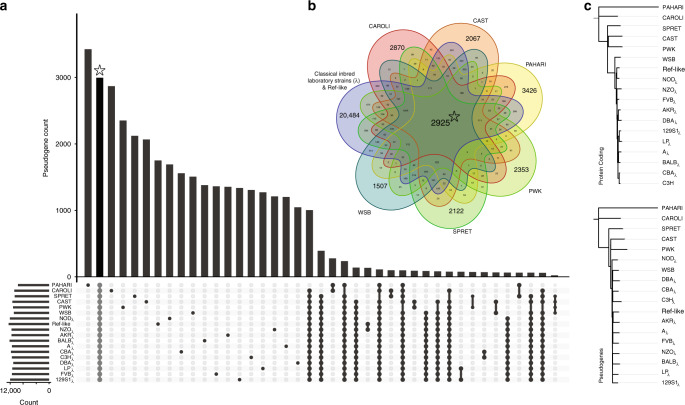
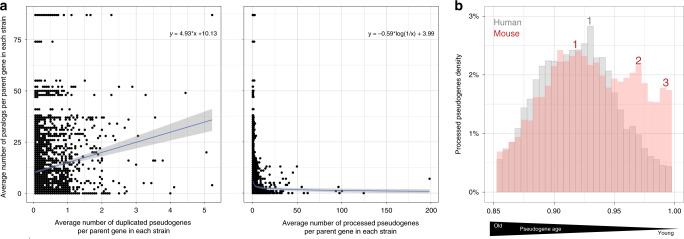
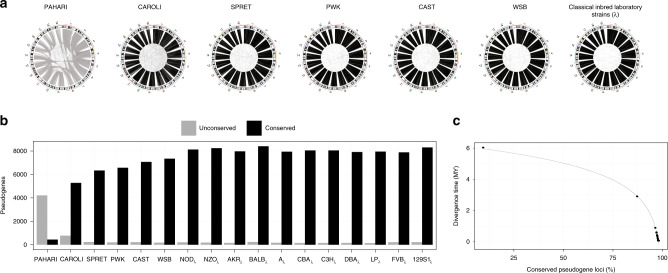
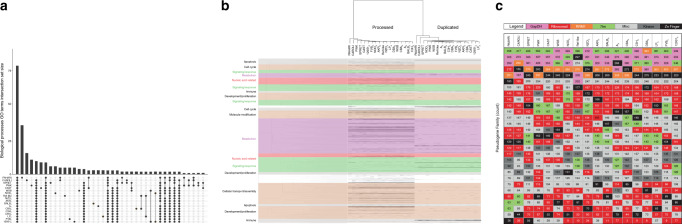
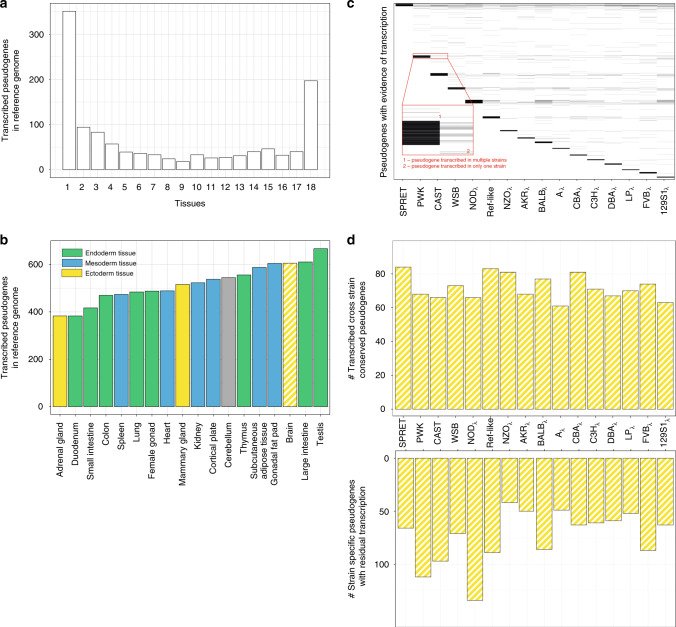
Pseudogenes are ideal markers of genome remodelling. In turn, the mouse is an ideal platform for studying them, particularly with the recent availability of strain-sequencing and transcriptional data. Here, combining both manual curation and automatic pipelines, we present a genome-wide annotation of the pseudogenes in the mouse reference genome and 18 inbred mouse strains (available via the mouse.pseudogene.org resource). We also annotate 165 unitary pseudogenes in mouse, and 303, in human. The overall pseudogene repertoire in mouse is similar to that in human in terms of size, biotype distribution, and family composition (e.g. with GAPDH and ribosomal proteins being the largest families). Notable differences arise in the pseudogene age distribution, with multiple retro-transpositional bursts in mouse evolutionary history and only one in human. Furthermore, in each strain about a fifth of all pseudogenes are unique, reflecting strain-specific evolution. Finally, we find that ~15% of the mouse pseudogenes are transcribed, and that highly transcribed parent genes tend to give rise to many processed pseudogenes.


Conflict of interest statement

The authors declare no competing interests.

Figures

Fig. 1
Fig. 1. Pseudogene annotation.
a Comparison on the evolutionary time scale of the divergence in selected primates and murine taxa. Each point on the primate time scale indicates the split from the human in million years (MYA). Each point on the murine time scale indicates the divergence time for splits among the wild-derived species and strains, and between M. m. domesticus and the classical laboratory inbred strains (denoted by λ). b (top) Pseudogene annotation workflow for mouse strains. b (middle) Unitary pseudogene annotation pipeline. b (bottom) Mouse pseudogene characterisation resource workflow. c Summary of mouse strains’ pseudogene annotation. Level 1 are pseudogenes identified by automatic pipelines and liftover of manual annotation from the reference genome; Level 2 are pseudogenes identified only through the liftover of manually annotated cases from the reference genome; Level 3 are pseudogenes identified only by the automatic annotation pipeline. The total number of pseudogenes in each biotype class and for each confidence level in each strain is available in Supplementary Table 5.
Fig. 2
Fig. 2. Unitary pseudogenes in human and mouse.
a Summary of unitary pseudogenes with respect to human and mouse. The top panel shows the number of pseudogenes created in mouse with functional orthologs in human. The bottom panel shows the average number of pseudogenes that are present in 18 mouse strains and in the human genome with functional orthologs in mouse. The black disc indicates the presence of the functional protein coding gene, while the red star represents the pseudogene. b Cyp2g1 LOF in human. c NCR3 GOF mutation in M. caroli as compared to the reference genome and the other mouse strains.
Fig. 3
Fig. 3. Pangenome distribution of pseudogenes.
a Summary of pseudogene distribution in the pangenome mouse strain dataset. The classical laboratory inbred strains are listed in Supplementary Table 4, and the laboratory inbred ‘reference-like’ strain refers to C57BL/6NJ. The number of pseudogenes in each strain or group of strains is shown in corresponding Venn diagram intersections shown in (b). b 7-way Venn diagram of evolutionarily conserved and group-specific pseudogenes. c Phylogenetic trees for parents of evolutionarily conserved pseudogenes and evolutionary conserved pseudogenes. Bootstrap values are provided in mirror figure (Supplementary Fig. 3g).
Fig. 4
Fig. 4. Pseudogene genesis.
a Relationship between the number of pseudogenes and functional paralogs for a given parent gene (left—duplicated pseudogenes, right—processed pseudogenes). The number of parent genes associated with processed pseudogenes in strains is 11,571, and the number of parent genes associated with duplicated pseudogenes in strains is 3,758. The average number of pseudogenes per parent per strain was obtained by dividing the total number of pseudogenes across all strains by the total number of strains (18). Fitting lines show a vague correlation between the number of functional vs. disabled copies of a gene, with a linear fit for duplicated pseudogenes and a negative logarithmic fit for processed pseudogenes. The grey area is the ±SD (standard deviation) of the fitting line. b Distribution of reference processed pseudogenes (y-axis) in human (n = 8,081) and mouse (n = 9,979) as a function of age (x-axis). The pseudogene age is approximated as sequence similarity to the parent gene.
Fig. 5
Fig. 5. Pseudogene loci conservation across mouse strains.
a CIRCOS-like plots showing the conservation of the pseudogene genomic loci between each mouse strain and the laboratory reference strain C57BL/6NJ. Grey lines indicate a change of the genomic locus between the two strains and connect two different genomic locations (e.g., a pseudogene located on chr7 in C57BL/6NJ and chr1 in M. pahari). Black lines indicate the conservation of the pseudogene locus. b The number of pseudogenes that are preserved or changed their loci between each strain/species and the laboratory reference strain. Associated data is available in Supplementary Table 6. c Strain speciation times as a function of percentage of conserved pseudogene loci between each strain/species and the laboratory reference, fitted by an inverse logarithmic curve.
Fig. 6
Fig. 6. Functional analysis of pseudogenes.
a Distribution of enriched GO biological processes terms across the mouse strains. Associated data is available in Supplementary Data 5. b Heatmap illustrating enrichment of GO biological processes terms across the mouse strains for the parent genes of processed and duplicated pseudogenes. GO terms (rows) are clustered by semantic similarity (colour). Each line in the heatmap indicates the presence of an enriched GO term associated with a strain’s pseudogene complement. The GO terms shown in colour indicate an association with the pseudogene family of similar colour in (c). c Summary of the top 24 Pfam pseudogene families in each mouse strain.
Fig. 7
Fig. 7. Pseudogene transcription and activity.
a Cross-tissue pseudogene transcription in the mouse reference genome. The x-axis indicates the number of tissues in which a pseudogene is transcribed. b Distribution of pseudogene transcription in 18 adult mouse tissues. All data of the transcribed mouse reference genome pseudogenes in the 18 tissues is available in Supplementary Data 6. c Heatmap-like plot showing the distribution of transcribed pseudogenes (y-axis) in brain tissue for each wild-derived and classical laboratory mouse strain (x-axis). Each line corresponds to a transcribed pseudogene with an expression level higher than 2 (FPKM). When a line is present across multiple columns, it is indicative of a pseudogene expressed in all these strains. The dark bars at the top of each strain column are formed by multiple highly expressed pseudogenes. When a line is present in only one strain, and no other line is observed at the same level in any of the other strains, this suggests that the pseudogene expression is strain specific. d (top) Number of transcribed pseudogenes that are conserved across all the strains. d (bottom) Number of transcribed strain-specific pseudogenes in each mouse strain. Data recording the transcribed pseudogenes in brain for each strain is available from Supplementary Data 7.

References

    1. Peters LL, et al. The mouse as a model for human biology: a resource guide for complex trait analysis. Nat. Rev. Genet. 2007;8:58–69. - PubMed
    1. Paigen K. One hundred years of mouse genetics: an intellectual history. I. The classical period (1902-1980) Genetics. 2003;163:1–7. - PMC - PubMed
    1. Paigen K. One hundred years of mouse genetics: an intellectual history. II. The molecular revolution (1981–2002) Genetics. 2003;163:1227–1235. - PMC - PubMed
    1. Yalcin B, Adams DJ, Flint J, Keane TM. Next-generation sequencing of experimental mouse strains. Mamm. Genome. 2012;23:490–498. - PMC - PubMed
    1. Keane TM, et al. Mouse genomic variation and its effect on phenotypes and gene regulation. Nature. 2011;477:289–294. - PMC - PubMed

Publication types