. 2020 Jul 29;11(1):3778.
doi: 10.1038/s41467-020-17552-3.

Ex vivo editing of human hematopoietic stem cells for erythroid expression of therapeutic proteins

Affiliations

Ex vivo editing of human hematopoietic stem cells for erythroid expression of therapeutic proteins

Giulia Pavani et al. Nat Commun. .

Erratum in

Abstract

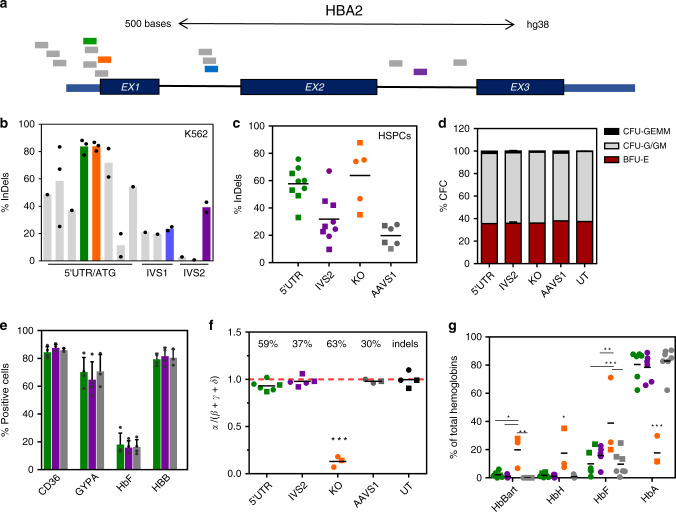
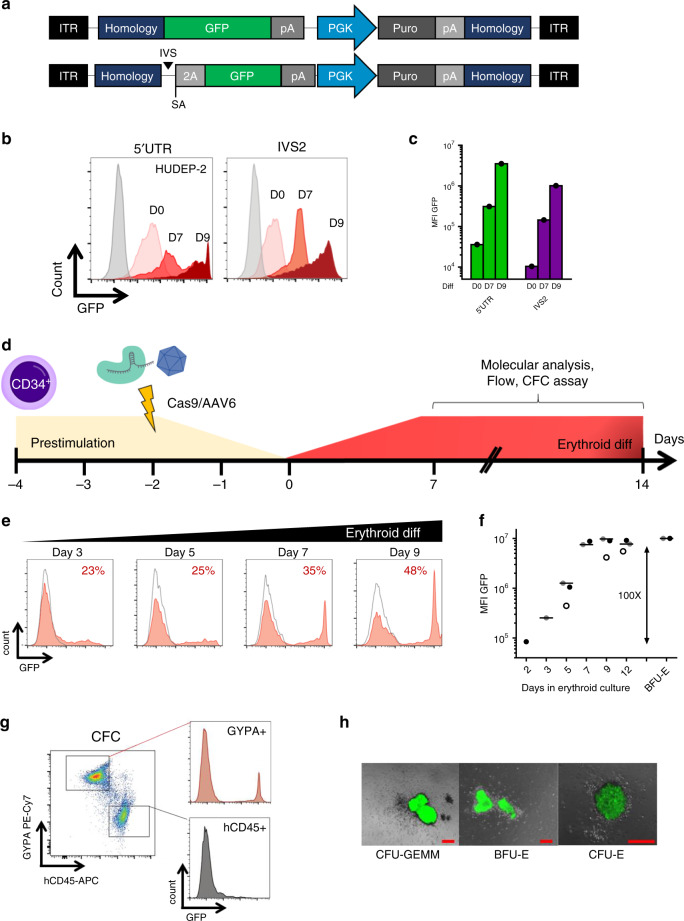
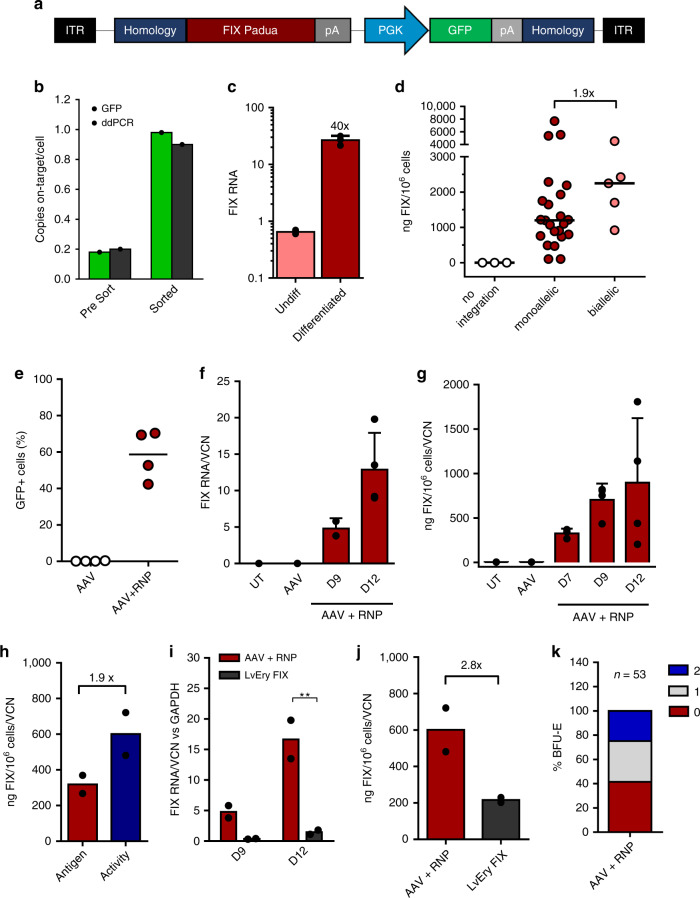
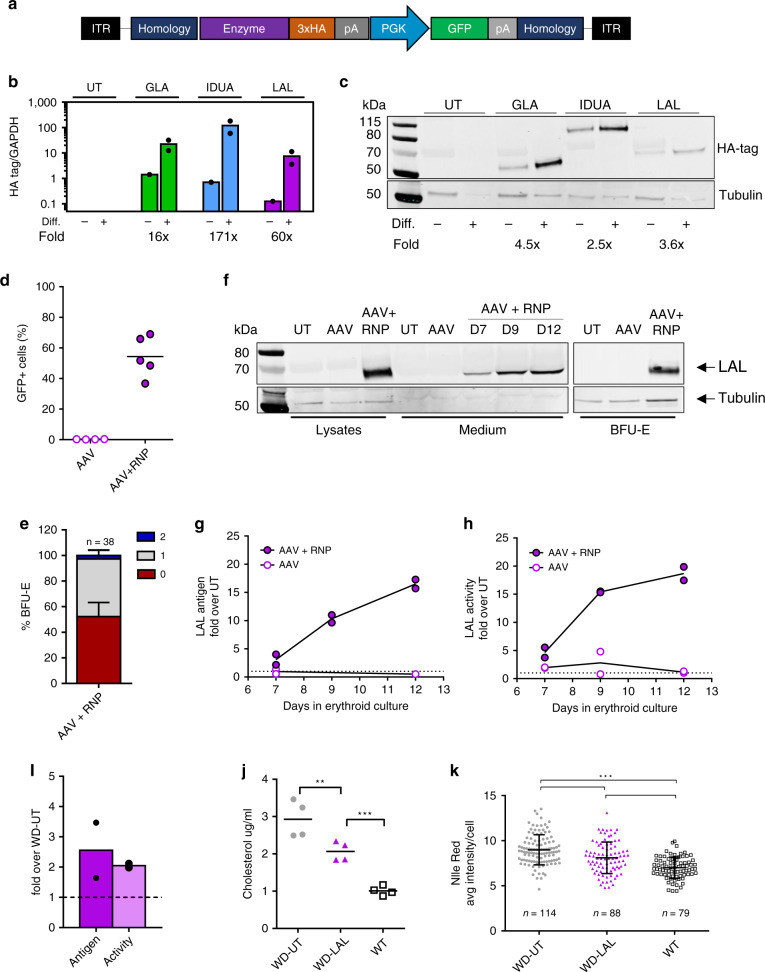
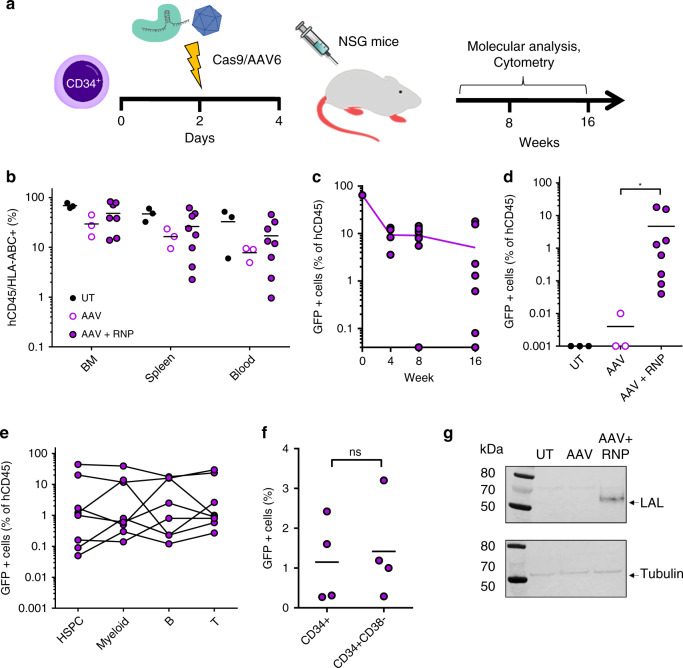
Targeted genome editing has a great therapeutic potential to treat disorders that require protein replacement therapy. To develop a platform independent of specific patient mutations, therapeutic transgenes can be inserted in a safe and highly transcribed locus to maximize protein expression. Here, we describe an ex vivo editing approach to achieve efficient gene targeting in human hematopoietic stem/progenitor cells (HSPCs) and robust expression of clinically relevant proteins by the erythroid lineage. Using CRISPR-Cas9, we integrate different transgenes under the transcriptional control of the endogenous α-globin promoter, recapitulating its high and erythroid-specific expression. Erythroblasts derived from targeted HSPCs secrete different therapeutic proteins, which retain enzymatic activity and cross-correct patients' cells. Moreover, modified HSPCs maintain long-term repopulation and multilineage differentiation potential in transplanted mice. Overall, we establish a safe and versatile CRISPR-Cas9-based HSPC platform for different therapeutic applications, including hemophilia and inherited metabolic disorders.


Conflict of interest statement

G.P. and M.A. are the inventors of a patent describing this HSC-based gene therapy platform (Genetically engineered hematopoietic stem cell as a platform for systemic protein expression; EP18305026.9). The remaining authors declare no competing interests.

Figures

Fig. 1
Fig. 1. Editing of selected sites in the α-globin locus minimally affects globin production.
a Locations of gRNA on HBA2 gene. All gRNA except 74 (in purple) target both HBA1 and HBA2. Selected gRNA are highlighted. b K562-Cas9 screening of gRNA targeting different region of the α-globin locus (5′ untranslated region/start codon (5′UTR/ATG), intron 1 (IVS1) or intron 2 (IVS2)). Each bar is a different gRNA, each dot a different experiment. Editing efficiency is expressed as percentage of modified HBA alleles (bars represent mean; data from 1, 2 or 3 biological replicates). The gRNA selected for each region are highlighted. c Editing efficiencies in HSPCs in erythroid liquid culture (circles) or in BFU-E (burst-forming unit-erythroid, squares). Lines show mean (2-4 donors; n = 5 KO, n = 6 AAVS1, n = 9 5′UTR and IVS2). d Colony-forming cell (CFC) frequency in edited HSPCs (mean ± SD; n = 2, n = 4 for IVS2). CFU-GEMM, granulocyte, erythroid, macrophage, megakaryocyte; BFU-E, burst-forming unit-erythroid; CFU-G/GM, granulocyte-macrophage. e Flow-cytometry analysis of erythroid markers upon differentiation of edited HSPCs, day12 (green 5′UTR, purple IVS2 and gray AAVS1). Results are shown as mean ± SD (n = 3 biological replicates, 3 different donors; p = 0.94, one-way ANOVA Tukey’s test). f HPLC analysis of hemoglobin monomers of erythroblasts derived from edited HSPCs (n = 6 5′UTR, n = 5 IVS2, n = 3 KO and AAVS1, n = 4 UT; 4 donors). InDels percentage mean is indicated. The ratio α/β-like globins in normal cells is close to 1 (red dashed line). Black lines show mean; BFU-E (squares), erythroid liquid culture (circles) (***p < 0.001 vs UT, 5′UTR, IVS2, AAVS1; one-way ANOVA, Tukey’s test). g HPLC analysis of hemoglobin tetramers of erythroblasts derived from edited HSPCs (same samples as in f). Every tetramer is reported as % of total hemoglobins (*p < 0.05; **p < 0.01, ***p < 0.001; two-way ANOVA, Dunnet’s test). Black lines show mean; BFU-E (squares), erythroid liquid culture (circles). Hb Bart, γ4 (p = 0.017 5′UTR, p = 0.013 IVS2, p = 0.006 AAVS1 vs KO); HbH, β4 (p = 0.038 5′UTR, p = 0.035 IVS2, p = 0.032 AAVS1 vs KO); HbF, fetal hemoglobin, α2γ2 (p < 0.001 5′UTR and AAVS1, p = 0.002 IVS2 vs KO); HbA, adult hemoglobin, α2β2 (p < 0.001 vs KO). Source data are in the Source Data file.
Fig. 2
Fig. 2. Transgene integration into the α-globin locus results in robust erythroid-specific expression.
a AAV6 donors used for KI experiments in 5′UTR (top) and IVS2 (bottom) of the α-globin genes. Both vectors contain a promoterless GFP with bovine growth hormone polyA (pA), followed by a phosphoglycerate Kinase (PGK) promoter with a puromycin selection marker (puro) and simian virus polyA (pA). This cassette is flanked by 250 bp homology arms (homology) to gRNA target. IVS2 trap also contains a synthetic intron (IVS), a splice acceptor (SA) and a self-cleaving peptide (2A). ITR, Inverted terminal repeats. b Representative histograms of GFP expression of HUDEP-2 KI cells at day 0 (light pink), day 7 (red) and day 9 of erythroid differentiation (dark red). Untreated HUDEP-2 are shown in gray (n = 1). c Barplot of GFP median fluorescent intensity (MFI) as in b. d Schematic representation of HSPC targeting experiments. e Representative histograms of GFP expression of 5′UTR KI (red fill) and AAV6 only HSPCs (gray line) during erythroid differentiation. Percentage of GFP positive cells is indicated (n = 3 different donors). f GFP median fluorescent intensity (MFI) during differentiation of 5′UTR KI HSPCs (lines indicate mean, n = 3 different donors indicated by open, gray and black circles). g Representative dot plots showing GFP expression in erythroid (GYPA+) and leukocytes (hCD45+) CFC. h Representative overlay images (bright field and GFP channel) of different erythroid progenitor-derived colonies (n = 24). Scale bars in red indicate 200 μm. CFU-GEMM, granulocyte, erythroid, macrophage, megakaryocyte; BFU-E, burst-forming unit-erythroid; CFU-E, erythroid. Source data are in the Source Data file.
Fig. 3
Fig. 3. F9 KI into the α-globin locus results in expression and secretion of functional enzyme.
a AAV6 donor used for KI experiments of FIX Padua. b FIX KI efficiency in HUDEP-2 cells was measured by flow cytometry (light green) or ddPCR specific for on-target integration (dark green) before and after sorting (n = 1). c Quantification of FIX mRNA in KI HUDEP-2 upon differentiation (mean ± SD, n = 2 undifferentiated, n = 3 differentiated). d Quantification of FIX secretion in medium of HUDEP-2 clones (n = 28) with monoallelic or biallelic KI (ELISA), as detected by on target ddPCR analysis (AAV-genome junction amplification). Lines represent median. e KI efficiency in HSPCs at day 9 of erythroid differentiation. Lines represent mean (n = 4). f, g FIX expression during HSPC differentiation at RNA (f, qPCR; n = 2 day 9; n = 4 day 12) and protein level (g, ELISA on supernatants, n = 3 day 7; n = 4 day 9 and 12; 3 donors). Bars represent mean ± SD. h Comparison of FIX antigen (ELISA) and activity (aPTT) in supernatants of KI HSPCs (mean; n = 2). i, j Comparison of FIX RNA at day 9 and 12 of erythroid differentiation (i) and protein (j) in KI HSPCs (AAV + RNP) vs HSPCs transduced with an erythroid-specific lentiviral vector (LvEry FIX). Bars represent mean (**p = 0.003 t-test Holm-Sidak correction for RNA at day 12; p = 0.08 for protein, n = 2). k Integration pattern in single BFU-E (2 donors): no integration (0), monoallelic (1) and biallelic KI (2). Source data are in the Source Data file.
Fig. 4
Fig. 4. Expression and therapeutic potential of different lysosomal enzymes.
a AAV6 donor used for KI experiments. All enzymes were tagged with hemagglutinin tag (3xHA). b Transcript upregulation of different enzymes in targeted HUDEP-2 upon differentiation (qPCR, n = 2, mean). Fold increase is indicated. c Representative western blot detecting different enzymes (HA-tag and anti-β tubulin) of targeted HUDEP-2 upon differentiation (n = 2). d KI efficiency of LAL-AAV6 in HSPCs at day 9 (lines indicate mean; AAV n = 4, AAV + RNP n = 5). e Representative western blot of LAL in HSPC lysates, supernatants and BFU-E in untreated (UT), transduced (AAV) and KI-HSPCs (AAV + RNP). Anti-HA tag and anti-β tubulin antibodies were used. f Quantification of secreted LAL during erythroid differentiation. Anti-LAL antibody was used. Data are shown as fold increase over untreated cells (UT, donor=2). g LAL activity in HSPC supernatants during erythroid differentiation, data are shown as fold increase over untreated cells (UT, n = 2). h Integration pattern in single BFU-E: no integration (0), monoallelic (1) and biallelic (2). Mean ± SD, donor = 2). i Uptake of erythroid-expressed LAL by WD fibroblasts, measured by western blot or activity assay (mean; n = 2). j Cholesterol levels in WD fibroblasts after incubation with conditioned medium from untreated (UT) or LAL KI-erythroblasts. WT fibroblasts are shown as control (n = 4; p = 0.003 WD-UT vs WD-LAL; p < 0.001 WD-LAL vs WT; one-way ANOVA, Tukey’s test). k Nile Red staining in WD fibroblasts after incubation with conditioned medium from untreated (UT) or LAL KI-erythroblasts. WT fibroblasts are shown as control. Black lines indicate mean ± SD; number of fibroblasts analyzed is indicated. (***p < 0.001 one-way ANOVA, Tukey’s test). Source data are in the Source Data file.
Fig. 5
Fig. 5. KI HSPCs engraft NSG mice and express LAL upon erythroid differentiation.
a Schematic representation of engraftment experiments. b Percentage of human CD45+/HLA-ABC+ cells in hematopoietic organs of mice. BM = bone marrow. (UT and AAV n = 3; AAV + RNP n = 8). c GFP positive cells in peripheral blood of transplanted mice over time. Line indicates mean (n = 4 week 4; n = 8 week 8 and 16). d Edited cells in bone marrow of transplanted mice. GFP is expressed as percentage of CD45+ cells, mean is shown (*p = 0.012 AAV vs AAV + RNP, two-tailed Mann–Whitney test). e GFP positive cells in HSPCs (CD34), myeloid (CD33), B (CD19) and T (CD3) cells in bone marrow of transplanted mice. Each line represents one animal (n = 8). f GFP positive cells in HSPCs (CD34) and in a more primitive HSPC subset (CD34+CD38) in bone marrow of transplanted mice (n = 4; ns: p = 0.8, two-tailed Mann Whitney test). g Western blot on CD34-derived BFU-E from mice engrafted with untreated (UT), transduced (AAV) or KI HSPCs (AAV + RNP). Anti-HA tag and anti-β tubulin antibodies were used (n = 2, BFU-E pooled from 2 mice). Source data are in the Source Data file.

References

    1. Gorzelany JA, de Souza MP. Protein replacement therapies for rare diseases: a breeze for regulatory approval? Sci. Transl. Med. 2013;5:178fs110. - PubMed
    1. Concolino D, Deodato F, Parini R. Enzyme replacement therapy: efficacy and limitations. Ital. J. Pediatr. 2018;44:120. - PMC - PubMed
    1. Li H, et al. In vivo genome editing restores haemostasis in a mouse model of haemophilia. Nature. 2011;475:217–221. - PMC - PubMed
    1. Park CY, et al. Functional correction of large factor VIII gene chromosomal inversions in hemophilia A patient-derived iPSCs using CRISPR-Cas9. Cell Stem Cell. 2015;17:213–220. - PubMed
    1. Barzel A, et al. Promoterless gene targeting without nucleases ameliorates haemophilia B in mice. Nature. 2015;517:360–364. - PMC - PubMed

Publication types