. 2020 Jul 29;10(1):12760.
doi: 10.1038/s41598-020-69678-5.

Continuous scanning for Bragg coherent X-ray imaging

Affiliations

Continuous scanning for Bragg coherent X-ray imaging

Ni Li et al. Sci Rep. .

Erratum in

  • Author Correction: Continuous scanning for Bragg coherent X-ray imaging.
    Li N, Dupraz M, Wu L, Leake SJ, Resta A, Carnis J, Labat S, Almog E, Rabkin E, Favre-Nicolin V, Picca FE, Berenguer F, van de Poll R, Hofmann JP, Vlad A, Thomas O, Garreau Y, Coati A, Richard MI. Li N, et al. Sci Rep. 2020 Nov 5;10(1):19420. doi: 10.1038/s41598-020-75649-7. Sci Rep. 2020. PMID: 33154457 Free PMC article.

Abstract

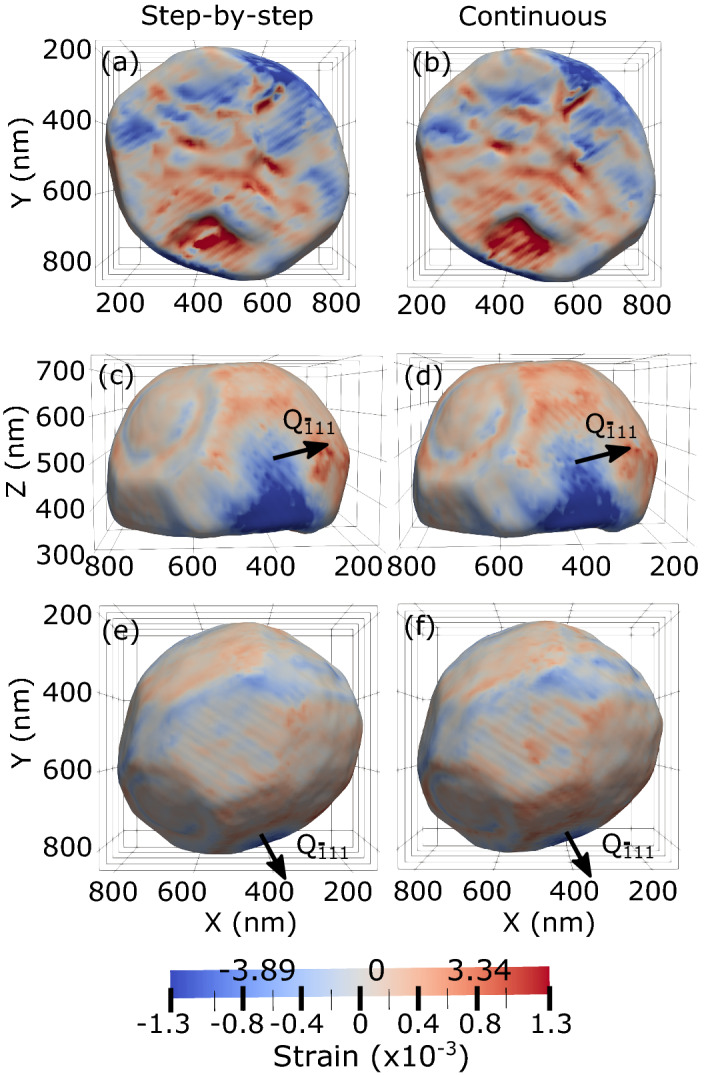
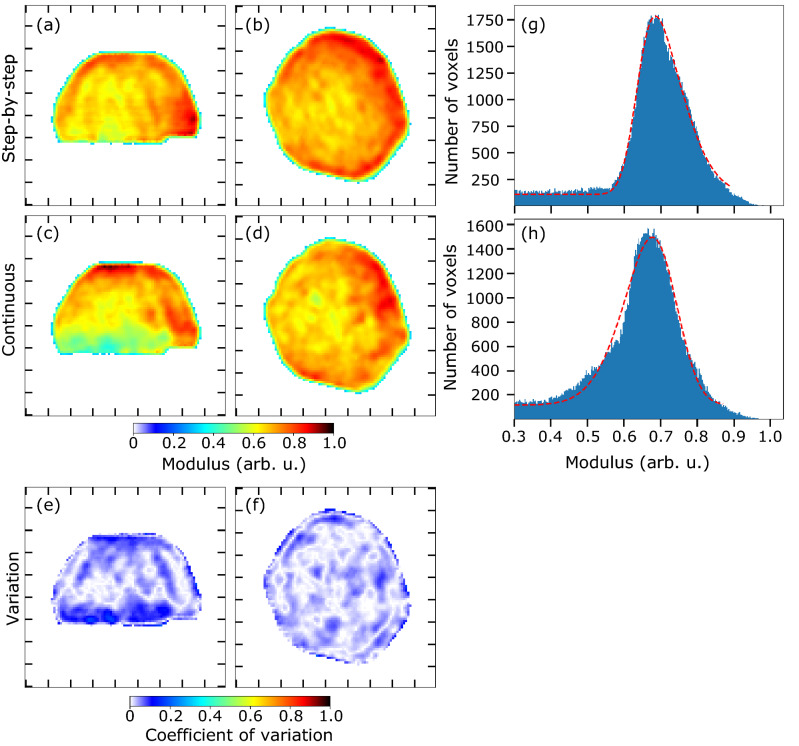
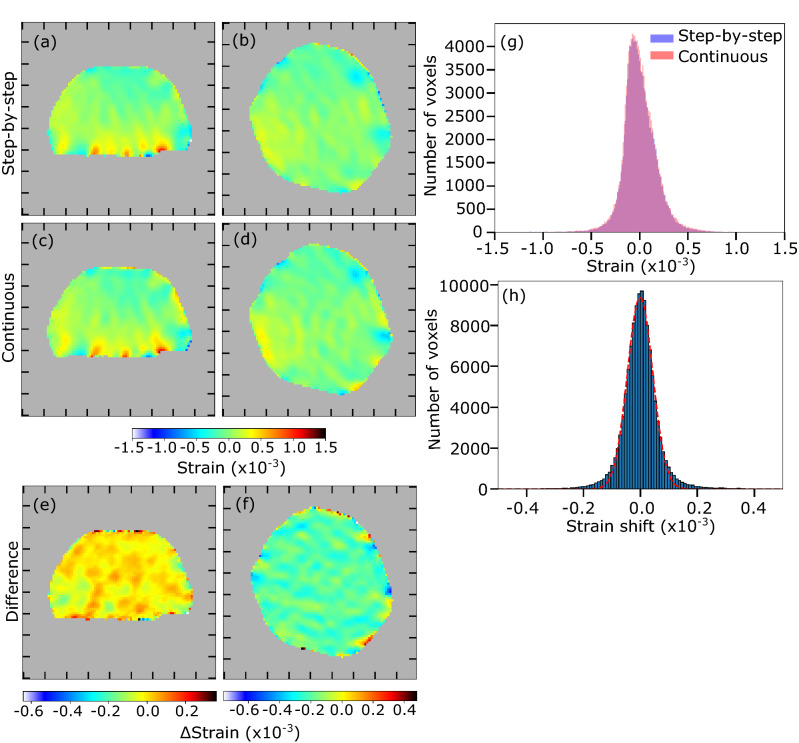
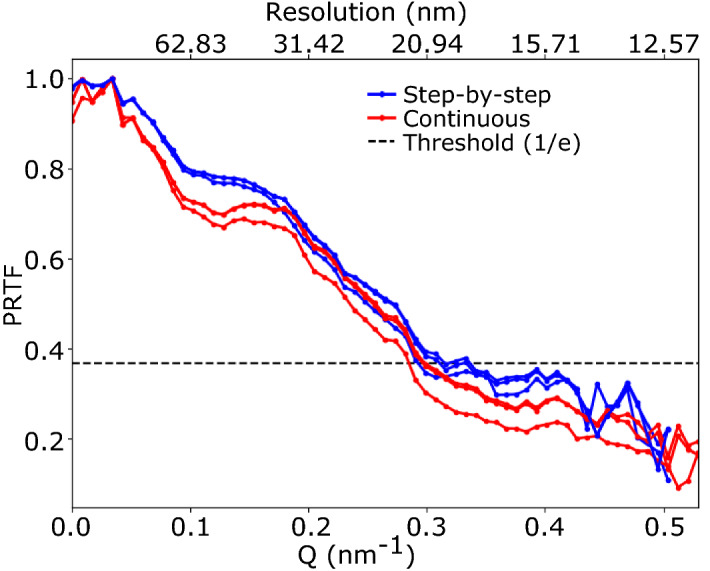
We explore the use of continuous scanning during data acquisition for Bragg coherent diffraction imaging, i.e., where the sample is in continuous motion. The fidelity of continuous scanning Bragg coherent diffraction imaging is demonstrated on a single Pt nanoparticle in a flow reactor at [Formula: see text] in an Ar-based gas flowed at 50 ml/min. We show a reduction of 30% in total scan time compared to conventional step-by-step scanning. The reconstructed Bragg electron density, phase, displacement and strain fields are in excellent agreement with the results obtained from conventional step-by-step scanning. Continuous scanning will allow to minimise sample instability under the beam and will become increasingly important at diffraction-limited storage ring light sources.


Conflict of interest statement

The authors declare no competing interests.

Figures

Figure 1
Figure 1
Comparison of intensity. Sum along the rocking direction of all the detector images acquired in the vicinity of the 1¯11 Pt reflection during (a) step-by-step and (b) continuous scanning for the same Pt particle. The data is cropped on a region of interest of the detector centered on the diffraction pattern. The grey area correspond to the detector gaps. Evolution of the measured intensity during step-by-step and continuous scanning (with a scaling factor of 10 for the intensity measured during continuous scanning) as a function of the rocking-angle and at different pixels of the 2D detector: (c) at pixel = (163, 133)—which corresponds to the maximum of the intensity, (d) at pixel = (179, 133) and (e) at pixel = (163, 144).
Figure 2
Figure 2
Comparison of the retrieved surface strain in 3D. Bottom (a,b), side (c,d) and top (e,f) views of the BCDI reconstruction of strain field along the [1¯11] direction, ε1¯11, drawn at 30% of the maximum Bragg electron density of the Pt nanoparticle measured by conventional step-by-step (a,c,e) and continuous (b,d,f) scanning. The direction of the scattering vector, Q1¯11, is indicated in the figure.
Figure 3
Figure 3
Comparison of retrieved modulus. (a,b) Central slice of the reconstructed modulus in yz and xy planes for the step-by-step scan. (c,d) Central slice of the reconstructed modulus in yz and xy planes for the continuous scan. (e,f) Coefficient of variation of the central slice of the reconstructed modulus in yz and xy planes. Ticks correspond to 100 nm. (g,h) Histograms of the reconstructed modulus for the step-by-step and continuous scanning modes with their corresponding fit (red curves).
Figure 4
Figure 4
Quantitative comparison of retrieved strains. (a,b) Central slice of the reconstructed strain in yz and xy planes for the step-by-step scan, drawn at 30% of the reconstructed modulus. (c,d) Central slice of the reconstructed strain in yz and xy planes for the continuous scan, drawn at 30% of the reconstructed modulus. (e,f) Central slice of the difference of the reconstructed strains in yz and xy planes, drawn at 30% of the reconstructed modulus of the step-by-step scan. Ticks correspond to 100 nm. The colorbar in the difference maps reflects the full range of the slice only, not of the full crystal. (g) Histograms of the strain (ε1¯11) reconstructed for both scanning methods. (h) Histogram of the strain difference between the two scanning methods on a voxel-by-voxel basis as well as its Gaussian fit.
Figure 5
Figure 5
Spatial resolution. Estimation of the spatial resolution using phase retrieval transfer function (PRTF) for three sets of reconstructions obtained from the step-by-step and continuous scanning modes.

References

    1. Sayre D, Chapman HN, Miao J. On the extendibility of X-ray crystallography to noncrystals. Acta Crystallogr. A. 1998;54:232–239. doi: 10.1107/S0108767397015572. - DOI
    1. Miao J, Charalambous P, Kirz J, Sayre D. Extending the methodology of X-ray crystallography to allow imaging of micrometre-sized non-crystalline specimens. Nature. 1999;400:342–344. doi: 10.1038/22498. - DOI
    1. Miao J, Sayre D. On possible extensions of X-ray crystallography through diffraction-pattern oversampling. Acta Crystallogr. A. 2000;56:596–605. doi: 10.1107/S010876730001031X. - DOI - PubMed
    1. Miao J, Hodgson KO, Sayre D. An approach to three-dimensional structures of biomolecules by using single-molecule diffraction images. Proc. Natl. Acad. Sci. USA. 2001;98:6641–6645. doi: 10.1073/pnas.111083998. - DOI - PMC - PubMed
    1. Marchesini S, et al. X-ray image reconstruction from a diffraction pattern alone. Phys. Rev. B. 2003;68:140101. doi: 10.1103/PhysRevB.68.140101. - DOI

Publication types