. 2020 Jul 29;10(1):12707.
doi: 10.1038/s41598-020-69374-4.

Against all odds: a tale of marine range expansion with maintenance of extremely high genetic diversity

Affiliations

Against all odds: a tale of marine range expansion with maintenance of extremely high genetic diversity

Joana I Robalo et al. Sci Rep. .

Abstract

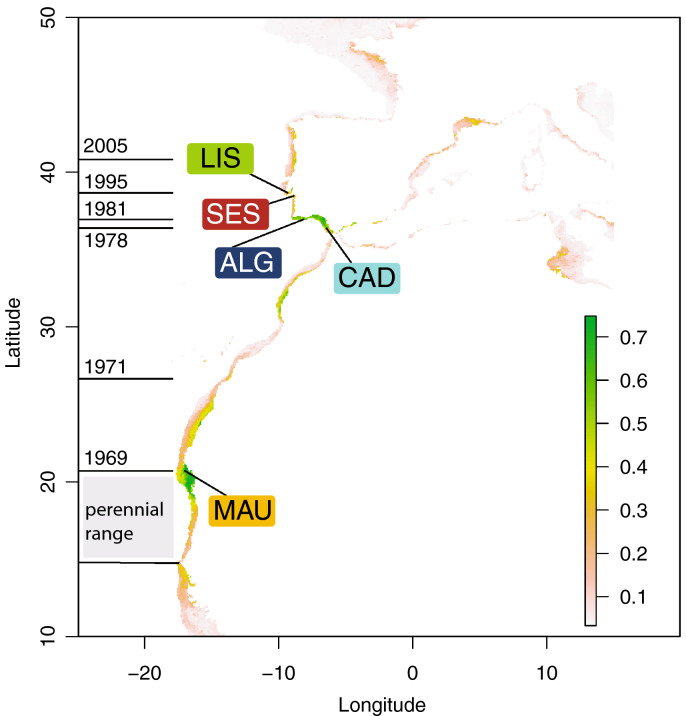
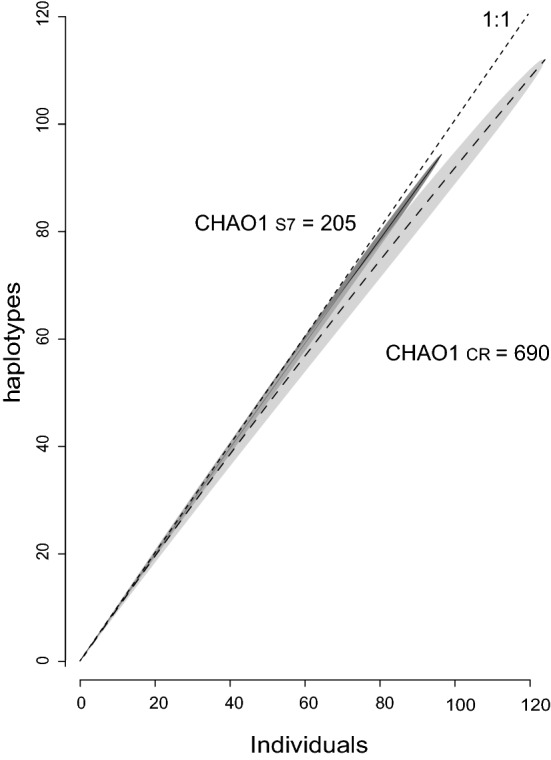
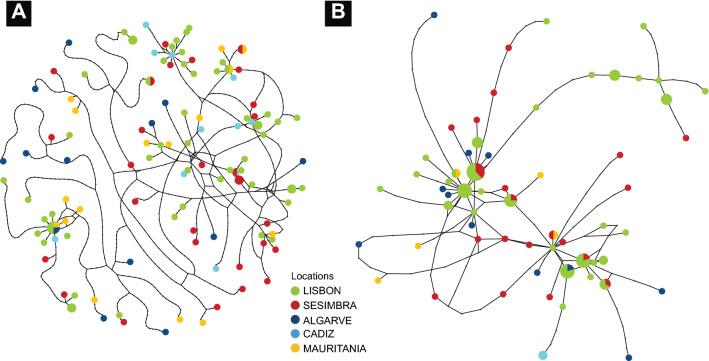
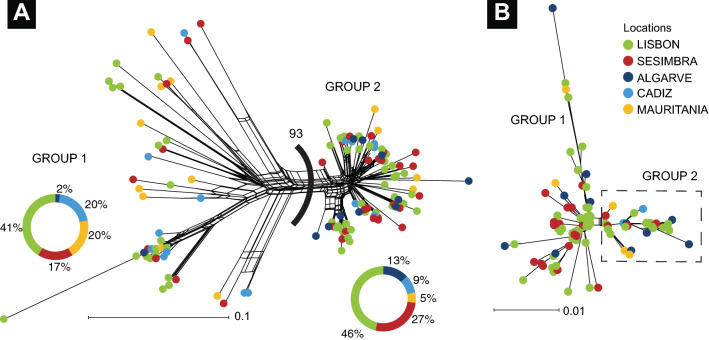
The displacement of species from equatorial latitudes to temperate locations following the increase in sea surface temperatures is among the significant reported consequences of climate change. Shifts in the distributional ranges of species result in fish communities tropicalisation, i.e., high latitude colonisations by typically low latitude distribution species. These movements create new interactions between species and new trophic assemblages. The Senegal seabream, Diplodus bellottii, may be used as a model to understand the population genetics of these invasions. In the last decades, this species has undergone an outstanding range expansion from its African area of origin to the Atlantic coast of the Iberian Peninsula, where now occurs abundantly. Mitochondrial and nuclear markers revealed a striking high haplotypic nucleotide and genetic diversity values, along with significant population differentiation throughout the present-day geographical range of the Senegal seabream. These results are not consistent with the central-marginal hypothesis, nor with the expectations of a leptokurtic distribution of individuals, as D. bellottii seems to be able to retain exceptional levels of diversity in marginal and recently colonised areas. We discuss possible causes for hyperdiversity and lack of geographical structure and subsequent implications for fisheries.


Conflict of interest statement

The authors declare no competing interests.

Figures

Figure 1
Figure 1
Present-day distributional range, sample locations and consensus modeled distribution of the Senegal seabream (Diplodus bellottii) in Northern West Africa and Iberia. Locations: MAU—Mauritania; CAD—Cadiz; ALG—Algarve; SES—Sesimbra; LIS—Lisbon. Perennial range in grey and year of first record of expanded range in horizontal lines. Color-coded sampled locations over-layed on the consensus current modeled probability of occurrence distribution (see “Material and methods” section). Note: The original estimated suitability value was divided by 1000 to convert the suitability value into a probability of occurrence. As a rule of thumb, sites with suitability higher than 0.5 predict presence, while sites with suitability lower than 0.5 indicate absence. Figure generated using the Biomod2 package (https://cran.r-project.org/web/packages/biomod2) implemented in the R (version 3.5.3), and Adobe Illustrator CC2019 (version 23.0.1) (https://www.adobe.com/products/illustrator.html).
Figure 2
Figure 2
Haplotype rarefaction curves and the Chao 1 estimated total haplotypes for each marker in Diplodus bellottii. Shaded areas indicate 95% confidence interval from 1000 permutations. The 1:1 line indicates the maximum where each new sample represents a new haplotype. Figure generated using the chaoHaplo function (https://CRAN.R-project.org/package=spider) of the spider package implemented in R language (version 3.5.3), and Adobe Illustrator CC2019 (version 23.0.1) (https://www.adobe.com/products/illustrator.html).
Figure 3
Figure 3
Statistical parsimony network illustrating the genealogical relationships of Diplodus bellottii among CR (a) and S7 (b) haplotypes (threshold of statistical significance = 95%). The size of the circle corresponds to the haplotype frequency. Pie charts indicate the proportion at which each haplotype occurs at each location. Black dots indicate the number of mutational differences separating sampled haplotypes or hypothetical (unsampled) haplotypes. Figure generated using the TCSBU and Adobe Illustrator CC2019 (version 23.0.1) (https://www.adobe.com/products/illustrator.html).
Figure 4
Figure 4
Neighbour-net networks based on 124 mitochondrial DNA CR sequences (a) and 96 S7 nuclear DNA (b) of Diplodus bellottii. Value between groups in CR corresponds to bootstrap replicates. Figure generated using the Splitstree and Adobe Illustrator CC2019 (version 23.0.1) (https://www.adobe.com/products/illustrator.html).
Figure 5
Figure 5
Performance statistics of all the species distribution models. Plot of the mean (dot) and standard deviation (horizontal and vertical lines) of evaluation scores for the different modeling algorithms used with Biomod2, by algorithm (a) or cross-validation (b). Best models are closer to the top-right corner of the graph. TSS: true skill statistics; ROC: area under the receiver operating characteristic curve. Figure generated using the Biomod2 package implemented in the R language (version 3.5.3), and Adobe Illustrator CC2019 (version 23.0.1) (https://www.adobe.com/products/illustrator.html).

References

    1. Vergés A, et al. The tropicalization of temperate marine ecosystems: climate-mediated changes in herbivory and community phase shifts. Proc. R. Soc. B Biol. Sci. 2014;281:20140846. - PMC - PubMed
    1. Cheung WW, Watson R, Pauly D. Signature of ocean warming in global fisheries catch. Nature. 2013;497:365–368. - PubMed
    1. López C, Moreno S, Brito A, Clemente S. Distribution of zooxanthellate zoantharians in the Canary Islands: potential indicators of ocean warming. Estuar. Coast. Shelf Sci. 2020;233:106519.
    1. Perry AL, Low PJ, Ellis JR, Reynolds JD. Climate change and distribution shifts in marine fishes. Science. 2005;308:1912–1915. doi: 10.1126/science.1111322. - DOI - PubMed
    1. Encarnação J, Morais P, Baptista V, Cruz J, Teodósio MA. New evidence of marine fauna tropicalization off the southwestern Iberian Peninsula (southwest Europe) Diversity. 2019;11:48.

Publication types