. 2020 Jul 29;10(1):12726.
doi: 10.1038/s41598-020-69665-w.

Genetic tropicalisation following a marine heatwave

Affiliations

Genetic tropicalisation following a marine heatwave

Melinda A Coleman et al. Sci Rep. .

Abstract

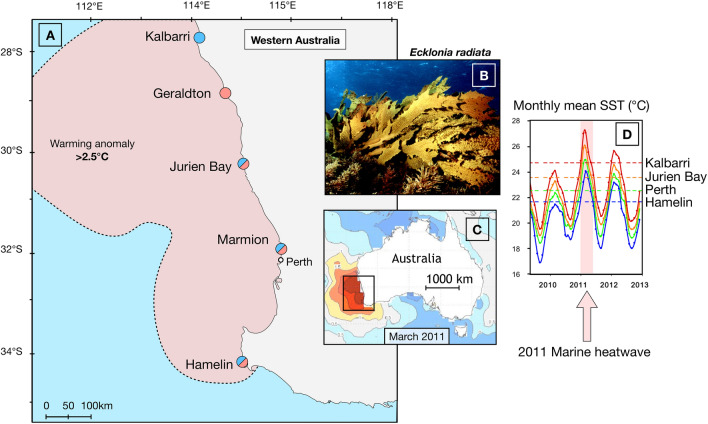
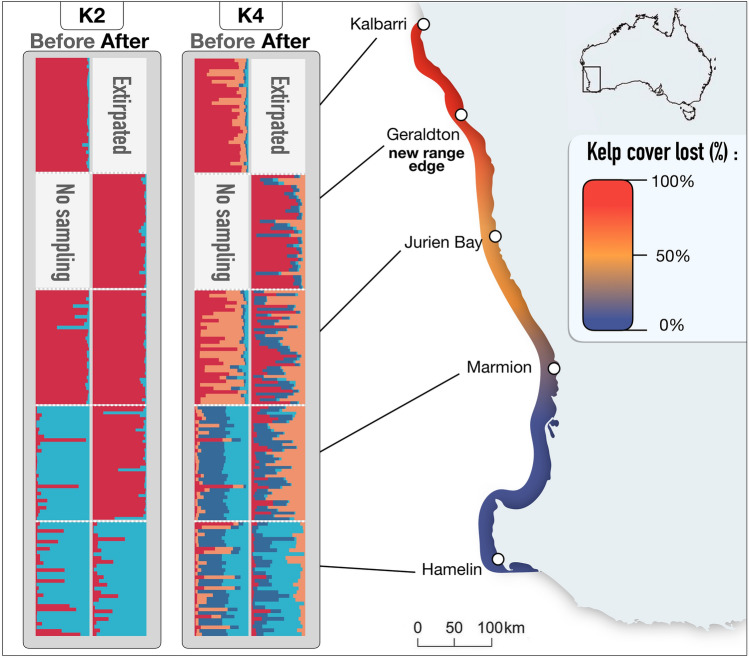
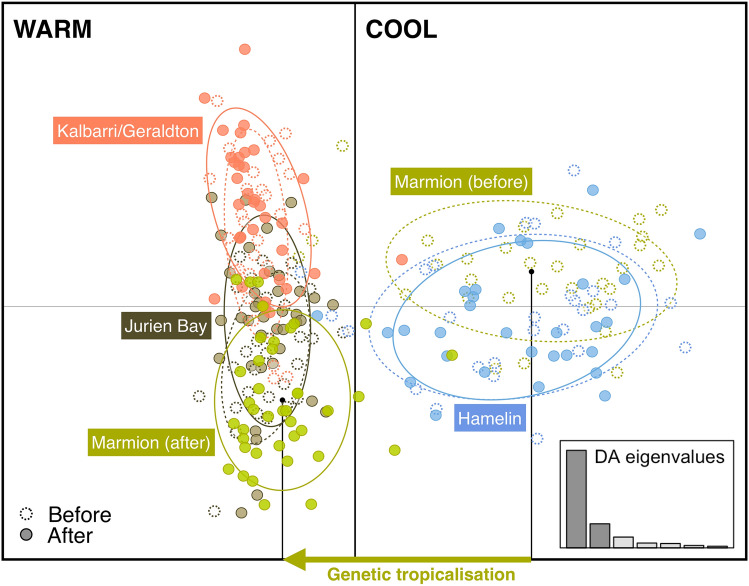
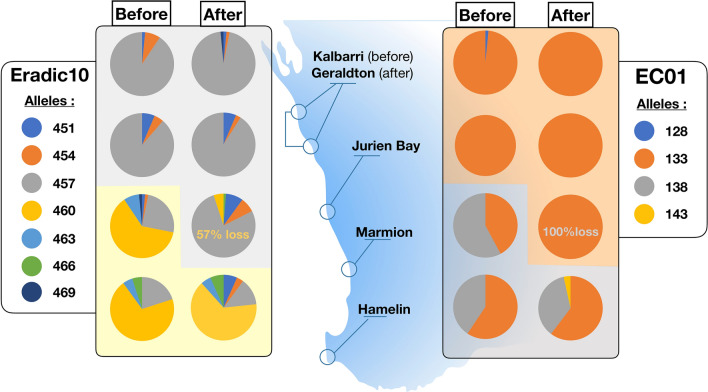
Extreme events are increasing globally with devastating ecological consequences, but the impacts on underlying genetic diversity and structure are often cryptic and poorly understood, hindering assessment of adaptive capacity and ecosystem vulnerability to future change. Using very rare "before" data we empirically demonstrate that an extreme marine heatwave caused a significant poleward shift in genetic clusters of kelp forests whereby alleles characteristic of cool water were replaced by those that predominated in warm water across 200 km of coastline. This "genetic tropicalisation" was facilitated by significant mortality of kelp and other co-occurring seaweeds within the footprint of the heatwave that opened space for rapid local proliferation of surviving kelp genotypes or dispersal and recruitment of spores from warmer waters. Genetic diversity declined and inbreeding increased in the newly tropicalised site, but these metrics were relative stable elsewhere within the footprint of the heatwave. Thus, extreme events such as marine heatwaves not only lead to significant mortality and population loss but can also drive significant genetic change in natural populations.


Conflict of interest statement

The authors declare no competing interests.

Figures

Figure 1
Figure 1
Sampling locations with footprint of the marine heatwave (red) and surface temperature anomaly reported from March 2011 compared to 1971–2000 surface temperature records (A), photo of Ecklonia radiata (B) and details of the regional evolution of the temperature anomaly (C) and at each of our study sites (D.
Figure 2
Figure 2
Population genetic structure inferred by STRUCTURE (v 2.3.4; https://web.stanford.edu/group/pritchardlab/structure) analysis for the K = 2 genetic clusters before and after the heatwave. K = 4 is also shown to better visualise admixture. Each horizontal line represents an individual coloured according to that individual’s membership assigned to each cluster. The gradient coloured line represents the kelp cover lost.
Figure 3
Figure 3
Discriminant analysis of principal components (DAPC) before (dashed symbols) and after (solid symbols) the heatwave. Each dot represents an individual while populations are represented by a coloured circle (the circumference of the ellipsis is arbitrary). The amount of genetic variation explained by the first two linear discriminants (DA) are 67.01 and 16.54%.
Figure 4
Figure 4
Examples of change in allelic frequencies of two microsatellite loci contributing to genetic tropicalisation at Marmion [Eradic10 (n = 26–40) and EC01 (n = 30–40)]. Background shading represents the northern and southern clusters identified from STRUCTURE (v 2.3.4; https://web.stanford.edu/group/pritchardlab/structure) (K = 2; Fig. 3) and are coloured according to the major allele frequency driving change from before to after. The percent loss of the major “cool” alleles (460 and 138) at Marmion is also shown.

References

    1. Sath IPCC. Climate Change 2014: Synthesis Report. Contribution of Working Groups I, II and III to the Fifth Assessment Report of the Intergovernmental Panel on Climate Change. Geneva: IPCC Press; 2014. p. 151.
    1. Coumou D, Rahmstorf S. A decade of weather extremes. Nat. Clim. Change. 2012;2:491–496. doi: 10.1038/nclimate1452. - DOI
    1. Grant PR, et al. Evolution caused by extreme events. Philos. Trans. R. Soc. B. 2017 doi: 10.1098/rstb.2016.0146. - DOI - PMC - PubMed
    1. Jangjoo M, Matter SF, Roland J, Keyghobadi N. Connectivity rescues genetic diversity after a demographic bottleneck in a butterfly population network. Proc. Natl. Acad. Sci. USA. 2016;113:10914–10919. doi: 10.1073/pnas.1600865113. - DOI - PMC - PubMed
    1. Gaines SD, Denny MW. The largest, smallest, highest, lowest, longest, and shortest: Extremes in ecology. Ecology. 1993;74:1677–1692. doi: 10.2307/1939926. - DOI

Publication types