. 2020 Aug;584(7820):268-273.
doi: 10.1038/s41586-020-2555-7. Epub 2020 Jul 29.

Mechanisms of stretch-mediated skin expansion at single-cell resolution

Affiliations

Mechanisms of stretch-mediated skin expansion at single-cell resolution

Mariaceleste Aragona et al. Nature. 2020 Aug.

Erratum in

Abstract

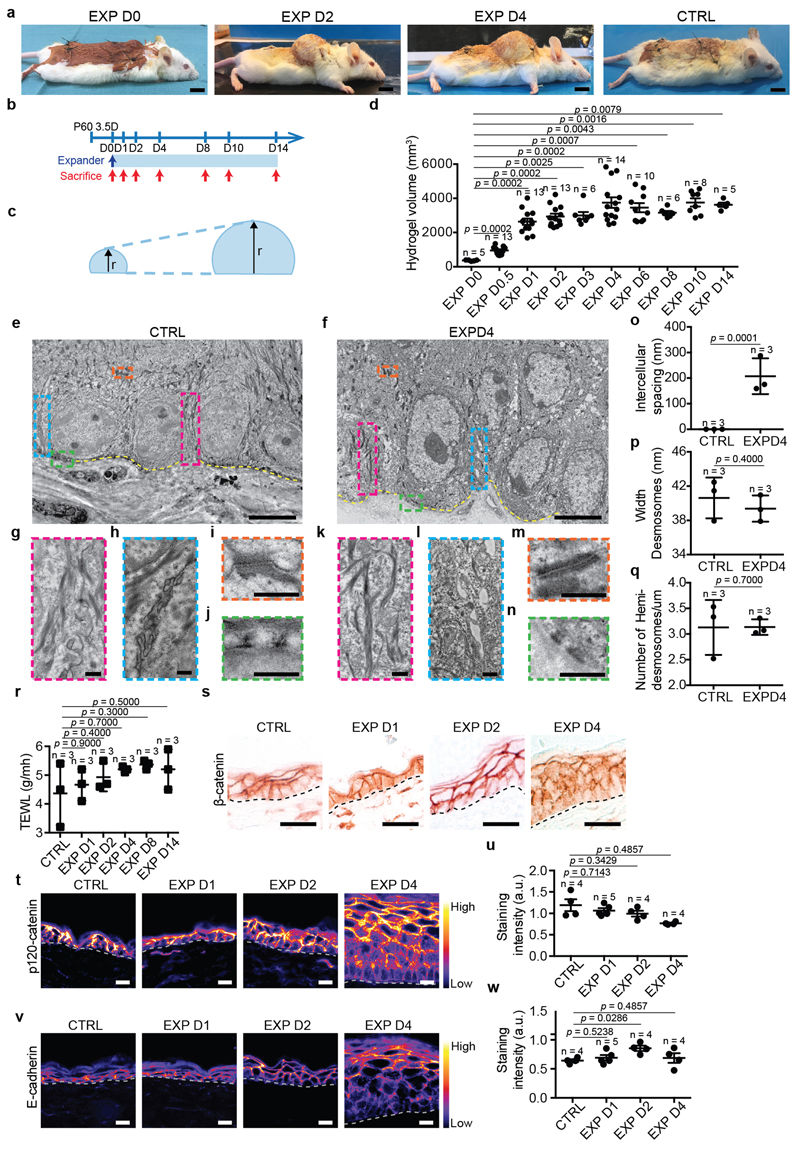
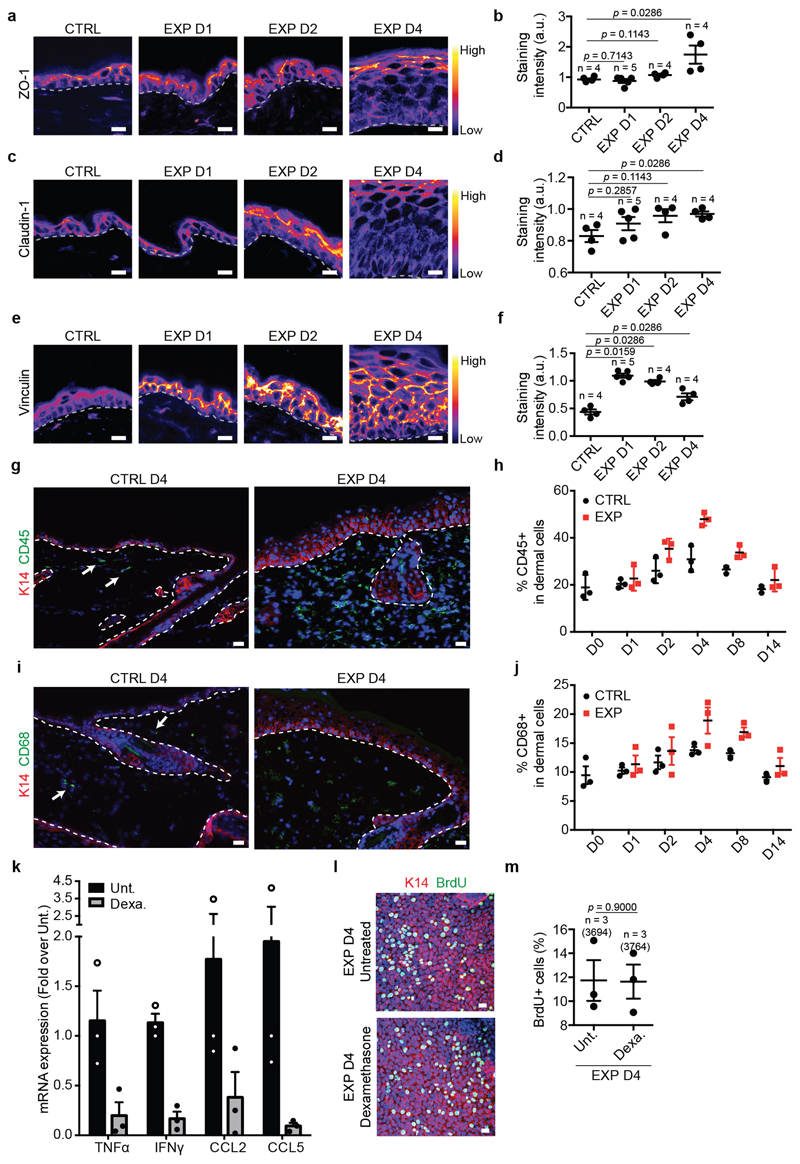
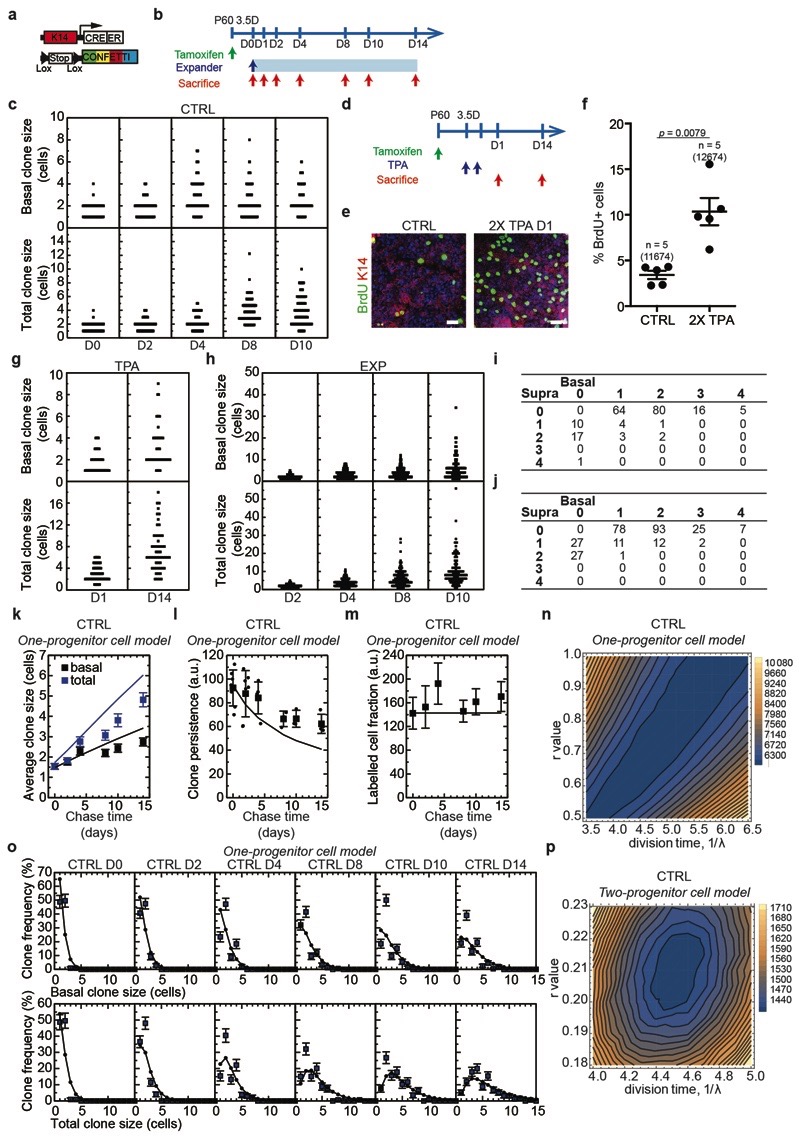
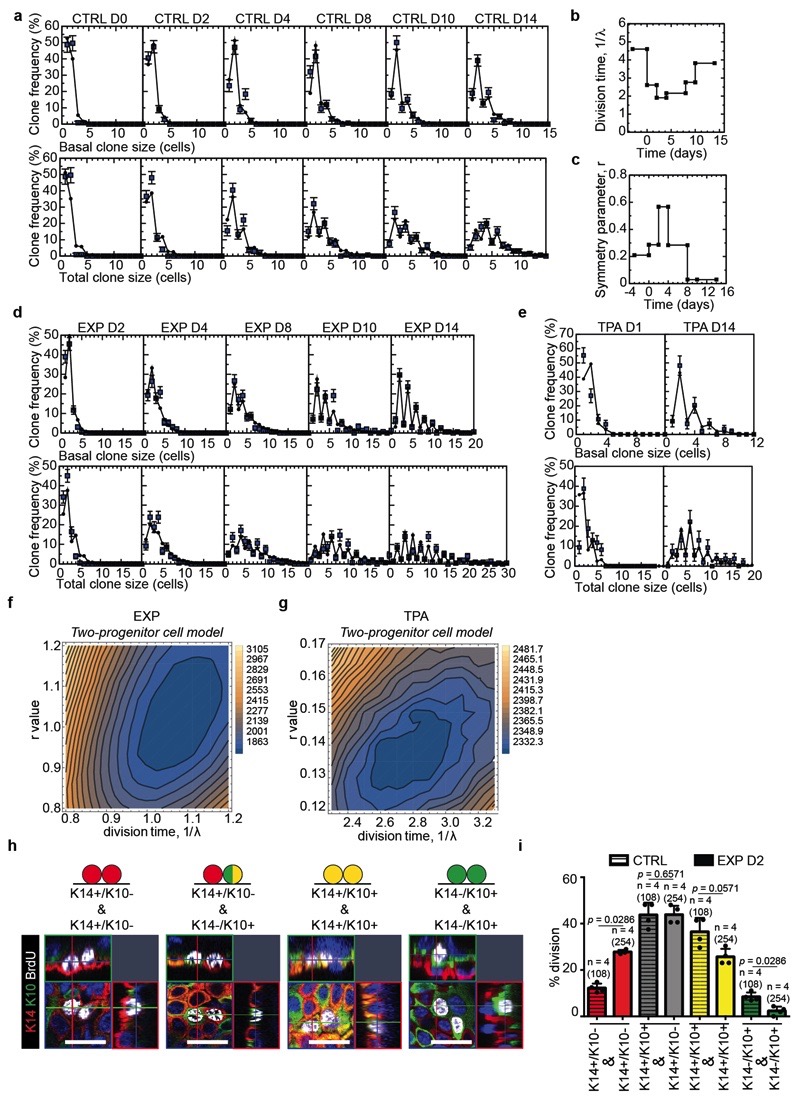
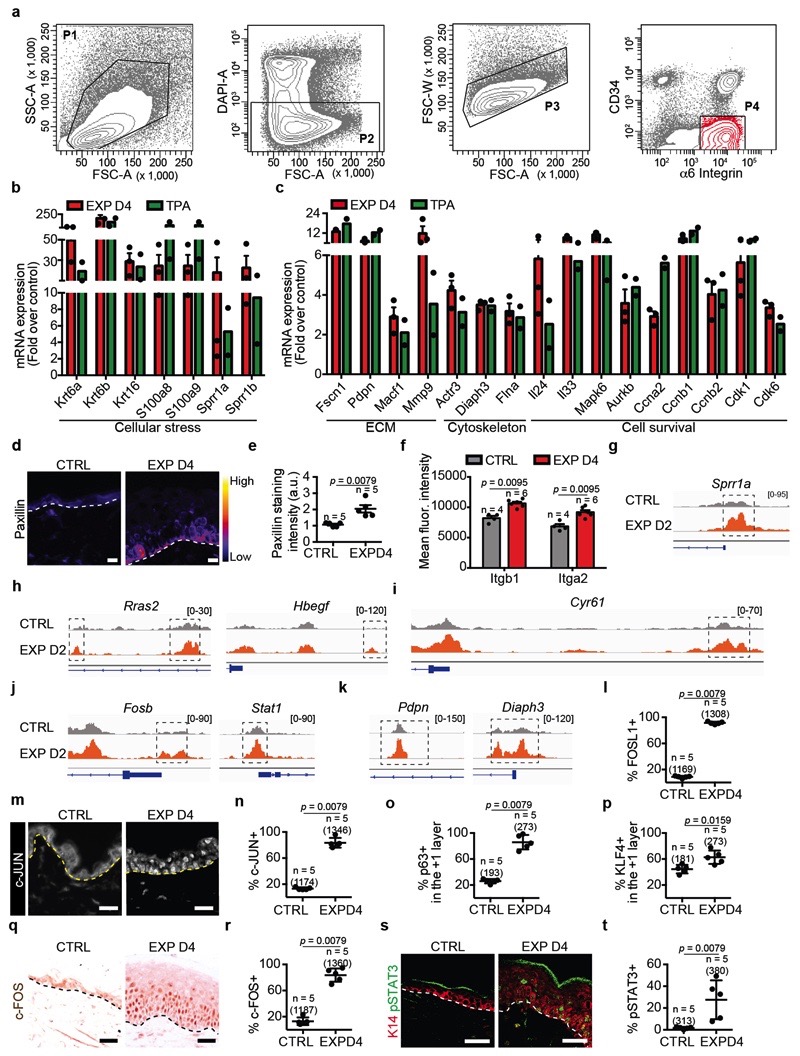
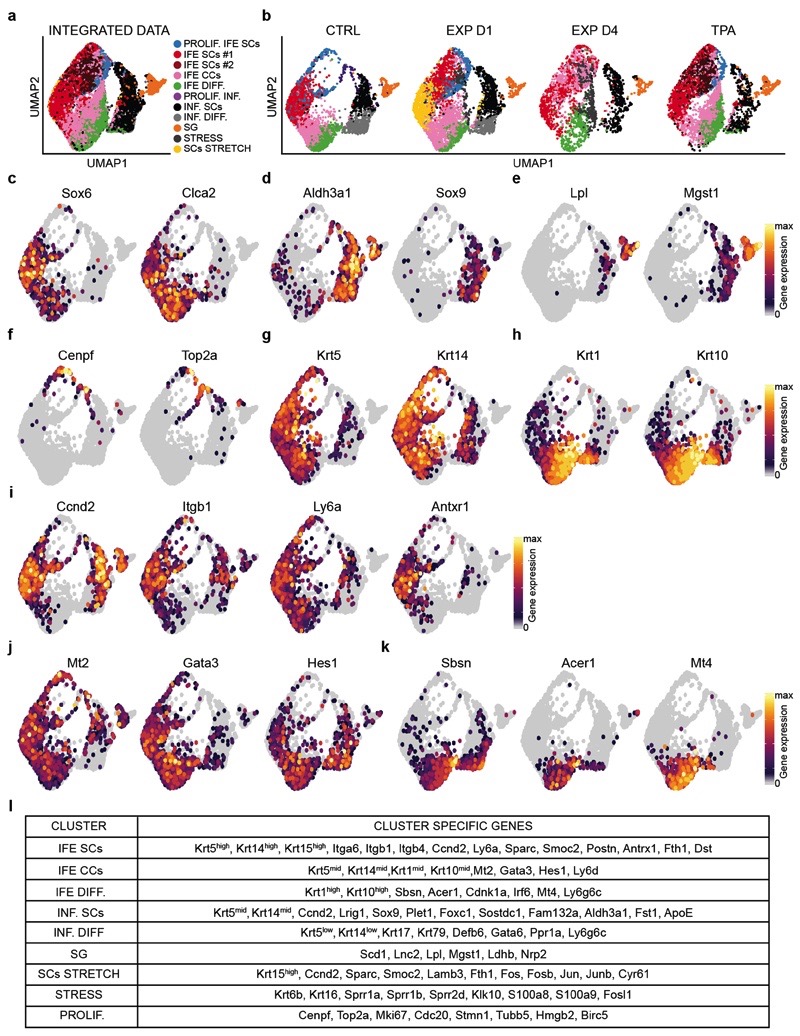
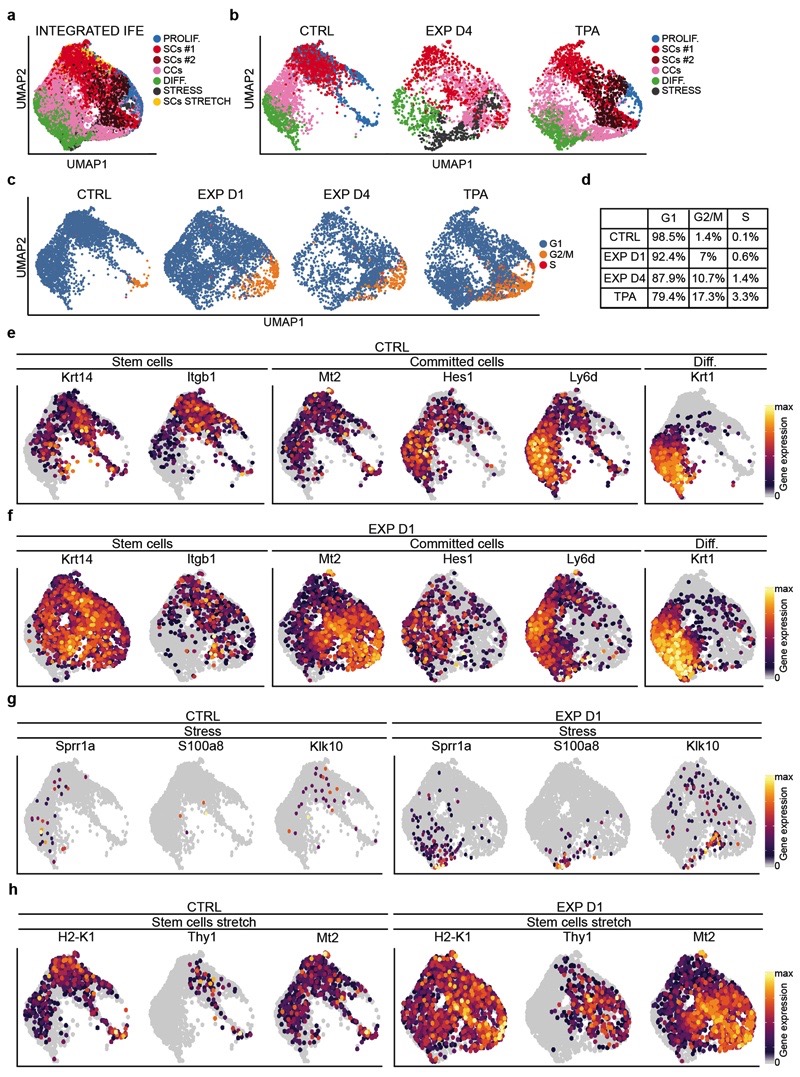
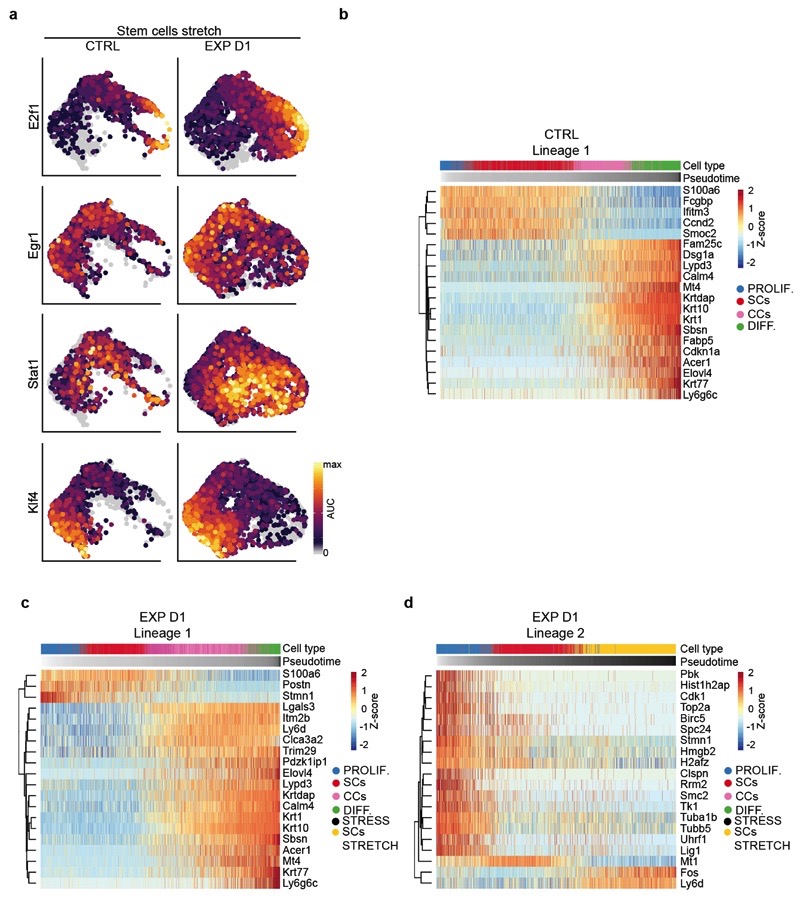
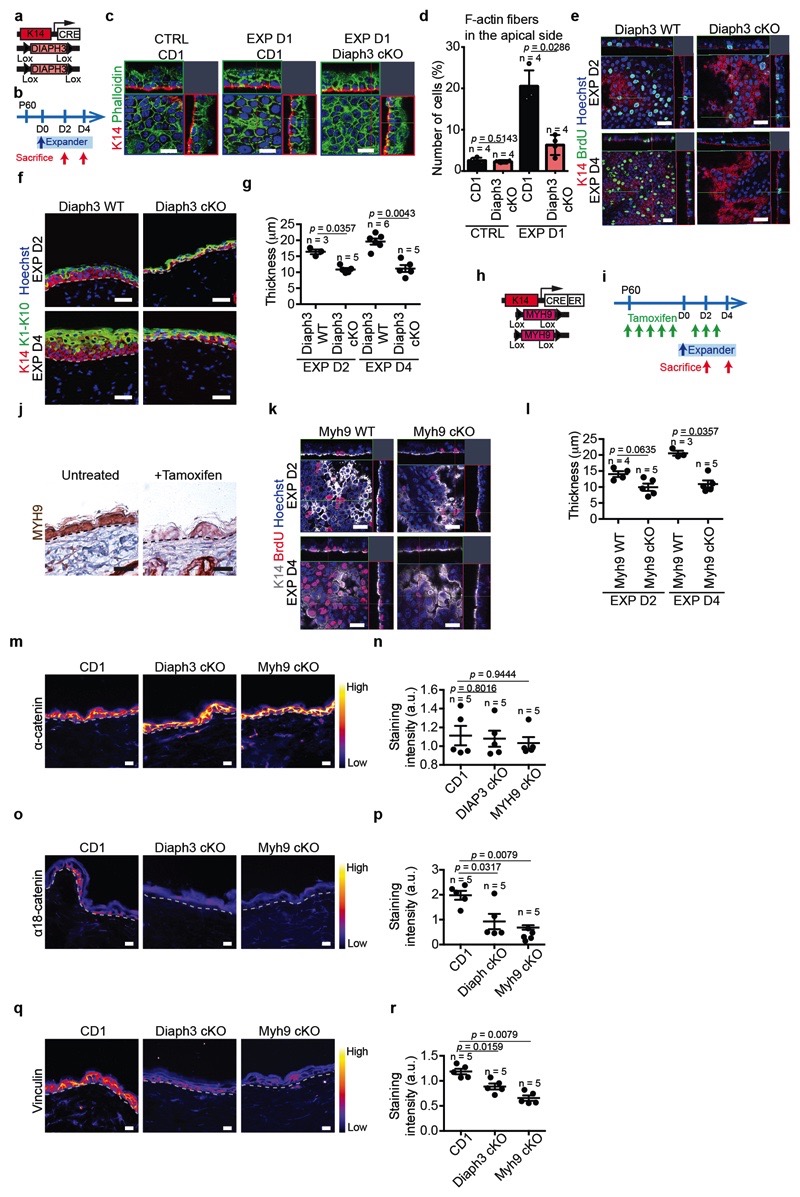
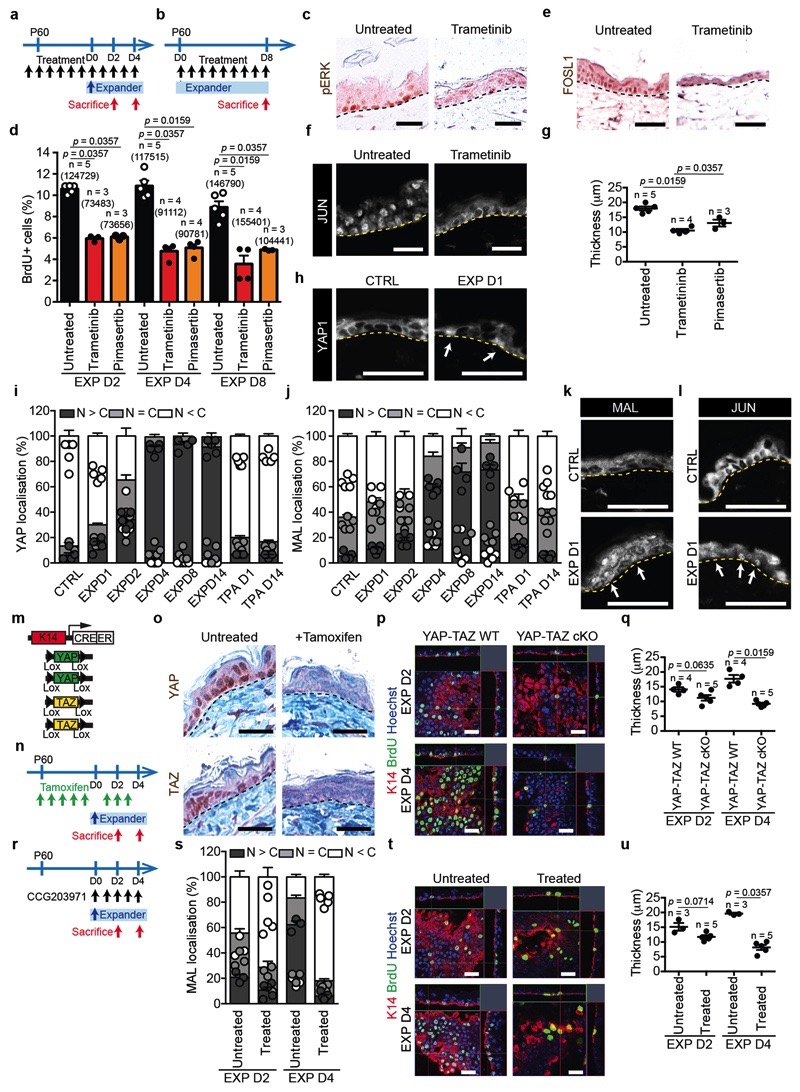
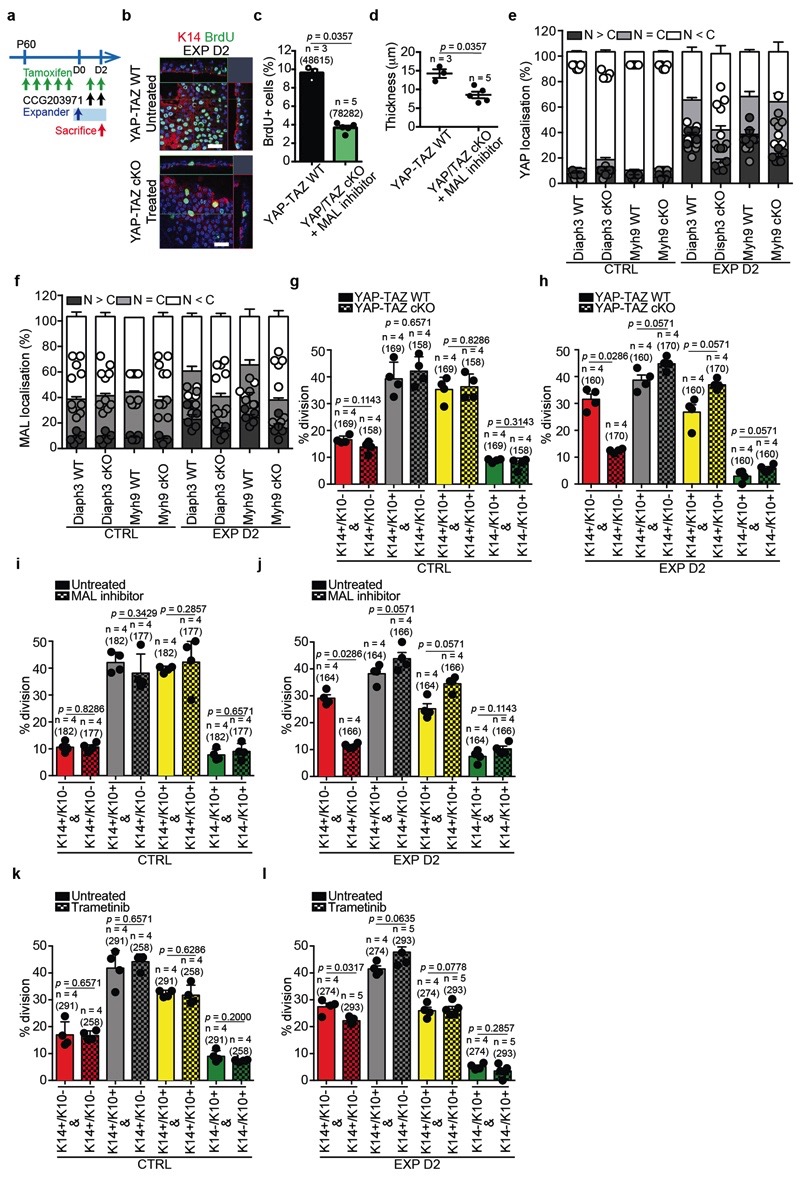
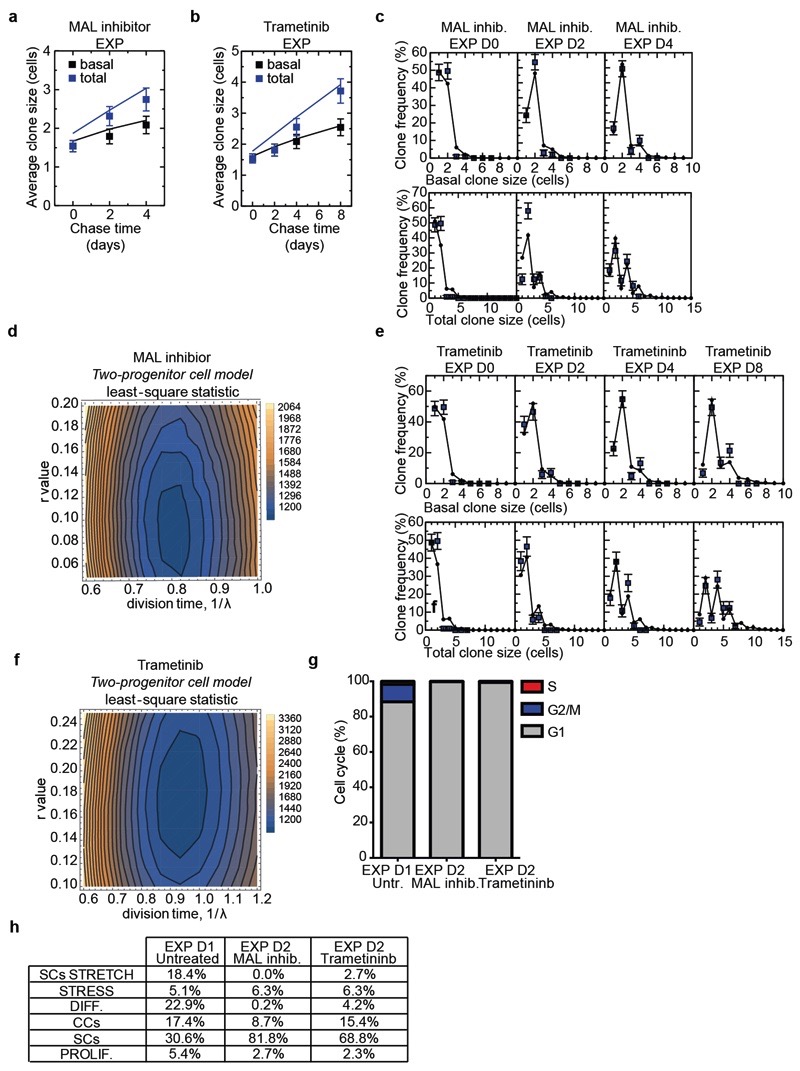
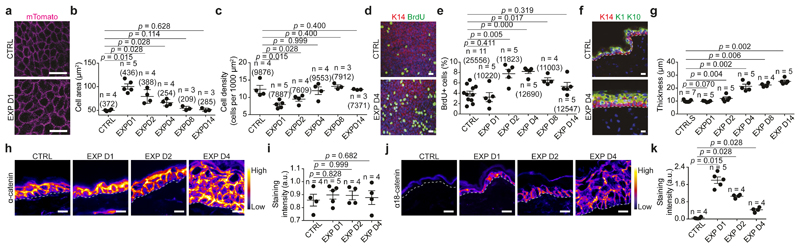
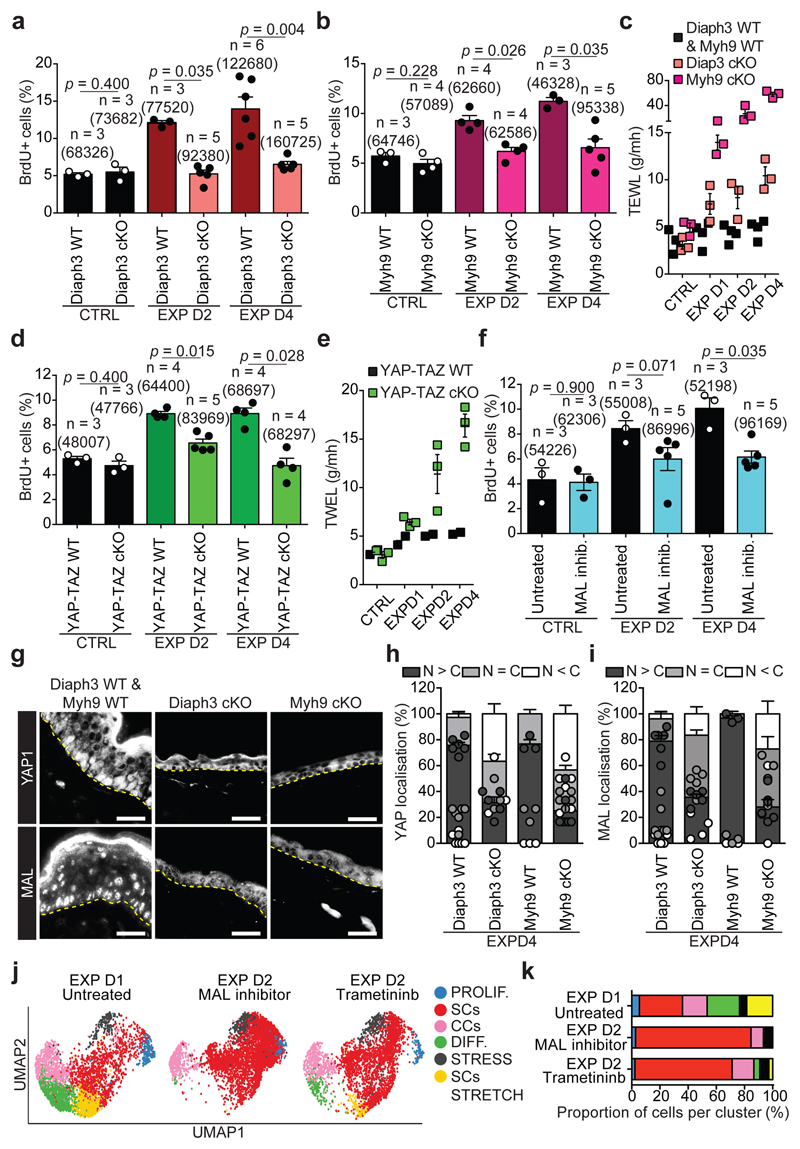
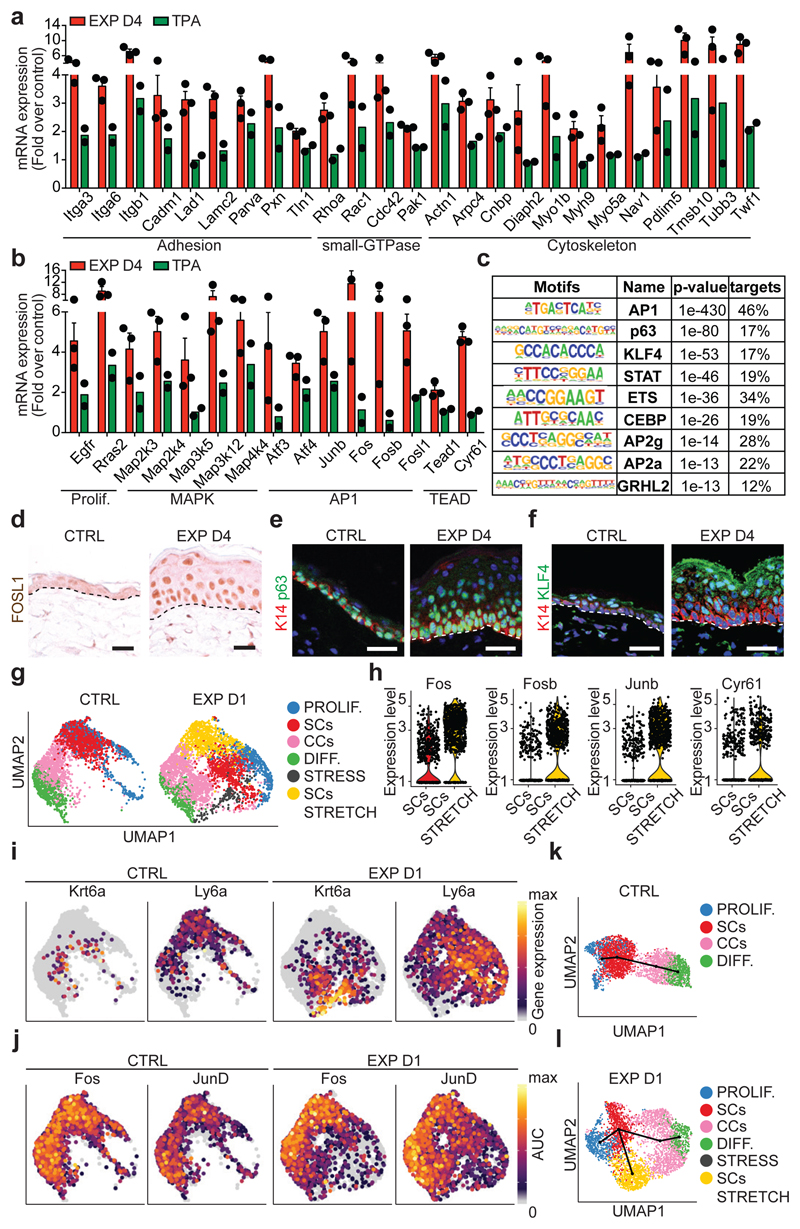
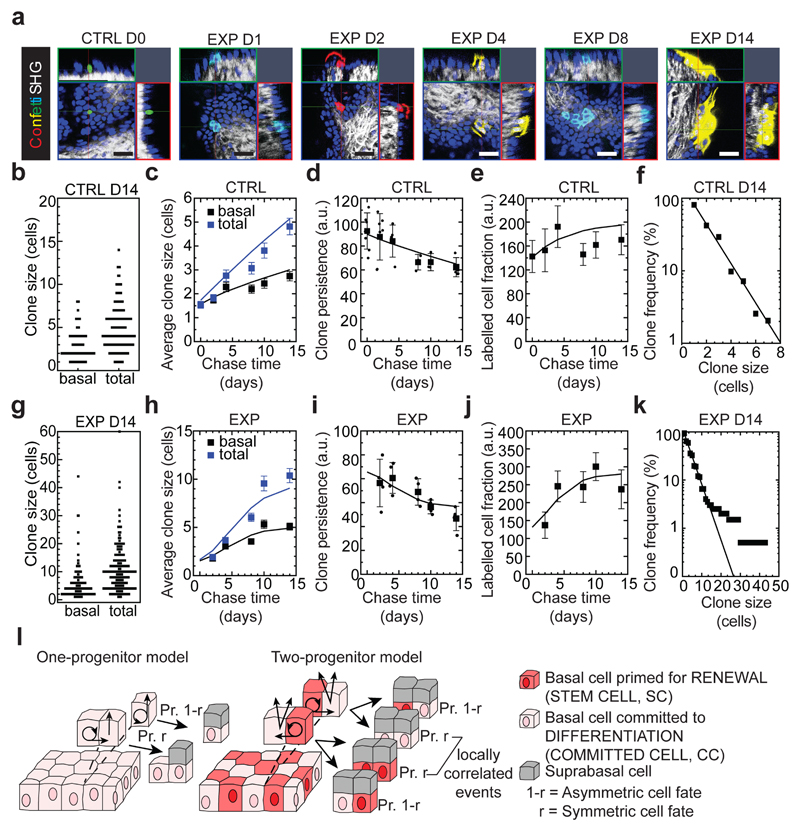
The ability of the skin to grow in response to stretching has been exploited in reconstructive surgery1. Although the response of epidermal cells to stretching has been studied in vitro2,3, it remains unclear how mechanical forces affect their behaviour in vivo. Here we develop a mouse model in which the consequences of stretching on skin epidermis can be studied at single-cell resolution. Using a multidisciplinary approach that combines clonal analysis with quantitative modelling and single-cell RNA sequencing, we show that stretching induces skin expansion by creating a transient bias in the renewal activity of epidermal stem cells, while a second subpopulation of basal progenitors remains committed to differentiation. Transcriptional and chromatin profiling identifies how cell states and gene-regulatory networks are modulated by stretching. Using pharmacological inhibitors and mouse mutants, we define the step-by-step mechanisms that control stretch-mediated tissue expansion at single-cell resolution in vivo.


Conflict of interest statement

Competing interests

The authors declare no competing financial interests.

Figures

Extended Data Figure 1
Extended Data Figure 1. A mouse model of mechanical stretch-mediated skin expansion.
a, Representative photographs of mice with the skin expander immediately after surgery at day (D) D0, D2, D4 and in control (CTRL) condition. Scale bar, 10 mm. The device was implanted on the back skin of the animals, close to the neck where the rigidity of the proximate cervical spines allows the hydrogel to stretch the skin during the inflation of the expander. Control mice were operated upon similarly but without introducing the hydrogel. b, Timeline of the experiment. CD1 mice were operated to place the expander and followed over time. c, Scheme showing the growth of the hydrogel. The arrows indicate the radius of the hemisphere. d, Hydrogel volume (measured by the height of the hydrogel and calculated as the volume of a hemisphere, see Methods, n=5 D0, n=13 D0.5, n=13 D1, n=13 D2, n=7 D3, n=13 D4, n=10 D6, n=6 D8, n=8 D10, n=5 D14 mice). en, Transmission electron microscopy (TEM) of ultrathin sections of control (e, g, h, i, j) and expanded (f, k, l, m, n) epidermis. In e and f, dashed yellow lines denote dermal-epidermal boundary and boxed area in pink, cerulean, orange and green are shown at higher magnification respectively in g and k, h and l, i and m, j and n. Scale bar, 5 μm. g, k, Keratin bundles. h, l, Ultrastructural analysis of cell-cell adhesion. i, m, Desmosomes. j, n, Hemidesmodomes. o, Quantification of the intercellular spacing on images as in h and l. Wilcoxon signed-rank test, two-sided. p, Quantification of the width of the desmosomes as in i and m. q, Quantification of the width of the number of hemidesmosomes per μm in j and n. r, Trans-epithelial water loss (TEWL) measurements from n=3 CD1 mice in CTRL and at different time point during expansion. s, Immunohistochemistry for the adherens junctions (AJ) component β-catenin, n=3 independent experiments. t, v, Representative images of AJ component p120-catenin (t) and E-cadherin (v) colour-coded for the signal intensity with ImageJ. Protein expression is visualized as a colour gradient going from black to yellow, with black as indicator of no expression and yellow as indicator of maximal expression. Scale bar, 10 μm. u, w, Quantification of the average integrated density signal for p120-catenin (u) and E-cadherin (w). Each data point is the average of 3 sections per mouse (n=3 mice per condition). o-q, The quantifications are made on n=3 different animals per condition on 10 different samples per mouse and represented as mean + s.e.m. g-n, Scale bar, 500 nm. d, p, q, r, u, w, Two-tailed Mann–Whitney test, mean + s.e.m.
Extended Data Figure 2
Extended Data Figure 2. Adhesion remodelling and inflammatory response during stretch-mediated skin expansion.
a, c, e, Representative images of the tight junction (TJ) components ZO-1 (a) and Claudin-1 (c) and of Vinculin (e) colour-coded for the signal intensity with ImageJ. Protein expression is visualized as a colour gradient going from black to yellow, with black as indicator of no expression and yellow as indicator of maximal expression. Scale bar, 10 μm b, d, f, Quantification of the average integrated density signal for ZO-1 (b), Claudin-1 (d) and Vinculin (f). The number of mice per condition is indicated. g, i, Immunostaining for K14 (red), inflammatory cells stained with CD45 (g) and macrophages stained with CD68 (i) (green) and Hoechst for nuclei (blue) on tissue sections. Scale bar, 10 μm. White arrows indicate positive cells, n=3 independent experiments. h, j, Percentage of CD45 (h) and CD68 (j) positive cells on the total dermal cells quantified based on the nuclear staining, n=3 mice per condition, mean per mouse + s.e.m. k, mRNA expression analysis for the indicated gene in Untreated (Unt., black) skin and skin treated with Dexamethasone (Dexa., grey). Fold change is expressed compared to one Unt. sample, n=3 mice per condition, mean per mouse + s.e.m. l, Maximum intensity projection of confocal pictures showing immunostaining for K14 (red), BrdU (green) and Hoechst for nuclei (blue) 4 hours following BrdU administration on whole mount epidermis. Scale bar, 10 μm. m, Proportion of basal cells that are BrdU positive (n=3,694 cells counted from 3 mice for Untreated and n=3,764 cells from 3 mice for the Dexamethasone treatment). a, c, e, g, i, Dashed lines indicate the basal lamina. b, d, f, m, Two-tailed Mann–Whitney test, mean per mouse + s.e.m.
Extended Data Figure 3
Extended Data Figure 3. Clonal analysis of epidermal SC during homeostasis, TPA treatment and stretch-mediated skin expansion.
a, Genetic labelling strategy used to trace K14 IFE SC in the back skin during homeostasis and stretch-mediated tissue expansion. b, Timeline of the experiment. K14CREER-RosaConfetti mice were induced with Tamoxifen at 2 months of age and operated upon 3.5 days after to place the expander. The samples were collected 0, 1, 2, 4, 8, 10 and 14 days after surgery. c, Raw distribution of clone size taken from mouse back skin under normal homeostatic conditions (CTRL) at different time points based on basal (top) and total (bottom) cell number. Note that times are calibrated so that the “day 0” time-point is acquired 3.5 days after Tamoxifen injection, requiring effective chase times to be calibrated accordingly, see (b). D0: 115 clones from n=7 mice; D2: 175 clones from n=7 mice; D4: 136 clones from n=5 mice; D8: 159 clones from n=3 mice; D10: 146 clones from n=3 mice. d, Time line of the experiment to perform clonal tracing upon TPA treatment. K14CREER-RosaConfetti mice were induced with Tamoxifen at 2 months of age and after 3.5 days topically treated with 12-0-Tetradecanoylphorbol-13-acetate (TPA) for 2 consecutive days. The samples were collected 1 and 14 days after treatment. e, Maximum intensity projection of representative confocal pictures showing immunostaining for K14 (red) and BrdU (green) following BrdU administration on whole mount epidermis form mice treated with TPA or with vehicle (CTRL). Hoechst nuclear staining in blue. Scale bar, 20 μm. f, Percentage of BrdU positive cells in control and mice treated with TPA at D1 (n = 5). Two-tailed Mann–Whitney test, mean + s.e.m. g, Raw distribution of clone size taken from mouse back skin during TPA treatment (TPA) based on basal (top) and total (bottom) cell number. D1: 85 clones from n=4 mice; D14: 54 clones from n=5 mice. h, Raw distribution of clone size taken from mouse back skin under stretch-mediated tissue expansion (EXP) at different time points based on basal (top) and total (bottom) cell number. As with control, note that times are calibrated so that the “day 0” time-point is acquired 3.5 days after Tamoxifen injection, requiring effective chase times to be calibrated accordingly. D2: 231 clones from n=4 mice; D4: 197 clones from n=4 mice; D8: 199 clones from n=4 mice; D10: 157 clones from n=4 mice. i, Table showing the abundance (raw counts) of clones by their basal and suprabasal cell composition from the CTRL D2 condition (i.e. 5 days post-induction), n= 203 clones from 7 mice. j, Table showing the abundance (raw counts) of clones by their basal and suprabasal cell composition from the EXPD2 condition, n= 283 clones from 4 mice. k, Fit of the one-progenitor model to the average size of persisting clones in control conditions based on the basal (black) and total (blue) cell content. Points show data and lines are the results of the fit to a one-compartment model (see Methods). l-o, Fit to the one-progenitor cell model. Clone persistence (l), labelled cell fraction (m), and the distribution of basal (upper) and total (lower) clone size (o). Points show data and lines are the results of the fit to a one-progenitor model. k, l, m, o, D0: 115 clones from n=7 mice; D2: 175 clones from n=7 mice; D4: 136 clones from n=5 mice; D8: 159 clones from n=3 mice; D10: 146 clones from n=3 mice; D14: 195 clones from n=4 mice. n, p, Sensitivity analysis of the model fits depicted as a map of the total square-differences of the experimental basal/total clone size data and the respective model predictions as a function of the average division time, 1λ, and the degree of imbalance towards stem cell loss/replacement, r, (see Methods). Panels (n) shows the results of one-progenitor model and the CTRL data, (p) shows the results of two-progenitor model and the CTRL data. These results show both the enhanced accuracy of the two-progenitor model over the one-progenitor model, despite involving the same number of fit parameters. k-m, Mean + s.d. o, Mean + s.e.m.
Extended Data Figure 4
Extended Data Figure 4. Fit of the data to the two-progenitor model.
a, Fit of the model to the clone size distribution under homeostatic control conditions. Note that, with 1/λ = 4.6 days and r = 0.21, the model faithfully reproduces both the exponential-like clone size distribution and the predominance of clones bearing an even number of basal and total cell numbers. Mean + s.e.m. D0: n=115 clones from 7 mice; D2: n=175 clones from 7 mice; D4: n=136 clones from 5 mice; D8: n=159 clones from 3 mice; D10: n=146 clones from 3 mice; D14: n=195 clones from 4 mice. b, Change of division time (1λ) during stretch-mediated expansion as parameterised from the measured rate of BrdU incorporation, Fig. 1e. c, Change in the probability of symmetric division (parameter, r) during stretch-mediated skin expansion obtained from a fit of the two-compartment model to the clone size data (for details, see Supplementary Note). d, Corresponding fit of the two-compartment model to the clone size distribution during stretch-mediated expansion. The model accurately reproduces both the exponential-like clone size distribution and the predominance of clones bearing an even number of basal and total cell numbers. Notably, the sharp increase in even-sized clones at long times can only be recovered by limiting the frequency of renewing divisions well below that of the control value. Mean + s.e.m. D2: n=231 clones from 4 mice; D4: n=197 clones from 4 mice; D8: n=199 clones from 4 mice; D10: n=157 clones from 4 mice. e, Fit of the model to the clone size distribution at D14 under TPA treatment. Note that with 1/λ = 2.3 days and r = 0.15, the model faithfully reproduces both the exponential-like clone size distribution and the predominance of clones bearing an even number of basal and total cell numbers. Mean + s.e.m. D1: n=85 clones from 4 mice; D14: n=54 clones from 5 mice. f, g, Sensitivity analysis of the model fits depicted as a map of the total square-differences of the experimental basal/total clone size data and the respective model predictions as a function of the average division time, 1/λ, and the degree of imbalance towards stem cell loss/replacement, r, (see Methods). Panels (f) shows the results of the results of two-progenitor model and the EXP data, and (g) shows the results of two-progenitor model and the TPA data. For the EXP data (f), we have imposed the measured relative variation of the proliferation rate (as inferred from BrdU incorporation) (Fig. 1e and panel (b)) and an inferred relative variation of the r parameter as obtained from a model fit (c), while the two parameters in panel (f) represent variation in the net rates. h, Representative orthogonal confocal sections immunostained for K14 (red), K10 (green) following short-term BrdU (white) incorporation identifying cells biased for renewal (K14+/K10-), cells primed for differentiation (K14+/K10+) and differentiated cells (K14-/K10+). i, Percentage of the type of divisions in CTRL (108 divisions from n=4 mice) and EXP D2 (254 divisions from n=4 mice) based on short-term BrdU tracing and staining as in h. Two-tailed Mann–Whitney test, mean + s.e.m.
Extended Data Figure 5
Extended Data Figure 5. Genetic signature of TPA treated and expanded epidermis.
a, Representative FACS plots showing the strategy used to isolate basal cells. Single living cells were gated by debris exclusion (P1), DAPI exclusion (P2), doublet elimination (P3) and basal IFE Integrin-α6high CD34neg cell were sorted (P4). n=10 independent experiments. b, c, mRNA expression of genes that were upregulated in basal cells at EXP D4 (n = 3) and in cells treated with TPA (n = 2). These genes are related to a generic stress signature (b), regulating ECM remodeling and cytoskeleton, important for cell survival and cell cycle (c). Bars are mean with s.e.m. d, Representative images of Paxillin immunostaining color-coded for the signal intensity with ImageJ. Protein expression is visualized as a color gradient going from black to yellow with black as indicator of no expression and yellow as indicator of maximal expression. Scale bar, 10 μm e, Quantification of the average integrated density signal for Paxillin as in d. Each data point is the average of 3 sections per mouse (n = 3 mice per condition). f, Geometric mean fluorescence intensity for the indicated integrin in CTRL (grey, n = 4 mice) and EXP D4 (red, n = 6 mice) from FACS analysis of basal IFE Integrin-α6high CD34neg cells. g-k, ATAC-seq profiles showing increasing accessibility of chromatin regions that are specifically remodeled during mechanical expansion (CTRL in grey and EXP D2 in orange). l, Quantification of the number of cells FOSL1+ in the basal layer related to Fig. 3d. m, Immunostaining on skin sections for c-JUN (white) in control and EXP D4. n, Quantification of the number of cells c-JUN+ in the basal layer related to m. o, Quantification of the number of cells p63+ in the +1 layer related to Fig. 3e. p, Quantification of the number of cells KLF4+ in the +1 layer related to Fig. 3f. q, Immunohistochemistry on paraffin sections for c-FOS in control and EXPD4. Scale bar, 20 μm. r, Quantification of the number of cells c-FOSL+ in the basal layer related to q. s, Immunofluorescence on tissue sections for pSTAT3 in green and K14 (red) to identified the epidermis. Scale bar, 20 μm. t, Quantification of the number of cells positive for pSTAT3 in the basal layer related to s. l, n, o, p, r, t, 3 sections quantified per n = number of mice and total number of cells indicated in parentheses d, m, q, s, Dashed lines delineate the basal lamina. e, f, l, n, o, p, r, t, Two-tailed Mann–Whitney test, Mean + s.e.m.
Extended Data Figure 6
Extended Data Figure 6. Single-cell RNA sequencing clustering analysis.
a, Integrated Uniform Manifold Approximation and Projection (UMAP) graphic representation of the CTRL, EXP D1, EXP D4 and TPA single-cell RNA-seq data, showing the graph-based clustering results annotated by cell type. The proliferating IFE stem cells (PROLIF. IFE SCs) are in light blue, the IFE stem cells cluster are in red (IFE SCs#1) and dark red (IFE SCs#2), the IFE committed cells (IFE CCs) cluster is in pink and the differentiated IFE cells (IFE DIFF.) are in green. The differentiated cells from the infundibulum (INF. DIFF.) are in grey, the stem cells of the infundibulum (INF. SCs.) are in black, the proliferating cells of the infundibulum (PROLIF. INF.) are in plum and the sebaceous gland cluster (SG) is in orange. The IFE stress cells (STRESS) are in dark grey and the cluster of stem cells stretch (SCs STRETCH) in yellow. n=16651 cells. b, UMAP of the different samples (CTRL, EXP D1, EXP D4, TPA) using the same integrated projection. n=4659 cells CTRL, n= 4934 cells EXP D1, n= 2716 cells EXP D4, n= 4342 cells TPA. c-k, UMAP plot of the CTRL sample colored by normalized gene expression values for genes identifying the IFE (c) versus infundibulum (d), the sebaceous gland (e) and the proliferating cells (f). Undifferentiated (g) and more differentiated cells (h) in the IFE identified the SCs cluster (i), the CCs cluster (j) and the differentiated stage (k). Gene expression is visualized as a color gradient going from grey to yellow with grey as indicator of no expression (i.e. expression values below or equal to the 50th percentile for that sample) and yellow as indicator of maximal expression. c-k, n=16651 cells. l, Table showing the specific marker genes used to annotate the different clusters.
Extended Data Figure 7
Extended Data Figure 7. Single-cell RNA sequencing clustering analysis on the IFE cells.
a, Integrated UMAP graphic representation of the IFE cells in CTRL, EXP D1, EXP D4 and TPA single-cell RNA-seq data, showing the graph-based clustering results annotated by cell type. The proliferating stem cells (PROLIF.) are in light blue, the stem cells clusters are in red and dark red (SCs#2), the committed cells (CCs) cluster is in pink and the differentiated cells (DIFF.) are in green. The stress cells (STRESS) are in dark grey and the cluster of stem cells stretch (SCs STRETCH) in yellow. n=12747 cells. b, UMAP of the different samples (CTRL, EXP D1, EXP D4, TPA). c, Predicted cell-cycle phases assigned using the cyclone function from scran tool and visualized in the UMAP. Cells in G1 are in light blue, cells in G2/M are in orange and cells in S phase are in red. b-d, n=3142 cells CTRL, n=3756 cells EXP D1, n=2145 cells EXP D4, n=3704 cells TPA. d, Percentage of cells in the different cycling phase calculated on the total number of cells. e-h, UMAP plot colored by normalized gene expression values for the indicated gene and in the indicated sample. Gene expression is visualized as a color gradient going from grey to yellow with grey as indicator of no expression and yellow as indicator of maximal expression. n=3142 cells CTRL, n=3756 cells EXP D1.
Extended Data Figure 8
Extended Data Figure 8. Pseudotime analysis for single-cell RNA sequencing.
a, UMAP plots coloured by the degree of regulon activation for TFs differentially activated (AUC rank-sum test FDR corrected p-value < 0.05) in the different conditions. Colour scaling represents the normalized AUC value of target genes in the regulon being expressed as computed by SCENIC. b, Heatmap representation of the top 20 gene expression changes along the inferred pseudotime trajectory computed with Slingshot for the CTRL IFE. c, Heatmap representation of the top 20 gene expression changes along the inferred pseudotime homeostatic trajectory computed with Slingshot for the EXP D1 IFE. d, Heatmap representation of the top 20 gene expression changes along the inferred pseudotime trajectory computed with Slingshot characterising the stress state for the EXP D1 IFE. b-d, Columns represent cells ordered by their position along the pseudotime trajectory; rows represent genes whose expression profiles show highest correlation (FDR-correted p-value < 0.01) with the pseudotime variable, calculated using a generalized additive model (GAM). The colour scaling of the cells represents the normalized expression value of a gene in a particular cell, scaled by Z-score. a-d, n= 3142 cells CTRL, n= 3756 cells EXP D1.
Extended Data Figure 9
Extended Data Figure 9. Cell contractility in stretch-mediated tissue expansion.
a, Scheme of the genetic strategy to delete Diaph3 in the epidermis. b, Protocol to delete Diaph3 during stretch-mediated tissue expansion. c, Orthogonal views of confocal analysis of immunostaining for K14 (red) marking basal cells and Phalloidin (green) to visualize F-actin and Hoechst for nuclei (blue) in whole mounts of IFE in CTRL from a CD1 mouse, EXP D1 from a CD1 or KI4CRE DIAPH3fl/fl (Diaph3 cKO) mouse. Scale bar, 10 μm. d, Percentage of cells with F-actin fibers in the apical side of basal cells related to c (n = 4 mice per condition). e, Orthogonal views of confocal analysis of immunostaining for K14 (red) marking basal cells, BrdU (green) and Hoechst for nuclei (blue) in whole mounts of IFE from K14CRE DIAPH3fl/+ (Diaph3 WT) and KI4CRE DIAPH3fl/fl (Diaph3 cKO) mice during expansion. Scale bar, 20 μm. Epidermal Diaph3 cKO were born at a Mendelian ratio and did not present obvious pathological phenotypes. n=3 independent experiments. f, Immunostaining for the basal marker K14 (red) and the suprabasal markers K1 and K10 (green) in Diaph3 WT and Diaph3 cKO mice in EXP D2 and EXP D4. Scale bar, 20um. g, Epidermal thickness of Diaph3 WT and Diaph3 cKO mice in EXP D2 and EXP D4 (three measurements taken with ImageJ on two sections per mouse, n = at least 3 mice for the different conditions). h, Scheme of the genetic strategy to delete Myh9 in the epidermis. i, Protocol to delete Myh9 during stretch-mediated tissue expansion. j, Immunohistochemistry for MYH9 in untreated and Tamoxifen induced K14CREER MYH9fl/fl mice. Scale bar, 20um. n=3 independent experiments. k, Orthogonal views of confocal analysis of immunostaining for K14 (white), BrdU (red) and Hoechst for nuclei (blue) in whole mounts of IFE in Myh9 WT and Myh9 cKO mice during expansion. Scale bar, 20 [jm. 1, Epidermal thickness of Myh9 WT and Myh9 cKO mice in EXP D2 and EXP D4 (three measurements taken with ImageJ on two sections per mouse, n = at least 3 mice for the different conditions). m-r, Analysis of adherens-junctions in Diaph3 cKO and Myh9 cKO mice. m, o, q, Representative images of adherens junction (AJ) component α-catenin (m), the α18 tension sensitive form of α-catenin (α18-cathenin) (o) and Vinculin (q), colour-coded for the signal intensity with ImageJ. Protein expression is visualized as a colour gradient going from black to yellow, with black as indicator of no expression and yellow as indicator of maximal expression. Dashed lines indicate the basal lamina. Scale bar, 10 μm. n, p, r, Quantification of the average integrated density signal for α-catenin (m), α18-cathenin (o) and Vinculin (q). Each data point is the average of 3 sections per mouse (n=5 mice per condition). d, g, l, n, p, r, Two-tailed Mann–Whitney test, mean + s.e.m.
Extended Data Figure 10
Extended Data Figure 10. MEK/ERK/AP1, YAP-TAZ and MAL/SRF regulate stretch-mediated proliferation.
a, b, Protocol for Trametinib or Pimasertib treatment in CD1 mice operated to place the expander and scarified at D2, D4 (a) and D8 (b) after surgery. c, Immunohistochemistry for pERK on paraffin sections of epidermis form CD1 mice untreated or treated with the indicated drug at EXP D2. d, Quantification of the proportion of BrdU positive cells during expansion at the indicated time point in CD1 mice untreated or treated with Trimatenib or Pimasertib (n=at least 3 mice per condition as indicated, total number of cells analyzed indicated in parentheses). e, f, Immunohistochemistry for FOSL1 (e) and immunofluorescence for JUN (f) on sections of epidermis from CD1 mice untreated or treated with the indicated drug at EXP D2. g, Epidermal thickness measured with ImageJ on tissue sections at EXP D8 in CD1 mice untreated or treated with the indicated drug (n=5 mice untreated, n=4 mice Trametinib, n=3 mice Pimasertib, 3 measurements on at least 2 sections per mouse). h, Immunostaining (white) for YAP1 on skin sections in the control and in EXP D1. White arrows indicate nuclear localization. i, Quantification of YAP1 subcellular localization, bars and error bars represent the mean and s.e.m. Nuclear (N) > Cytosplasm (C), more YAP1 in nucleus than in cytoplasm, N = C, similar level of YAP1 in nucleus than in cytoplasm, N < C, less YAP1 in nucleus than in cytoplasm (n=150 cells for all samples except n=120 for EXP D8). j, Quantification of MAL subcellular localization, presented as mean and s.e.m. N > C, more MAL in nucleus than in cytoplasm, N = C, similar level of MAL in nucleus than in cytoplasm, N < C, less MAL in nucleus than in cytoplasm (n=150 cells for all samples except n=120 for EXP D8). k, l, Immunostaining (white) for MAL (k) and JUN (l) on skin sections in the control and in EXP D1. White arrows indicate nuclear localization. m, n, Scheme of the genetic strategy to delete YAP-TAZ in the epidermis (m) and protocol to delete YAP and TAZ in stretch-mediated tissue expansion (n). o, Immunohistochemistry for YAP (top) and TAZ (bottom) in K14CREER YAP-TAZfl/fl mice before and after Tamoxifen administration. p, Orthogonal views of confocal analysis of immunostaining for K14 (red) marking basal cells, BrdU (green) and Hoechst for nuclei (blue) in whole mounts of IFE in YAP-TAZfl/fl (YAP-TAZ WT) or K14CREER YAP-TAZfl/fl (YAP-TAZ cKO) mice at the indicated time point following expansion. q, Epidermal thickness of YAP-TAZ WT and YAP-TAZ cKO mice in EXP D2 and EXP D4 (three measurements taken with ImageJ on two sections per mouse, n=at least 4 mice per condition). r, Protocol to inhibit MAL with the CCG203971 small molecule during stretch-mediated tissue expansion. s, Quantification of MAL subcellular localisation in EXP D2 and EXP D4 mice treated or not with the MAL inhibitor. N > C, more MAL in nucleus than in cytoplasm, N = C, similar level of MAL in nucleus than in cytoplasm, N < C, less MAL in nucleus than in cytoplasm (n=150 cells per condition). Data are presented as mean and s.e.m. t, Orthogonal views of confocal analysis of immunostaining for K14 (red) marking basal cells, BrdU (green) and Hoechst for nuclei (blue) in whole mounts of IFE in mice treated with the MAL inhibitor or with vehicle control (untreated) at the indicated time point following expansion. u, Epidermal thickness of CD1 mice in EXP D2 and EXP D4 treated or not with the MAL inhibitor (three measurements taken with ImageJ on two sections per mouse, n=3 for untreated mice, n=5 for treated animals). c, e, f, h, k, l, o, p, t, Scale bar, 20μm. n=3 independent experiments. c, e, f, h, k, l, o, Dashed lines delineate the basal lamina. d, g, q, u, Two-tailed Mann–Whitney test, mean + s.e.m.
Extended Data Figure 11
Extended Data Figure 11. Pathways associated with stretch-mediated tissue expansion.
a, Protocol used to delete YAP and TAZ and to inhibit MAL with CCG203971 treatment in K14CREER YAP-TAZfl/fl mice in EXP D2. b, Orthogonal views of immunostaining for K14 (red) to mark basal cells, BrdU (green) and Hoechst for nuclei (blue) on whole mounts of IFE in YAP-TAZ WT untreated mice and YAP-TAZ cKO mice treated with the MAL inhibitor at 2 days after the expander placement. Scale bar, 20 μm. c, Proportion of BrdU positive cells in untreated YAP-TAZ WT mice (48615 cells from 3 mice) and in YAP-TAZ cKO mice treated with the MAL inhibitor (78282 cells from 5 mice). Two-tailed Mann–Whitney test, mean + s.e.m. d, Epidermal thickness of YAP-TAZ WT untreated (n=3) and YAP-TAZ cKO treated with the MAL inhibitor in EXP D2 (n=5), three measurements taken with ImageJ on two sections per mouse. Two-tailed Mann–Whitney test, mean + s.e.m. e, f, Quantification of YAP1 (e) and MAL (f) subcellular localization, presented as mean and s.e.m. in CTRL and EXP D2. N > C, more protein in nucleus than in cytoplasm, N = C, similar level of protein in nucleus than in cytoplasm, N < C, less protein in nucleus than in cytoplasm (n=150 cells per condition). g, h, Percentage of the type of divisions in CTRL (g) and EXP D2 (h) in YAP-TAZ WT mice and YAP-TAZ cKO mice based on the short-term BrdU tracing and staining as in Extended Data Fig. 4h. i, j, Percentage of the type of divisions in CTRL (i) and EXP D2 (j) in Untreated mice and with MAL inhibitor based on the short-term BrdU tracing and staining as in Extended Data Fig. 4h. k, l, Percentage of the type of divisions in CTRL (k) and EXP D2 (l) in Untreated mice and with Trametinib based on the short-term BrdU tracing and staining as in Extended Data Fig. 4h. g-l, The number of counted divisions is indicated in parenthesis from n=number of mice. Two-tailed Mann–Whitney test, mean + s.e.m.
Extended Data Figure 12
Extended Data Figure 12. Single-cell data analysis after MEK and MAL inhibition.
a, Average size of persisting clones in mice treated with MAL inhibitor during expansion, based on the basal (black) and total (blue) cell content. Points show data and lines denote the results from the fit to the two-compartment model (see main text and Methods). D0: n=115 clones from 7 mice; D2: n=86 clones from 3 mice; D4: n=83 clones from 3 mice. b, Average size of persisting clones in mice treated with Trametinib during expansion, based on the basal (black) and total (blue) cell content. Points show data and lines denote the results from the fit to the two-compartment model (see main text and Methods). D0: n=115 clones from 7 mice; D2: n=84 clones from 3 mice; D4: n=80 clones from 4 mice; D8: n=81 clones from 3 mice. c, Fit of the model to the clone size distribution during expansion upon MAL inhibition with 1/λ = 3.8 days and r = 0.08. D0: n=115 clones from 7 mice; D2: n=86 clones from 3 mice; D4: n=83 clones from 3 mice. d, Least-square values indicate the sensitivity of the fit parameters in (c). e, Fit of the model to the clone size distribution during expansion upon Trametininb treatment with 1/λ = 4.3 days and r = 0.17. D0: n=115 clones from 7 mice; D2: n=84 clones from 3 mice; D4: n=80 clones from 4 mice; D8: n=81 clones from 3 mice. f, Least-square values indicate the sensitivity of the fit parameters in (e). g, Predicted cell-cycle phases assigned using the cyclone function from scran tool of EXP D1 Untreated IFE, EXP D2 IFE treated with the MAL inhibitor and EXP D2 IFE treated with Trametinib. Cells in G1 are in grey, cells in G2/M are in blue and cells in S phase are in red. The percentage of cells in the different cycling phases is calculated on the total number of cells. h, Table showing the values of the percentage of the different cellular clusters in Figure 4j,k. a, b, Mean + s.d. c, e, Mean + s.e.m.
Figure 1
Figure 1. Inflated hydrogel mediates skin expansion.
a, Membranous signal (pink), from PFA-perfused Rosa26-mT/mG mice. Scale bar, 15 urn. b, Area of basal cells measured from a. c, Basal cell density. Number of nuclei per 1000 μm (5 different independent areas of 40,000 μm per mouse). d, Immunostaining for K14 (red), BrdU (green) and Hoechst for nuclei (blue) on whole mount epidermis. Scale bar, 20 μm. e, BrdU positive cells. f, Immunostaining for K14 (red), K1, K10 (green) and Hoechst for nuclei (blue) on tissue sections. Scale bar, 20 μm. g, Tissue thickness, 3 independent measurements per at least 2 sections per mouse. h, j, Adherens junctions (AJ) component a-catenin (h) and the a18 tension sensitive from of a-catenin (α18-cathenin) (j) colour-coded for signal intensity with ImageJ. Protein expression is visualized as a colour gradient going from black to yellow, with black as indicator of no expression and yellow as indicator of maximal expression. Scale bar, 10 μm i, k, Average integrated density signal for α-catenin (i) and α18-cathenin (k). Each data point is the average of 5 measurements per mouse. f, h, j, Dashed line indicate the basal lamina. b, c, e, g, i, k, In parentheses the number of cells and n=number of mice. Two-tailed Mann–Whitney test, mean per mouse + s.e.m.
Figure 2
Figure 2. Clonal analysis of epidermal SC during stretch-mediated skin expansion.
a, K14CREER-RosaConfetti clones (n=4 independent experiments). Second Harmonic Generation (SHG) visualizes the collagen fibers (white). 7AAD for nuclei (blue). Scale bars, 50 μm. b-k, Clonal analysis in control (CTRL) and expansion (EXP) conditions. (b,g), Distribution of clone sizes at D14 based on basal and total cell number, (c,h), average clone size based on basal (black) and total (blue) cell content, (d,i), clone persistence, (e,j), average labelled cell fraction, and (f,k), cumulative clone size distribution at D14 showing an approximate exponential size dependence (lines). b-f, D0: 115 clones from n=7 mice; D2: 175 clones from n=7 mice; D4: 136 clones from n=5 mice; D8: 159 clones from n=3 mice; D10: 146 clones from n=3 mice; D14: 195 clones from n=4 mice. g-k, D2: 231 clones from n=4 mice; D4: 197 clones from n=4 mice; D8: 199 clones from n=4 mice; D10: 157 clones from n=4 mice; D14: 199 clones from n=4 mice. l, Schematic showing the cellular organization in a one-progenitor model and the proposed two-progenitor model of back skin interfollicular epidermis. In the two-progenitor model, the epidermis contains renewing stem cells (SC), committed cells (CC), and suprabasal cells. In homeostasis, stem cells divide at an average rate λ. With probability 1—r, this division results in asymmetric fate outcome, leading to the replacement of the partner committed cell, which in turn is lost through terminal division and stratification from the basal layer. The remaining divisions lead to the correlated loss and replacement of renewing cells through symmetric cell divisions. c-f, h-k, Mean + s.d. c, d, e, h, i, j, Points show data and lines the results of a two-progenitor model (Supplementary Note).
Figure 3
Figure 3. Transcriptional and chromatin remodelling associated with stretch-mediated skin expansion.
a, b, mRNA expression of genes upregulated in EXP D4 (n=3) compared to TPA (n=2). Bars are mean with s.e.m. of the fold change over the average value of the CTRL (n=3). c, TF motifs enriched in the ATAC-seq peaks that were upregulated in EXP D2 compared to CTRL (n=3262 target sequences, 46200 background sequences) as determined by Homer analysis using known motif search. d, Immunohistochemistry for FOSL1. e, f, Immunofluorescence for p63 (e) or KLF4 (f) in green, K14 (red) and nuclei with Hoechst (blue). d-f, Dashed lines delineate the basal lamina. Scale bar, 20 μm. n=3 independent experiments. g, Uniform Manifold Approximation and Projection (UMAP) graphic of the clustering analysis for the CTRL (n=3142 cells) and EXP D1 (n=3756 cells) IFE single-cell RNA-seq projected on an integrated embedding of the dataset. h, Violin plot of the indicated genes in EXP D1 in the SCs (n=700 cells) and SCs STRETCH (n=801 cells) clusters, see Source Data. i, UMAP plot coloured by normalized gene expression values for the indicated genes in the CTRL and EXP D1 IFE. Gene expression is visualized as a colour gradient going from grey to yellow, with grey as indicator of no expression (i.e. expression below the 50th percentile across each respective sample) and yellow as indicator of maximal expression. j, UMAP plots coloured by the degree of regulon activation for TFs differentially activated (AUC rank-sum test FDR corrected p-value < 0.05) in the different conditions. Colour scaling represents the normalized AUC value of target genes in the regulon being expressed as computed by SCENIC. k, l, Lineage trajectories (black lines) computed using Slingshot. i-l, CTRL (n=3142 cells) and EXP D1 (n=3756 cells).
Figure 4
Figure 4. Molecular regulation of stretch-mediated skin expansion.
a, BrdU positive cells in CTRL and EXP in Diaph3 WT or cKO mice. b, BrdU positive cells in CTRL and EXP in Myh9 WT and cKO mice. c, Trans-epithelial water loss (TEWL) measurements from n=2 Diaph3 WT and n=2 Myh9 WT mice (black), n=3 Diaph3 cKO mice (pink) and n=3 Myh9 cKO mice (violet). d, BrdU positive cells in CTRL and EXP in YAP-TAZ WT or cKO mice. e, TEWL measurements from n=2 YAP-TAZ WT mice (black) and n=3 YAP-TAZ cKO mice (green). f, BrdU positive cells in untreated or treated animals with the MAL inhibitor in CTRL and EXP. g, Immunostaining for YAP1 (top) and MAL (bottom) on skin sections of Diaph3 cKO and Myh9 cKO mice at EXP D4. The CTRL images are from a Diaph3 WT (top) mouse and a Myh9 WT (bottom) mouse. Dashed lines delineate the basal lamina. Scale bar, 20 μm. h, i, Quantification of YAP1 (h) and MAL (i) subcellular localization, presented as mean and s.e.m., related to g. N>C, more protein in nucleus than in cytoplasm, N=C, similar level of protein in nucleus as in cytoplasm, N<C, less protein in nucleus than in cytoplasm (n=150 cells per condition). j, UMAP computed on the integrated dataset coloured fort the different cellular clusters in IFE single-cell RNA-seq. n=3869 cells EXP D1 Untreated, n=4762 cells EXP D2 MAL inhibitor, n=3254 cells EXP D2 Trametininb. k, Percentage of the different cellular clusters in j. a-f, Mean + s.e.m. n=number of mice. Total number of cells analysed indicated in parentheses. a, b, d, f, Two-tailed Mann–Whitney test. c, e, Every data point represents the average of 30 individual subsequently recorded measurements at the probe head.

Comment in

References

    1. Zollner AM, Holland MA, Honda KS, Gosain AK, Kuhl E. Growth on demand: reviewing the mechanobiology of stretched skin. Journal of the mechanical behavior of biomedical materials. 2013;28:495–509. doi: 10.1016/j.jmbbm.2013.03.018. - DOI - PMC - PubMed
    1. Le HQ, et al. Mechanical regulation of transcription controls Polycomb-mediated gene silencing during lineage commitment. Nature cell biology. 2016;18:864–875. doi: 10.1038/ncb3387. - DOI - PubMed
    1. Nava MM, et al. Heterochromatin-Driven Nuclear Softening Protects the Genome against Mechanical Stress-Induced Damage. Cell. 2020;181:800–817.e822. doi: 10.1016/j.cell.2020.03.052. - DOI - PMC - PubMed
    1. Iskratsch T, Wolfenson H, Sheetz MP. Appreciating force and shape-the rise of mechanotransduction in cell biology. Nature reviews Molecular cell biology. 2014;15:825–833. doi: 10.1038/nrm3903. - DOI - PMC - PubMed
    1. LeGoff L, Lecuit T. Mechanical Forces and Growth in Animal Tissues. Cold Spring Harbor perspectives in biology. 2015;8:a019232. doi: 10.1101/cshperspect.a019232. - DOI - PMC - PubMed

Publication types

MeSH terms