. 2020 Aug;584(7819):102-108.
doi: 10.1038/s41586-020-2552-x. Epub 2020 Jul 29.

Epigenetic regulator function through mouse gastrulation

Affiliations

Epigenetic regulator function through mouse gastrulation

Stefanie Grosswendt et al. Nature. 2020 Aug.

Abstract

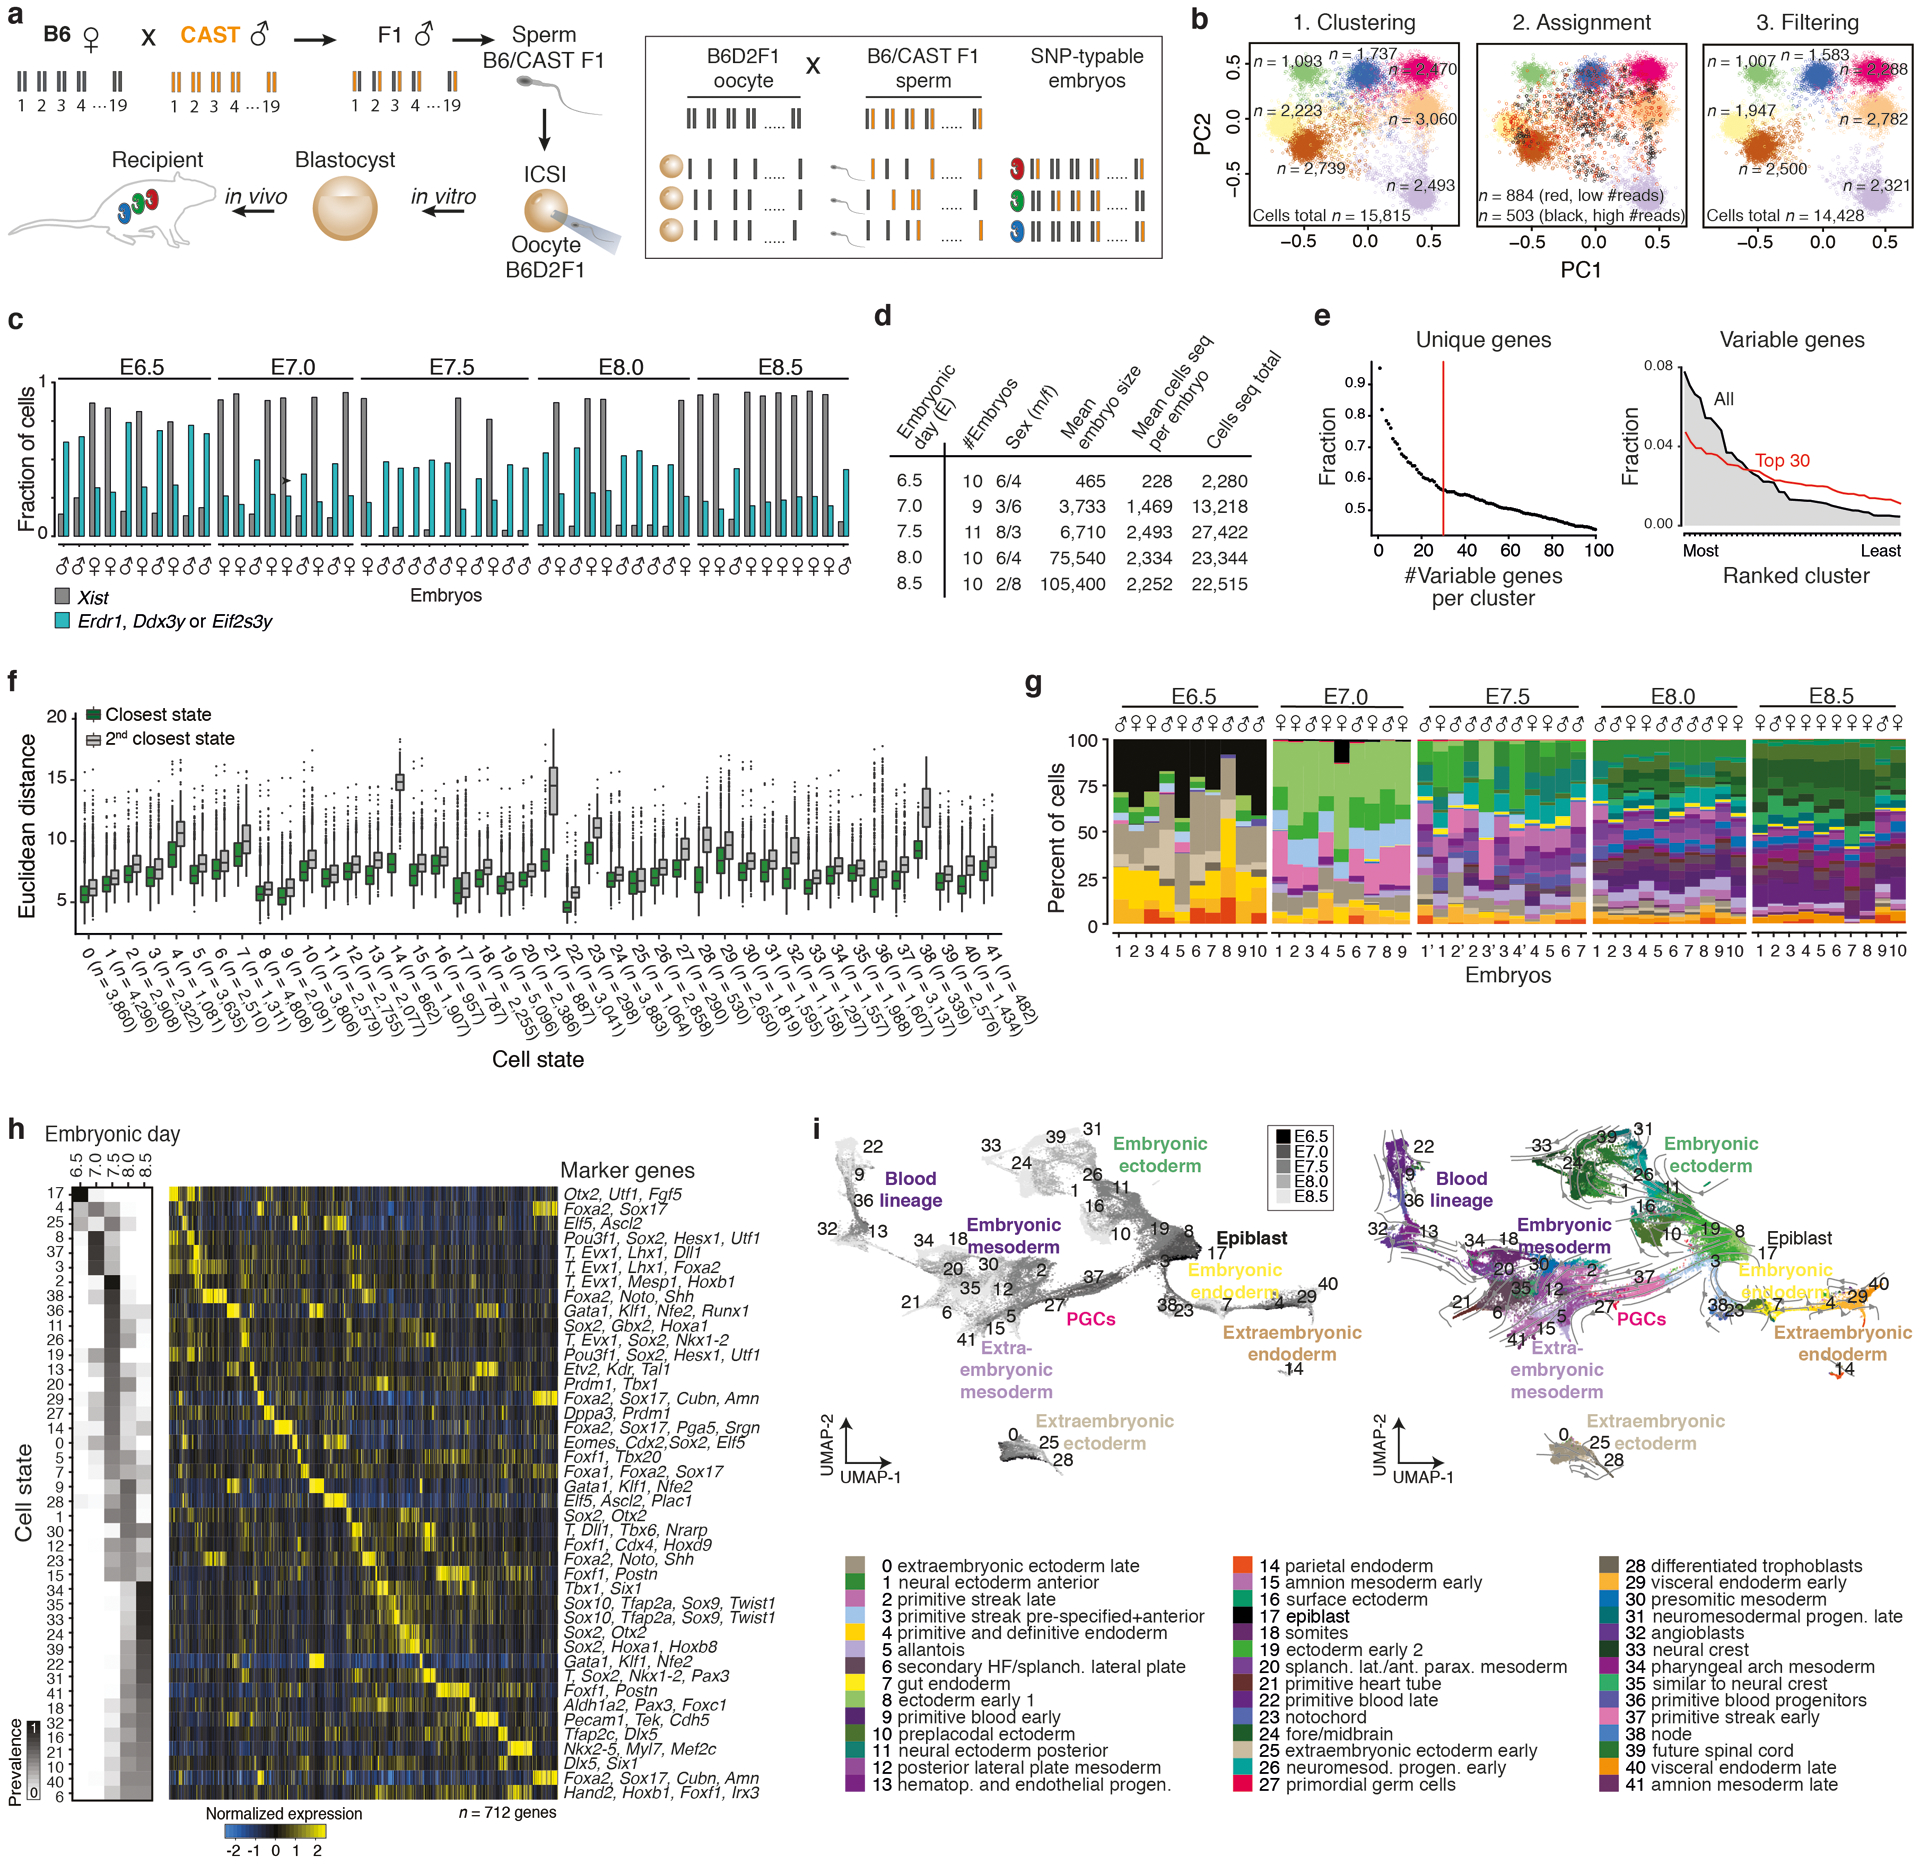
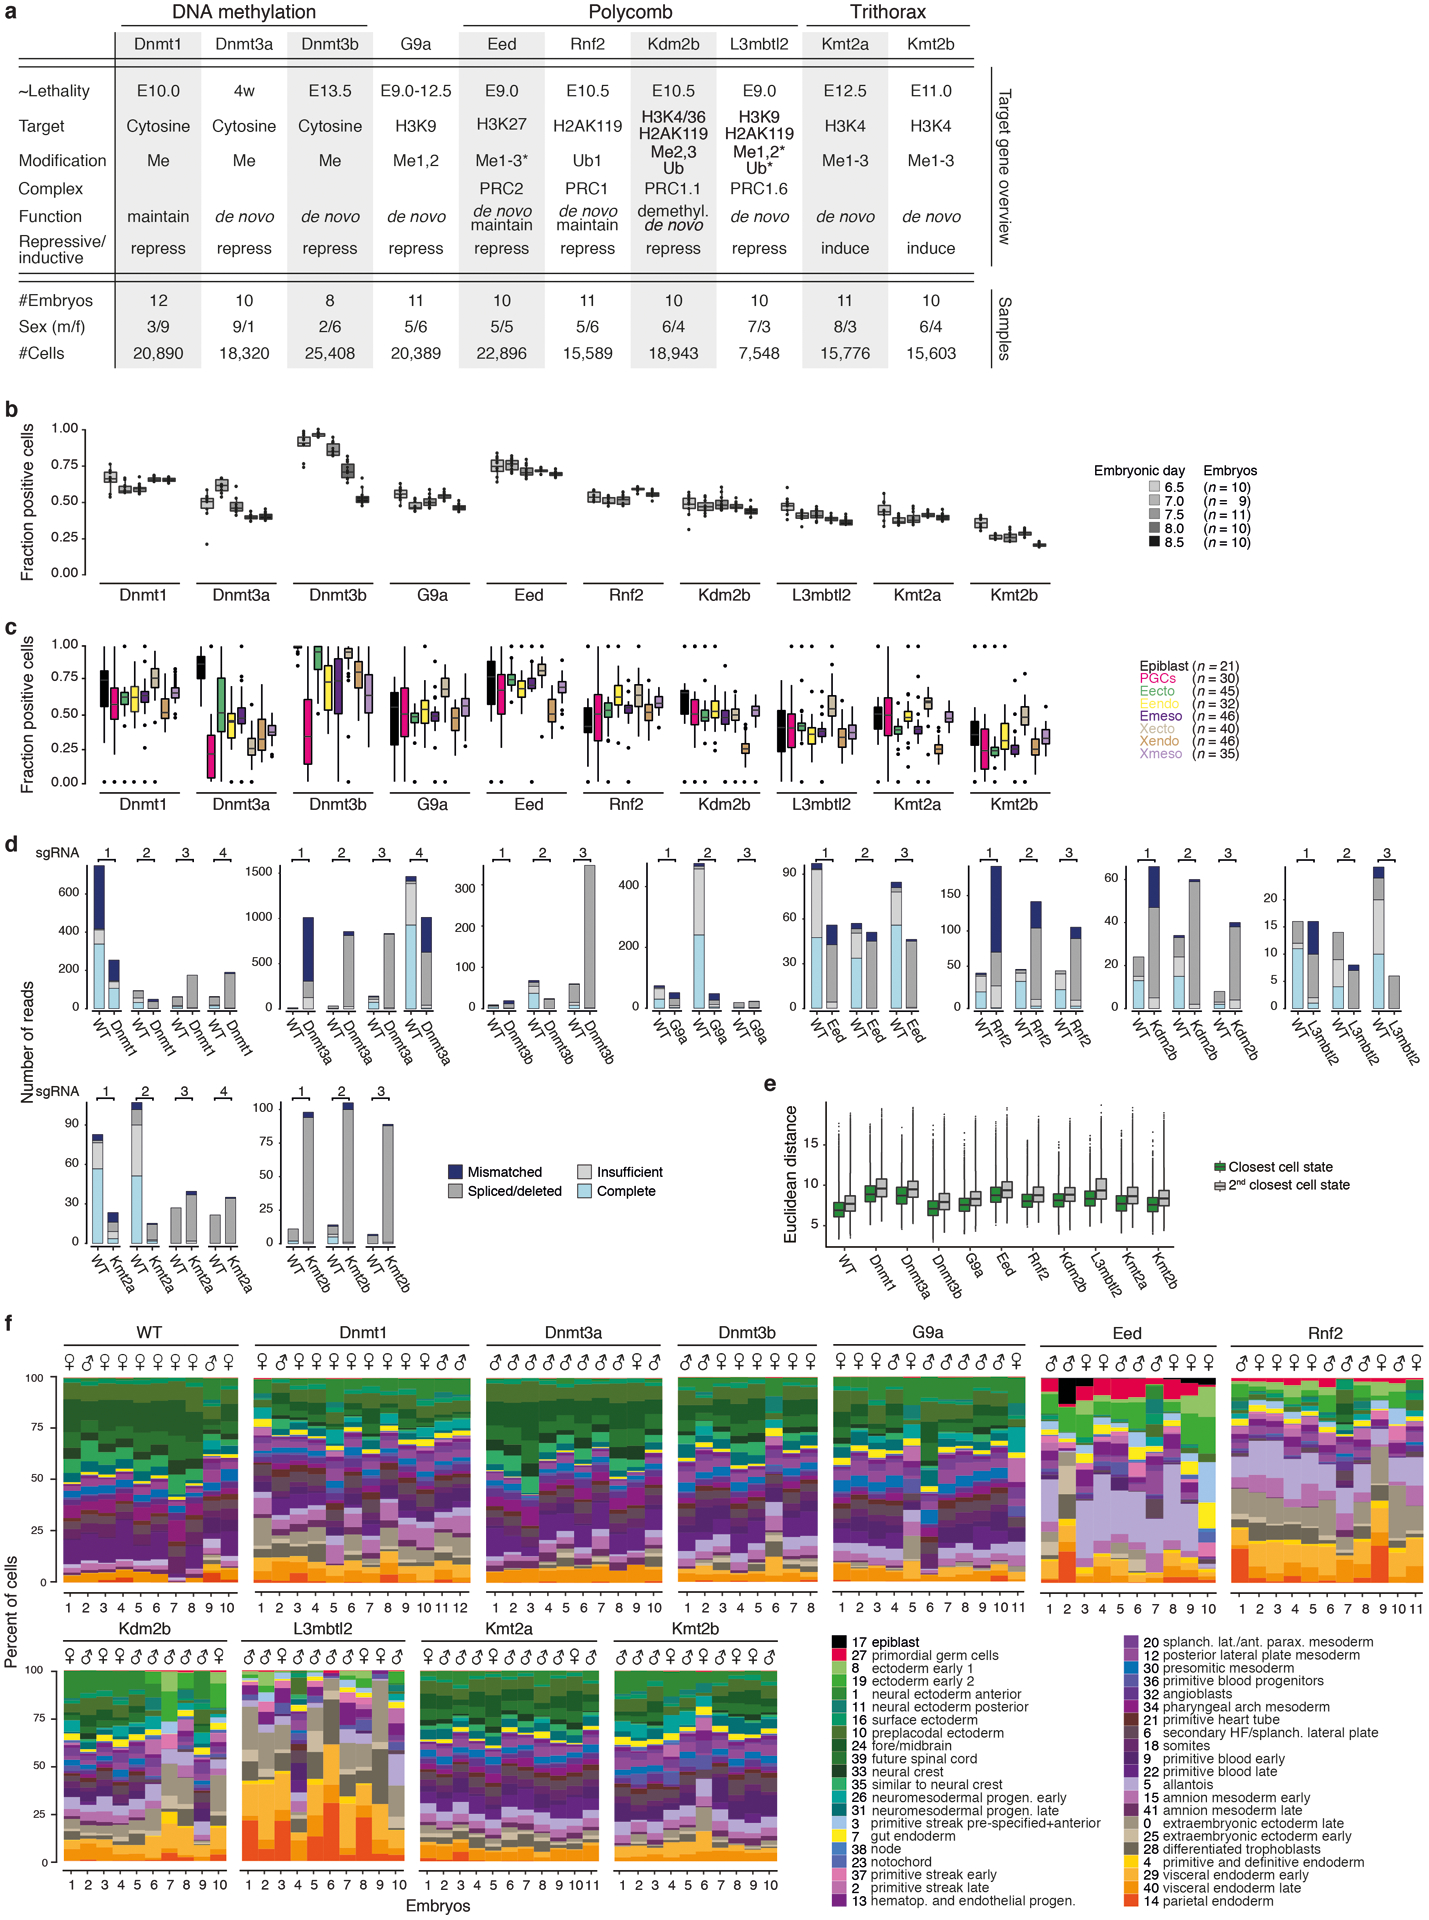
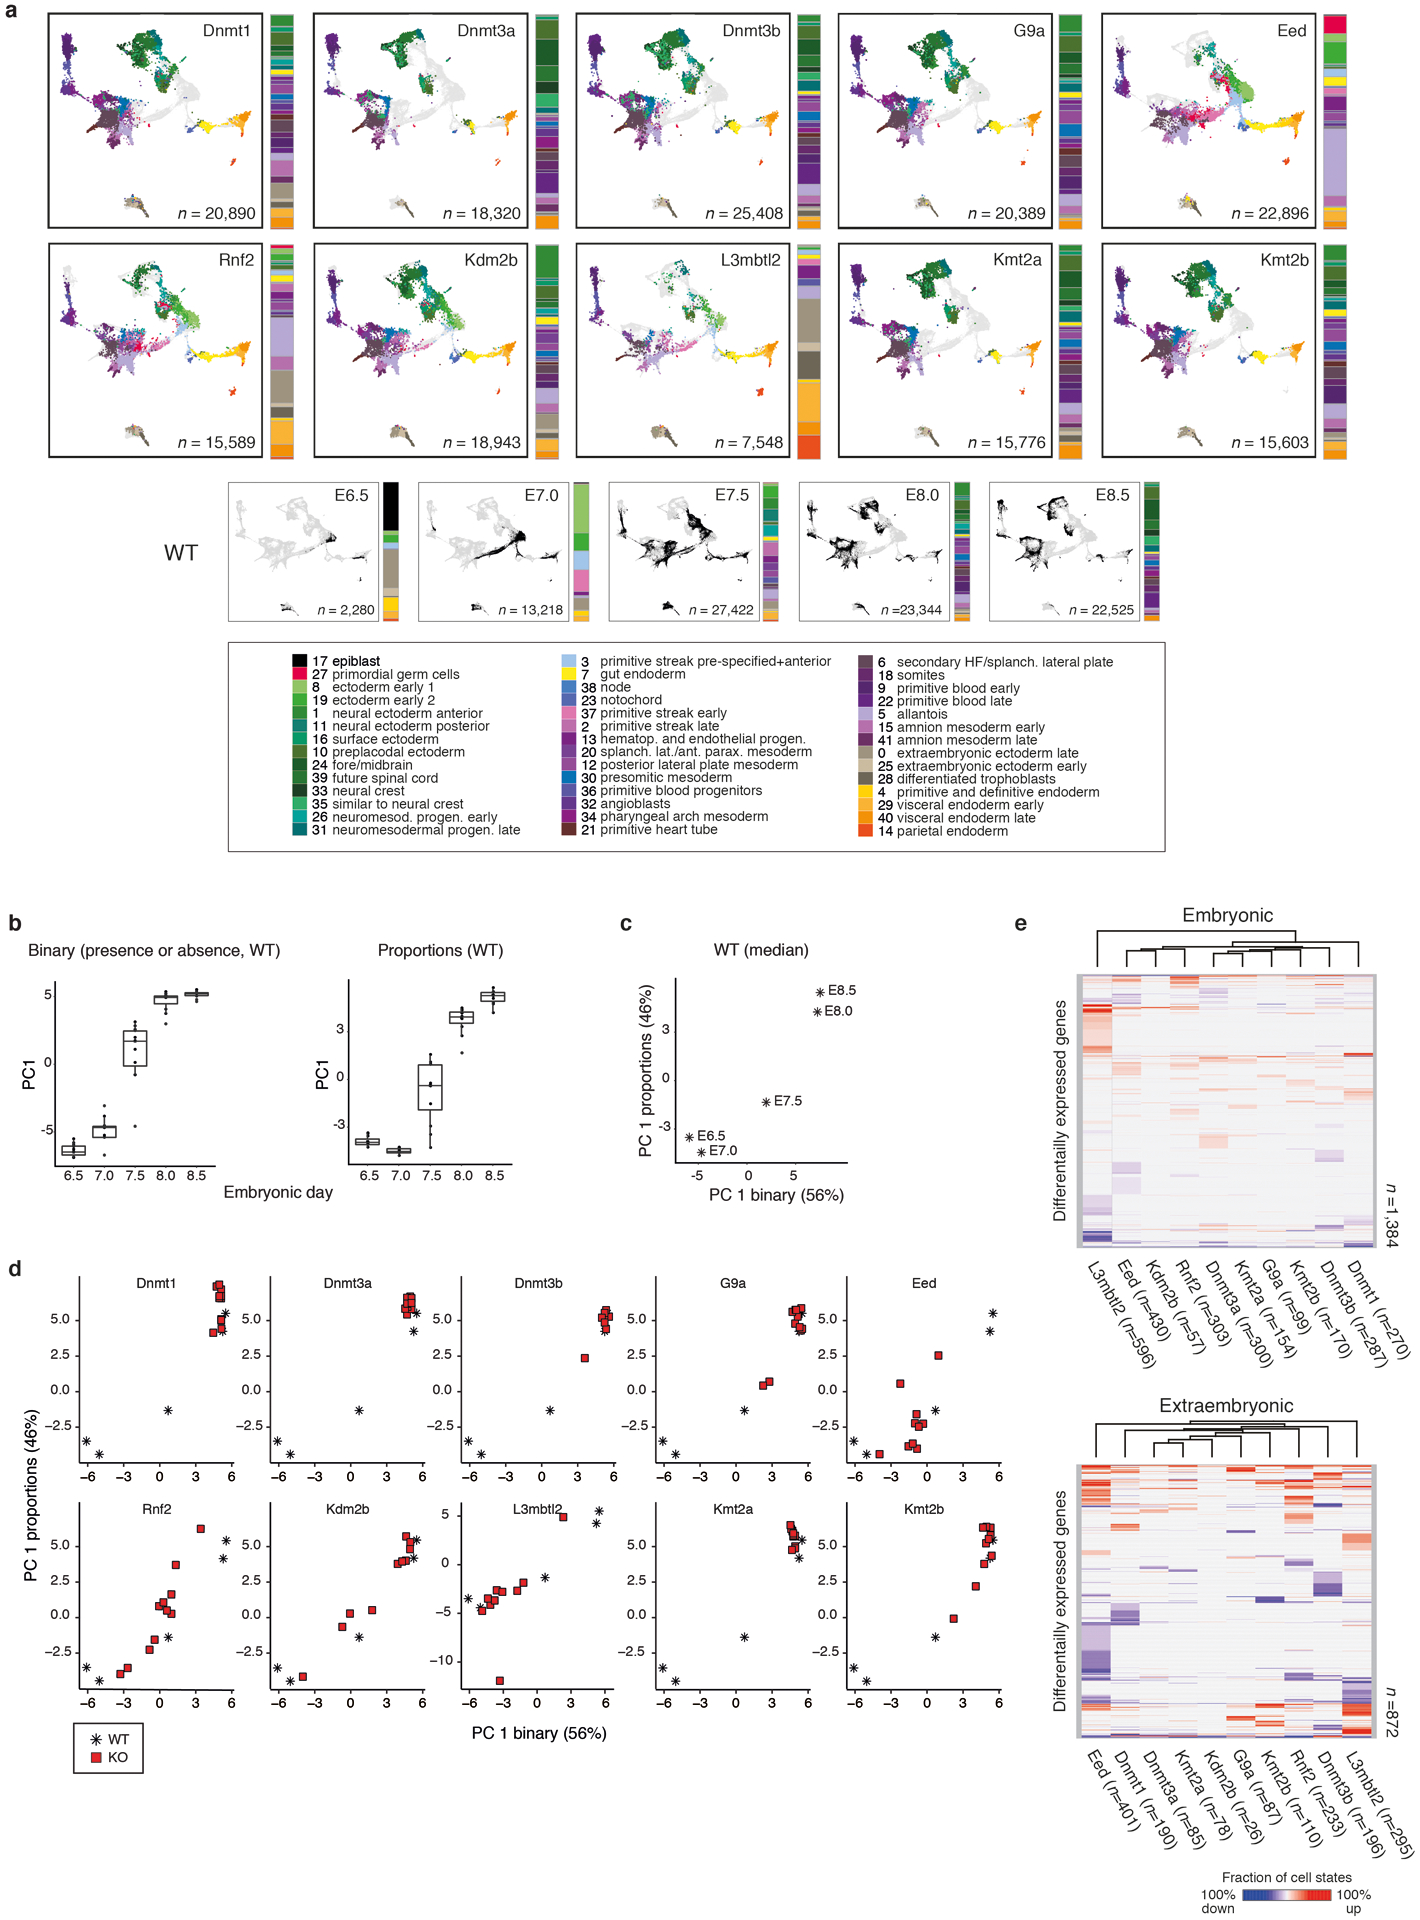
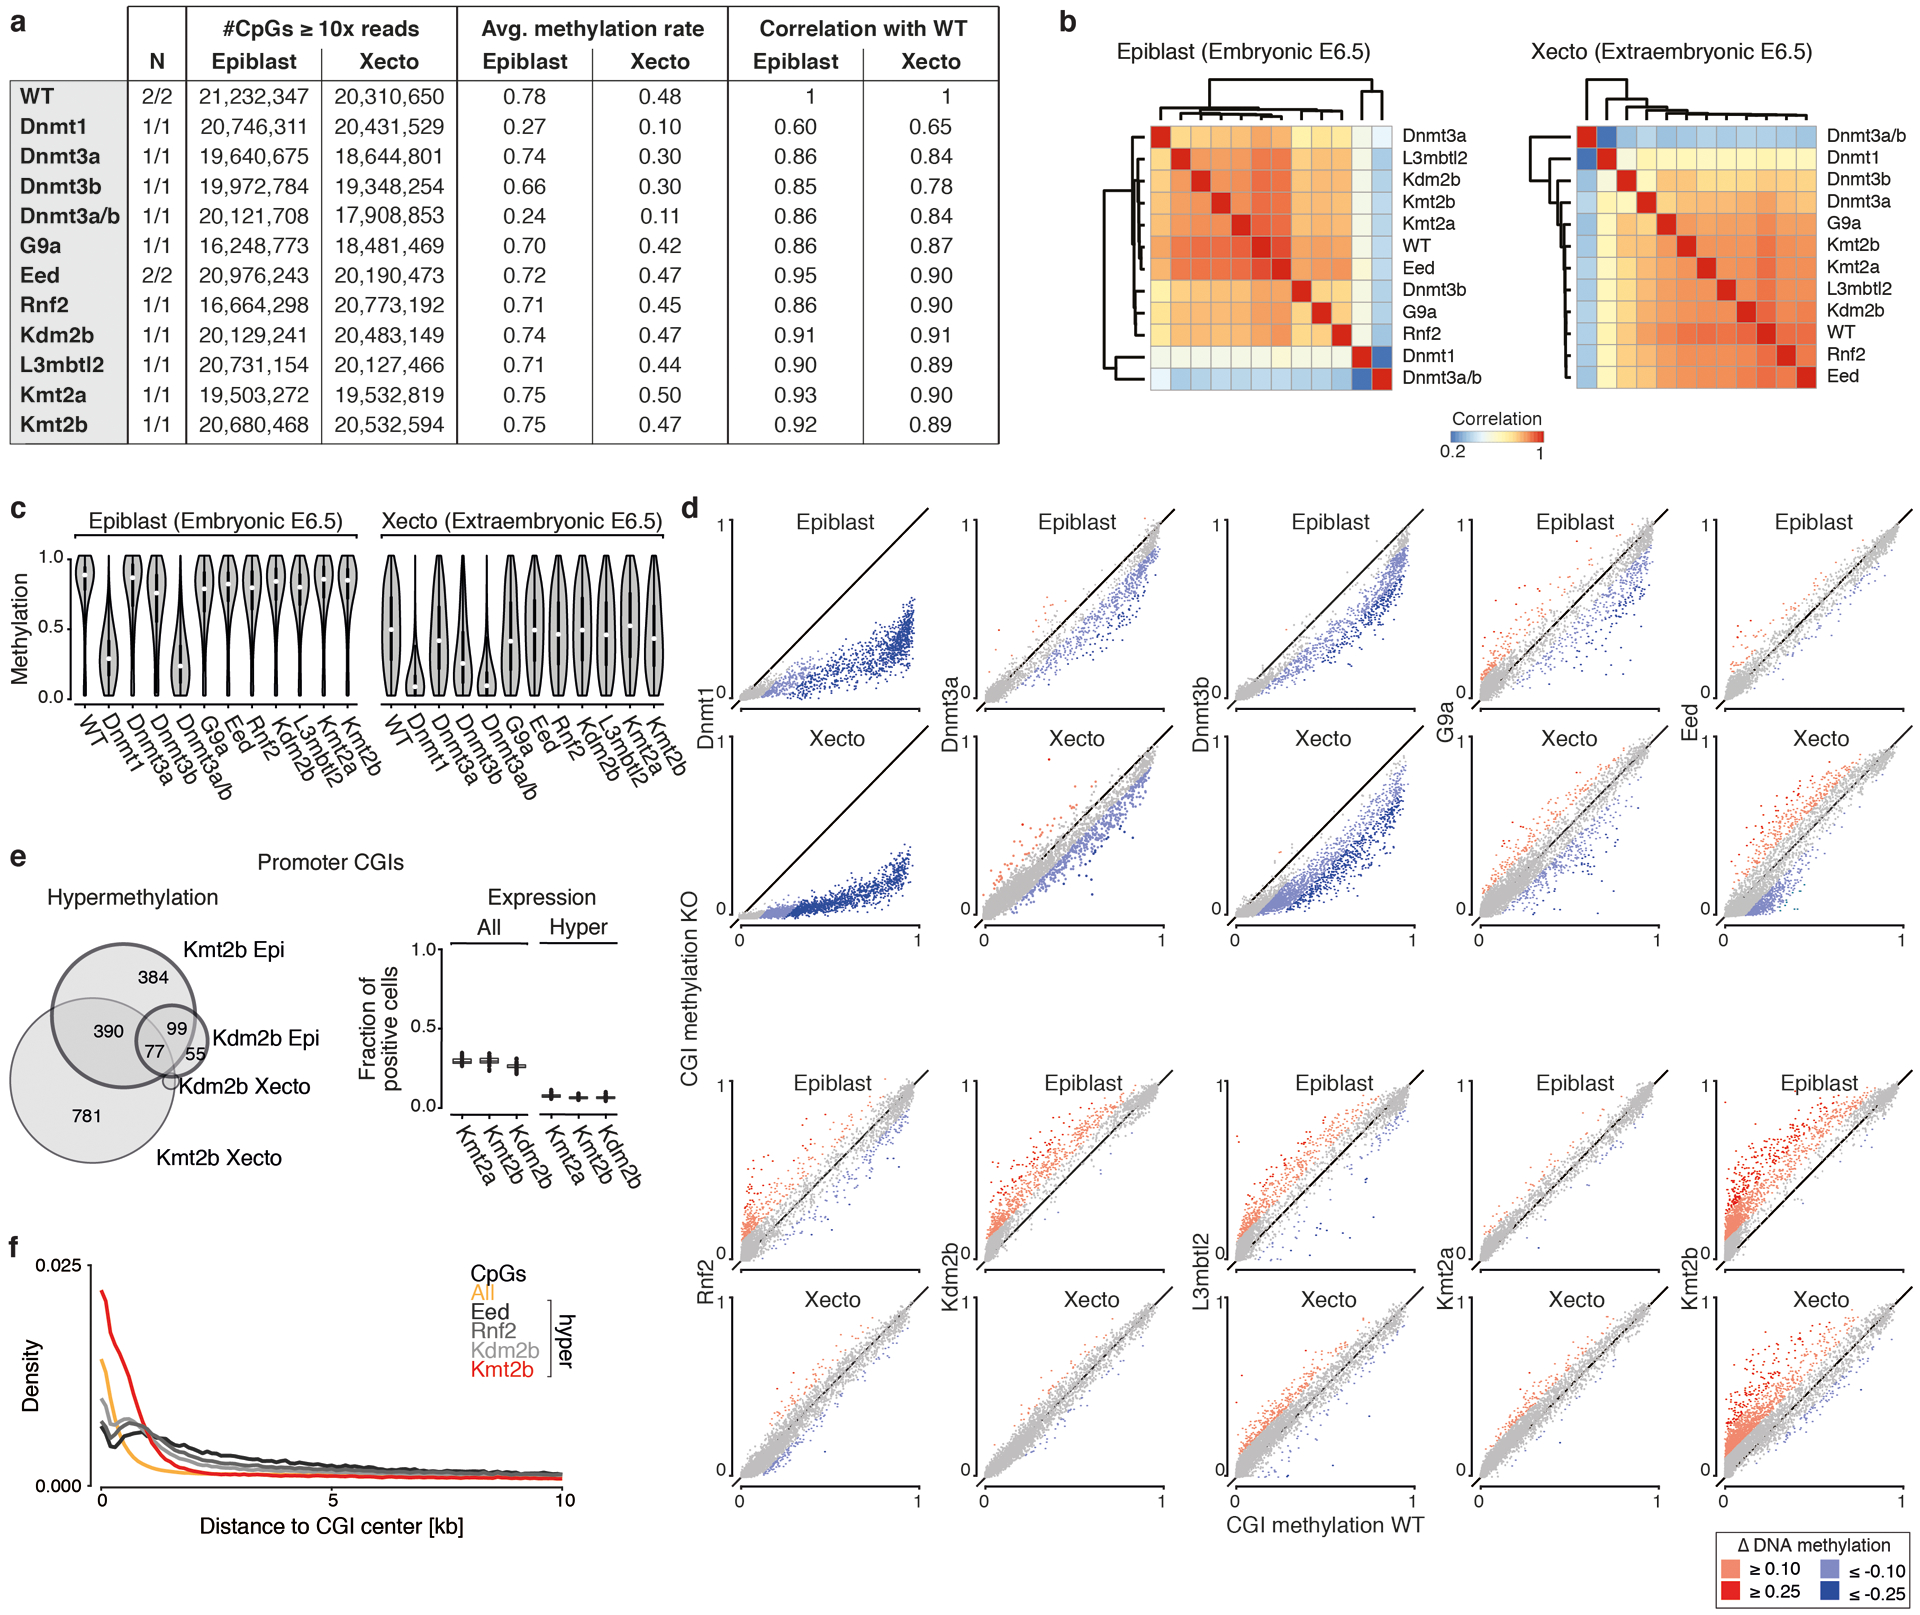
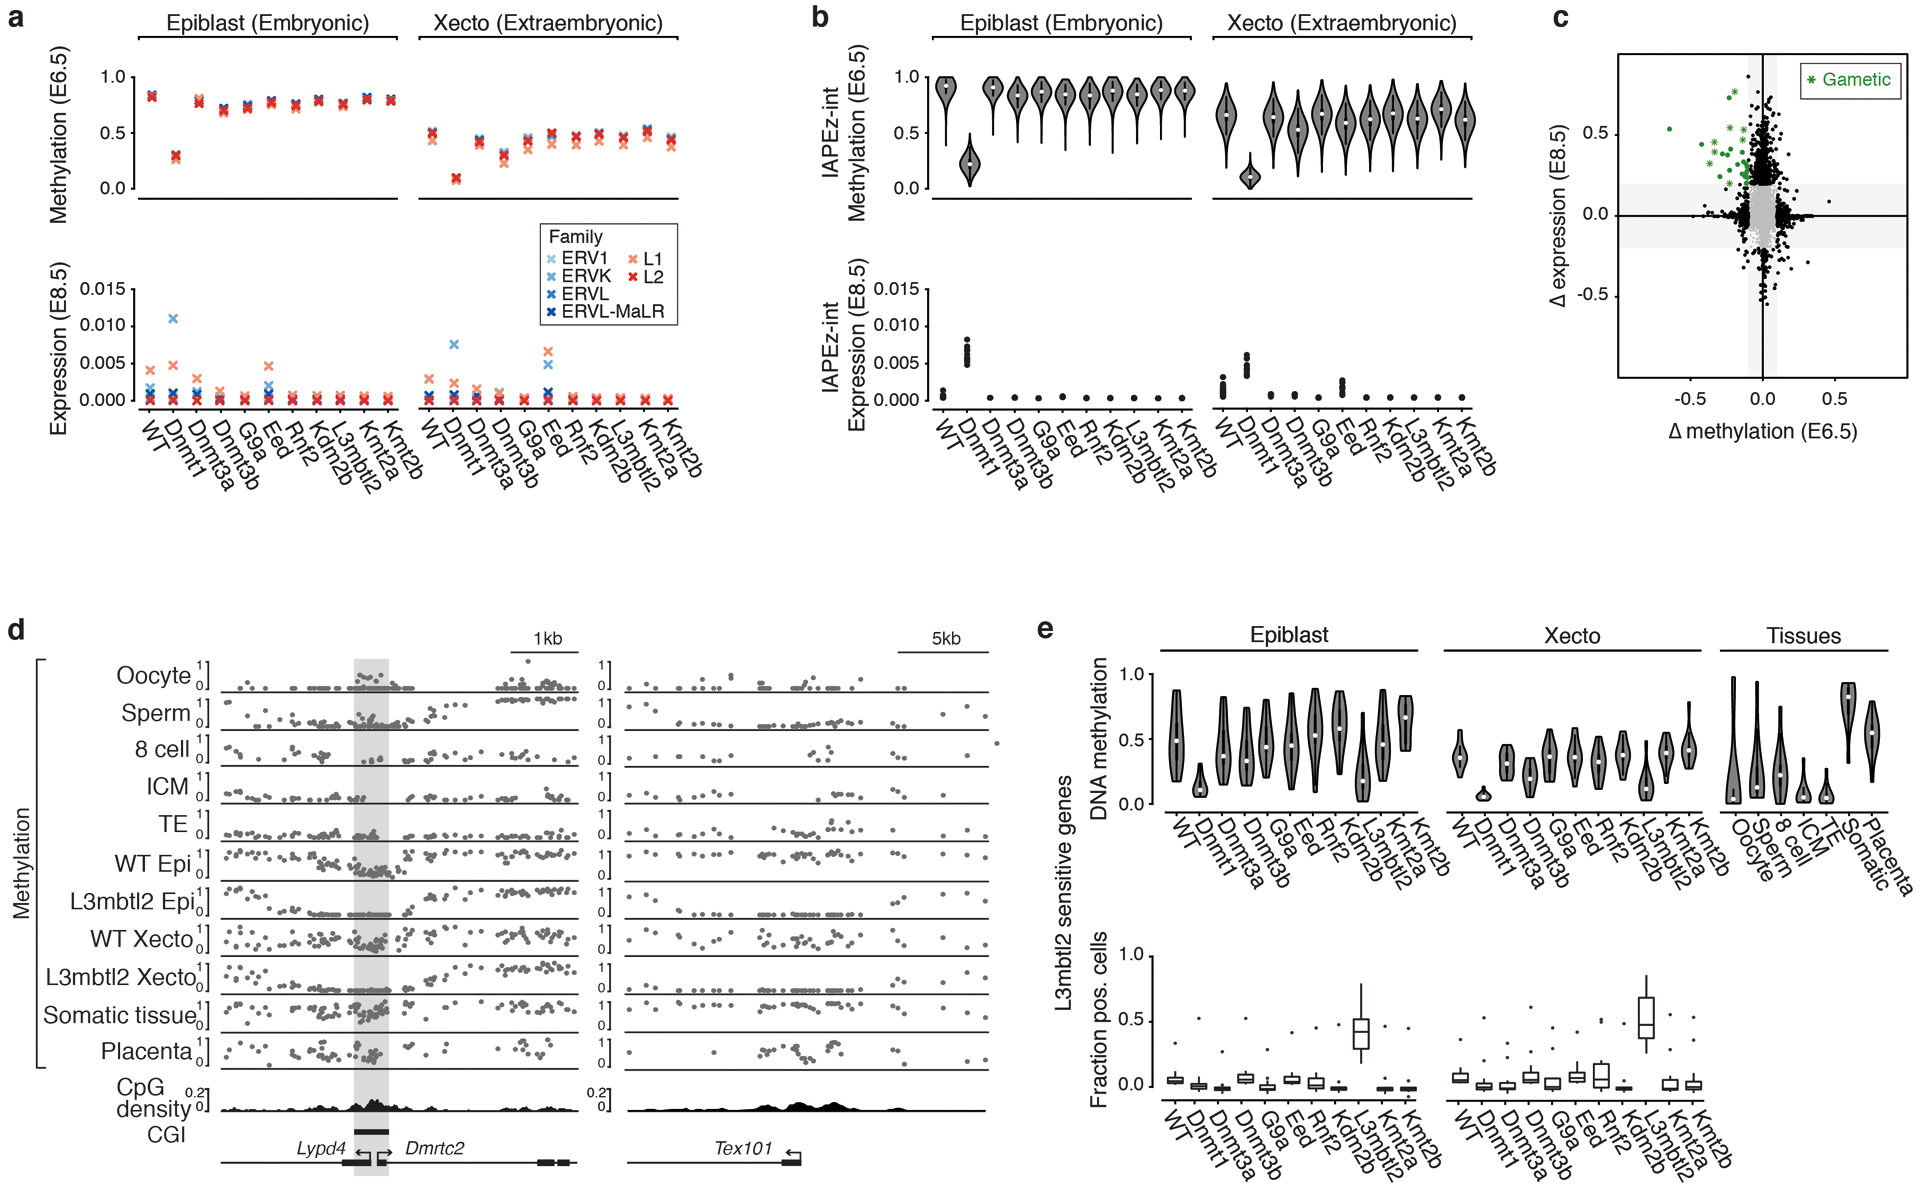
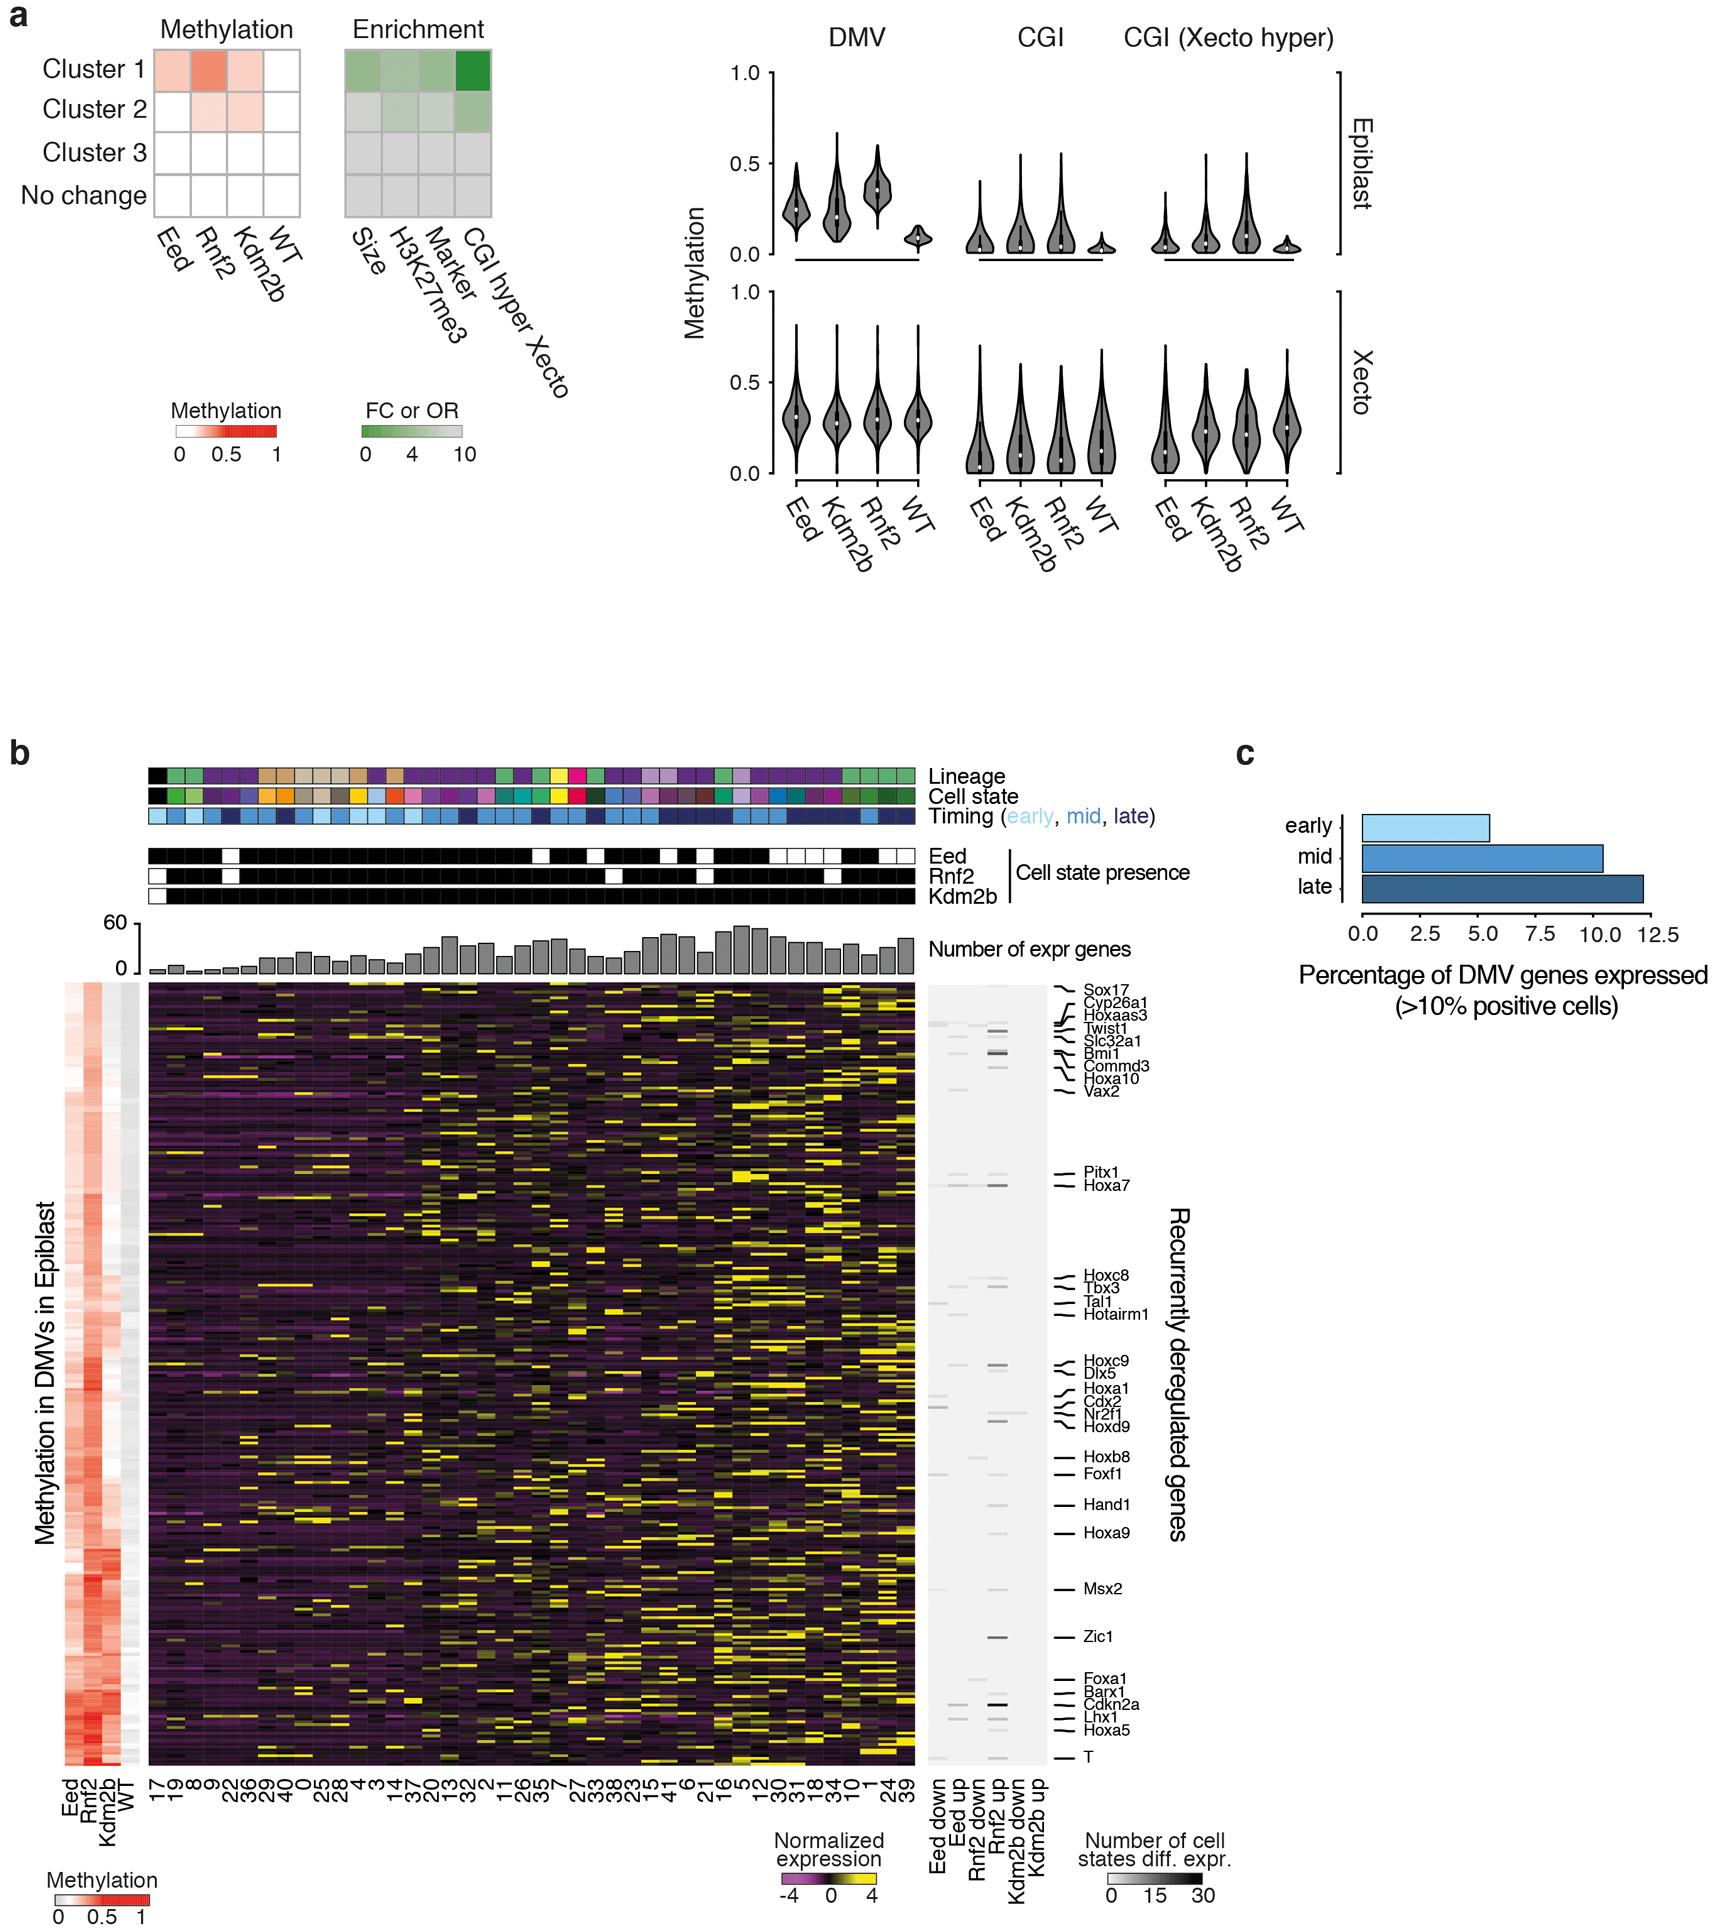
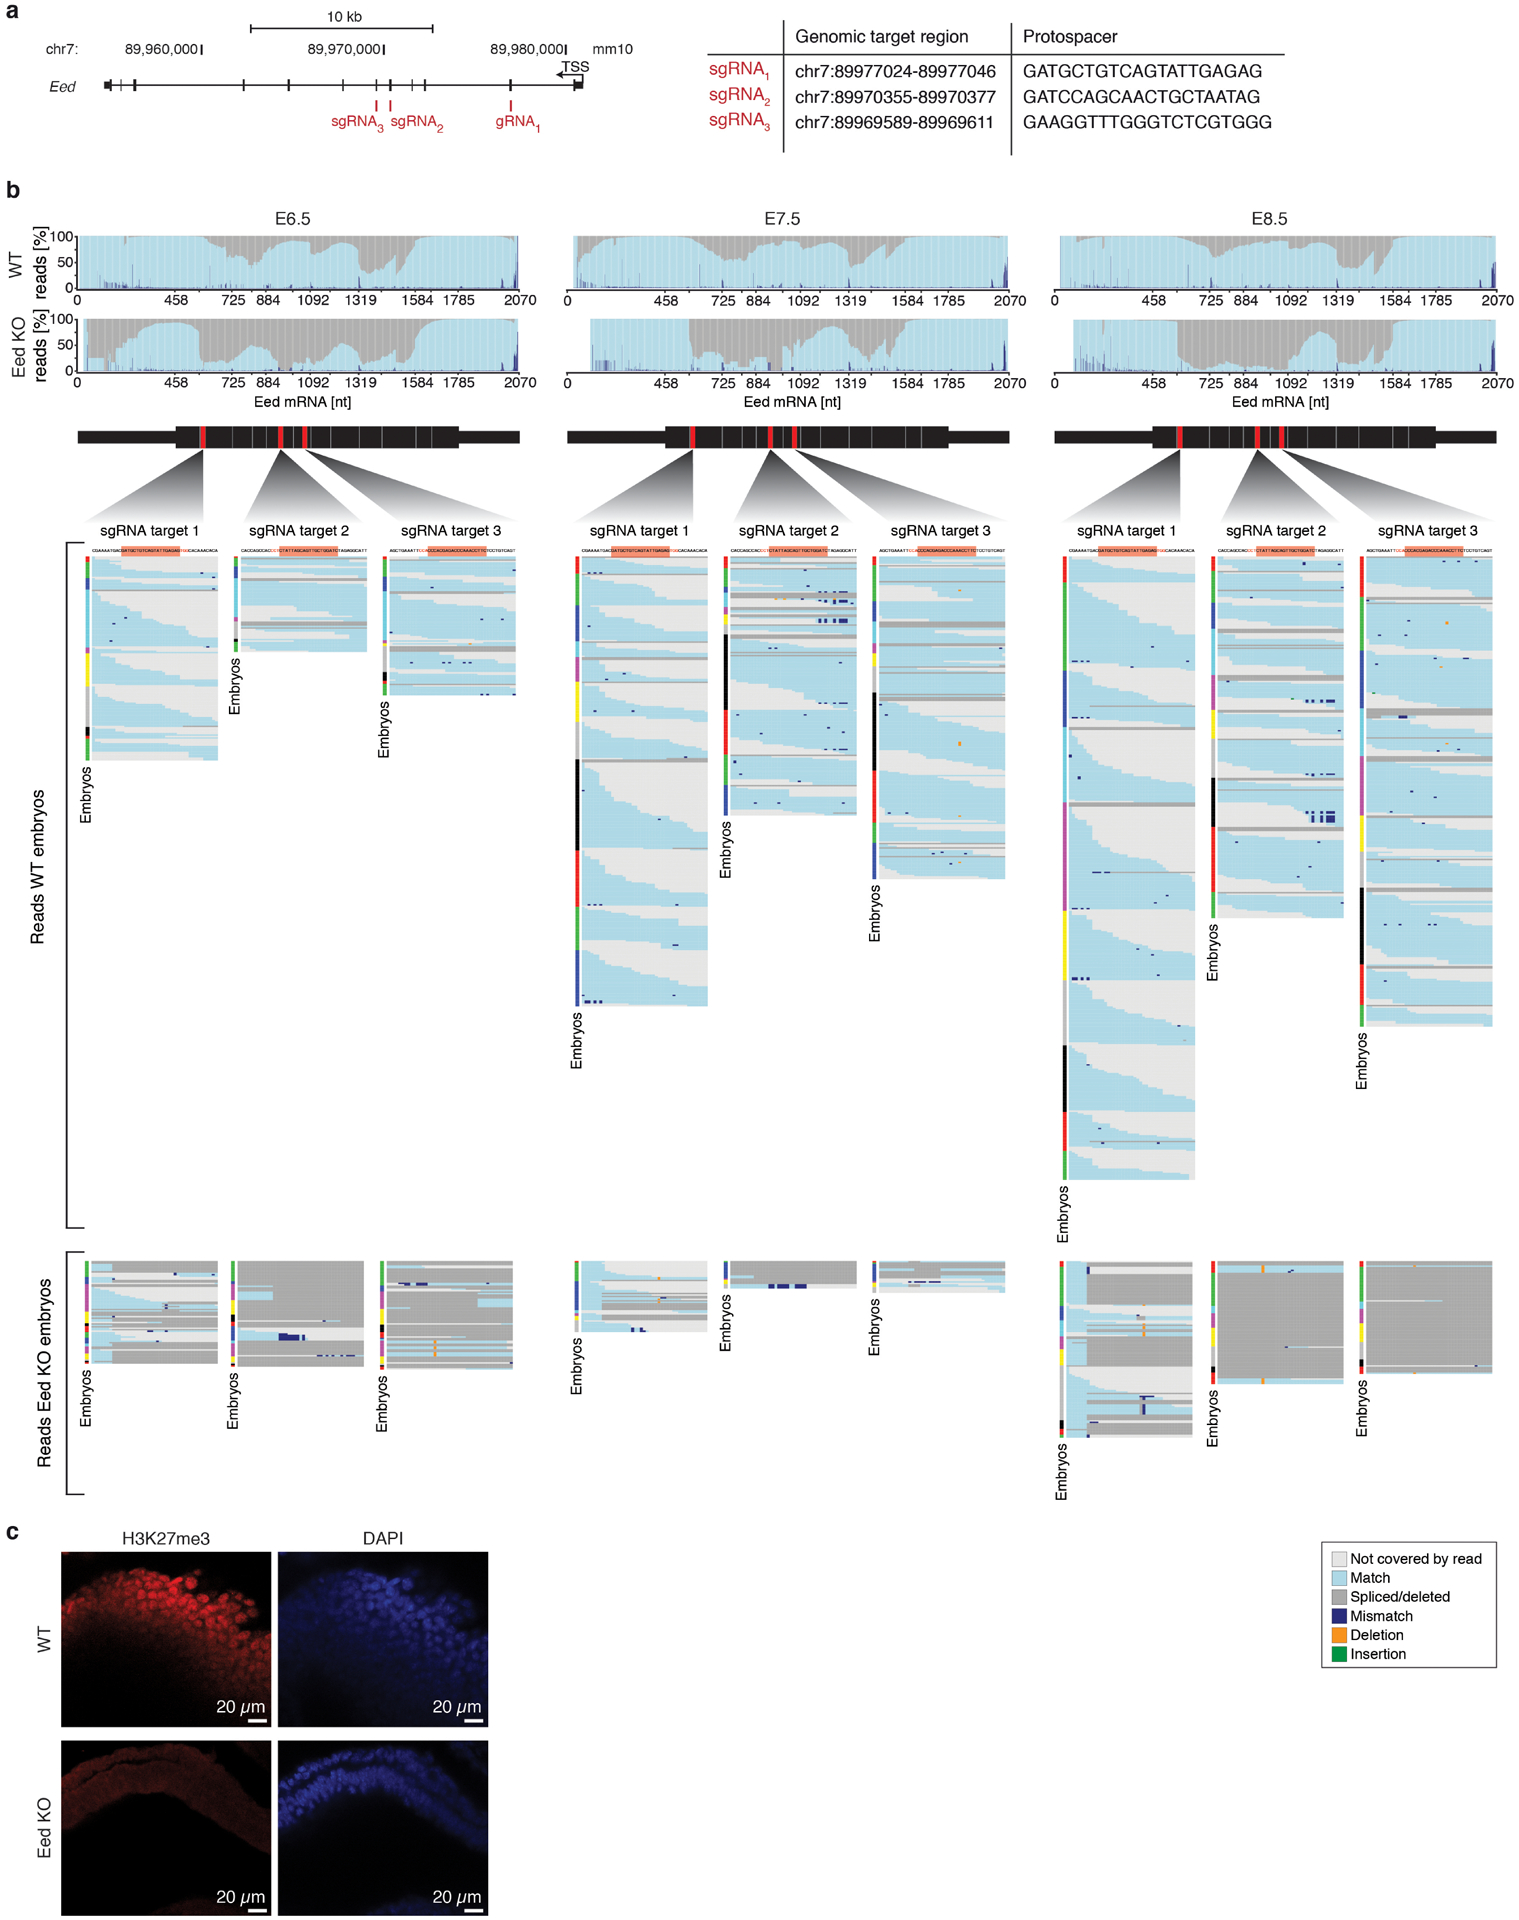
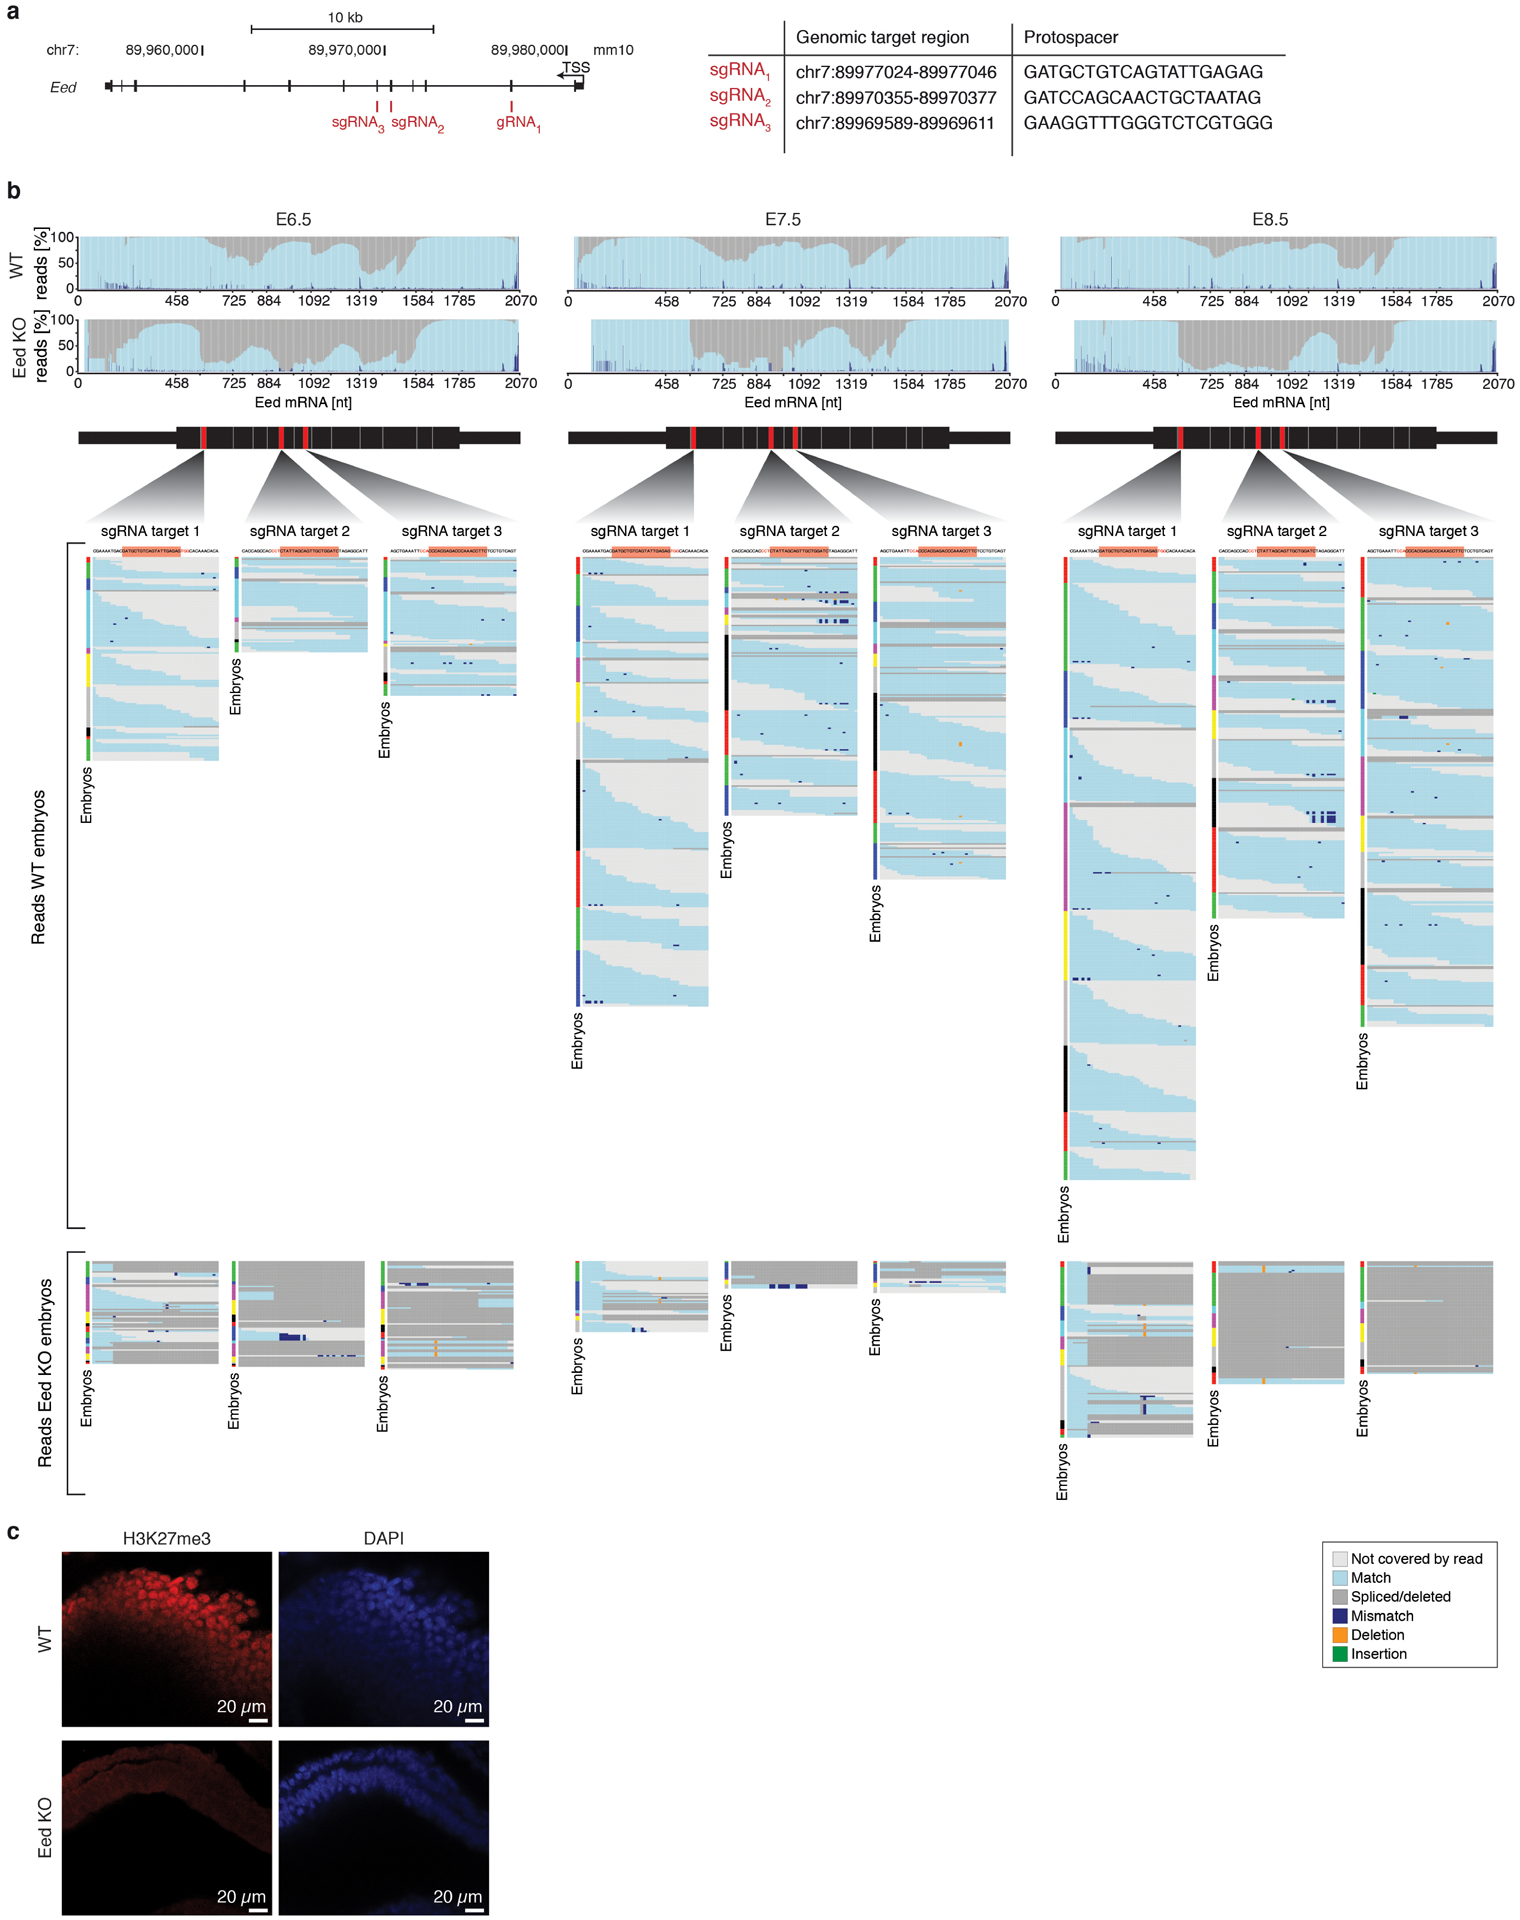
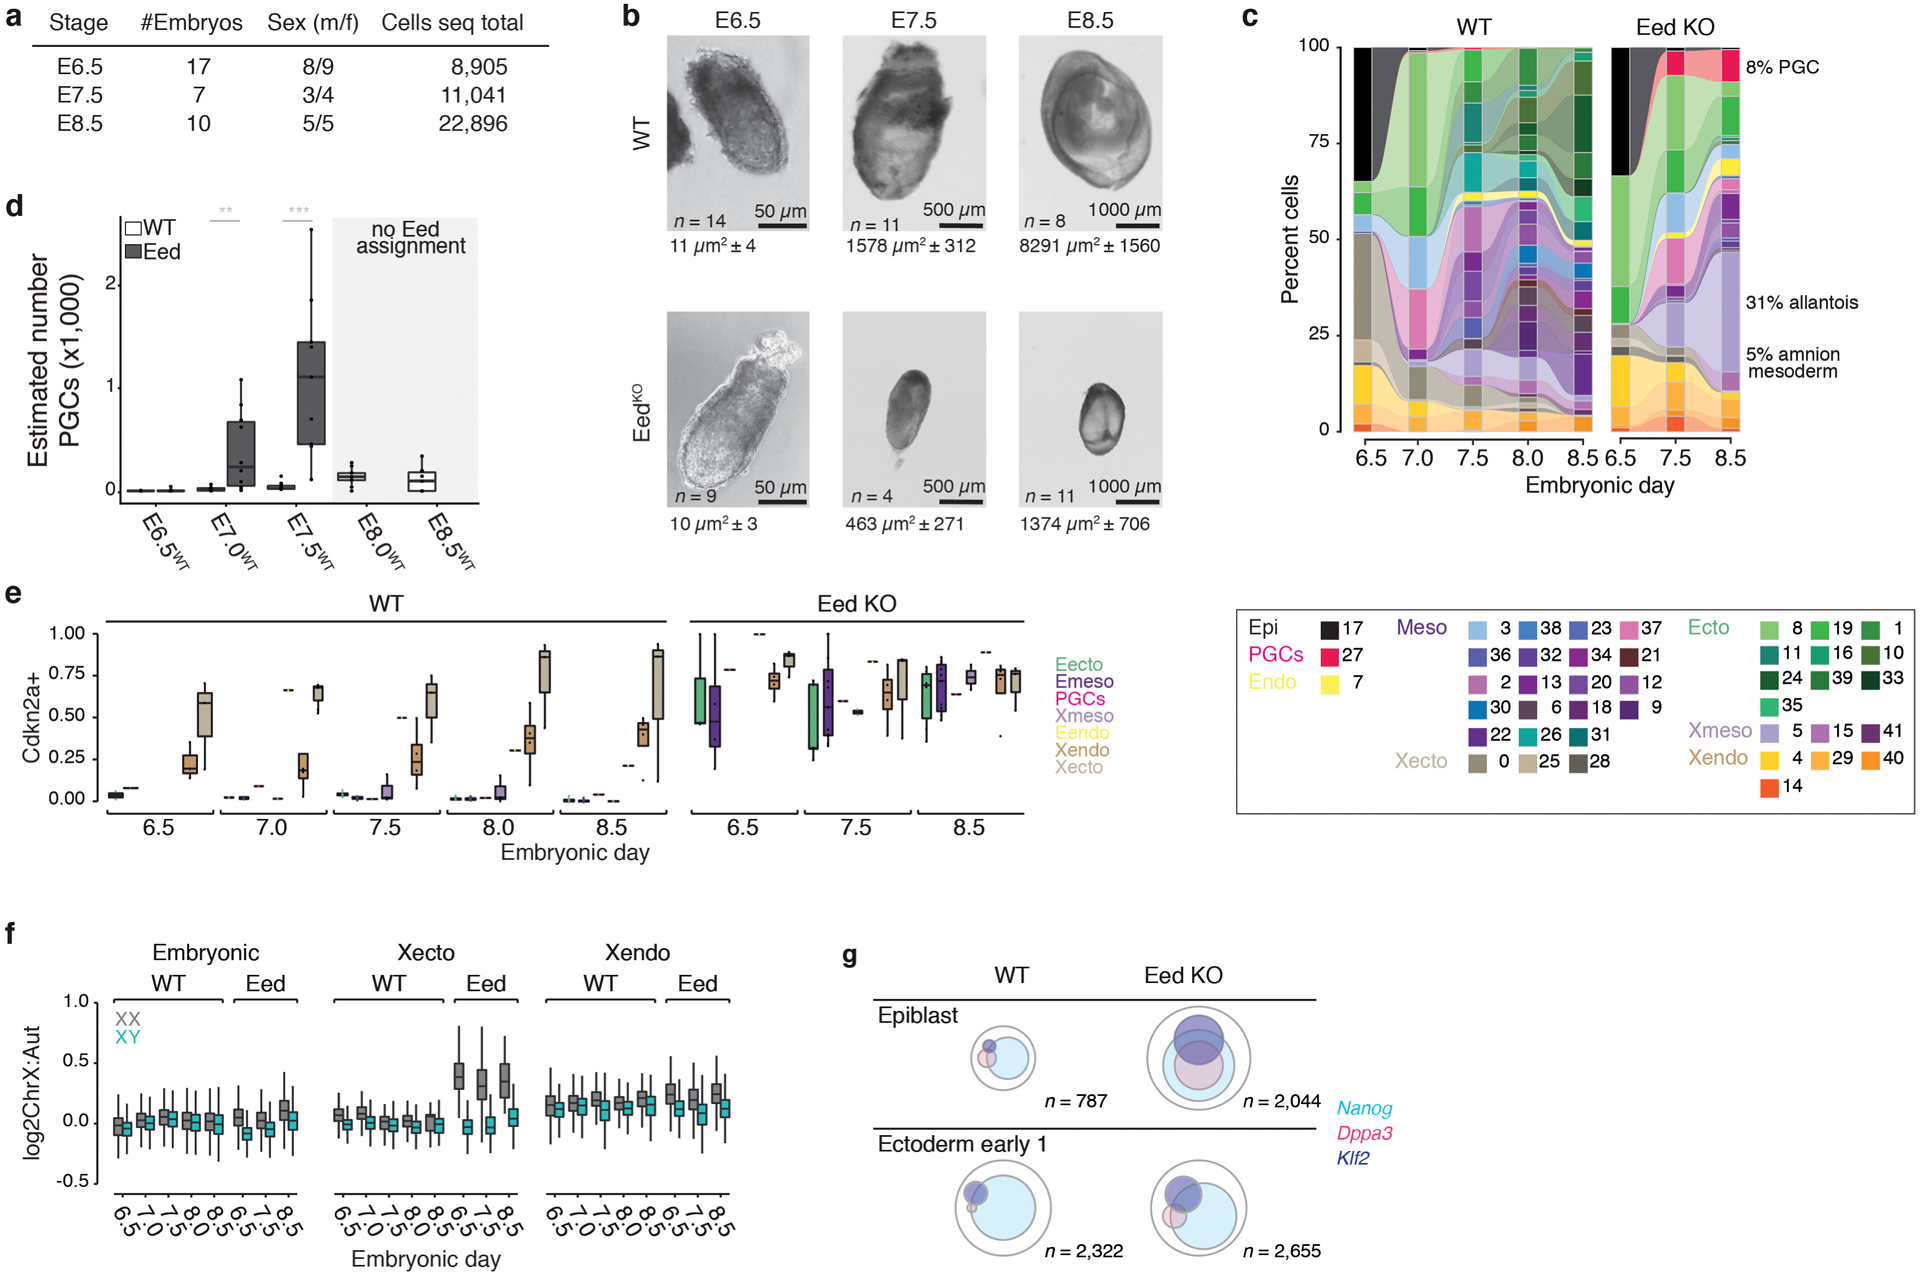
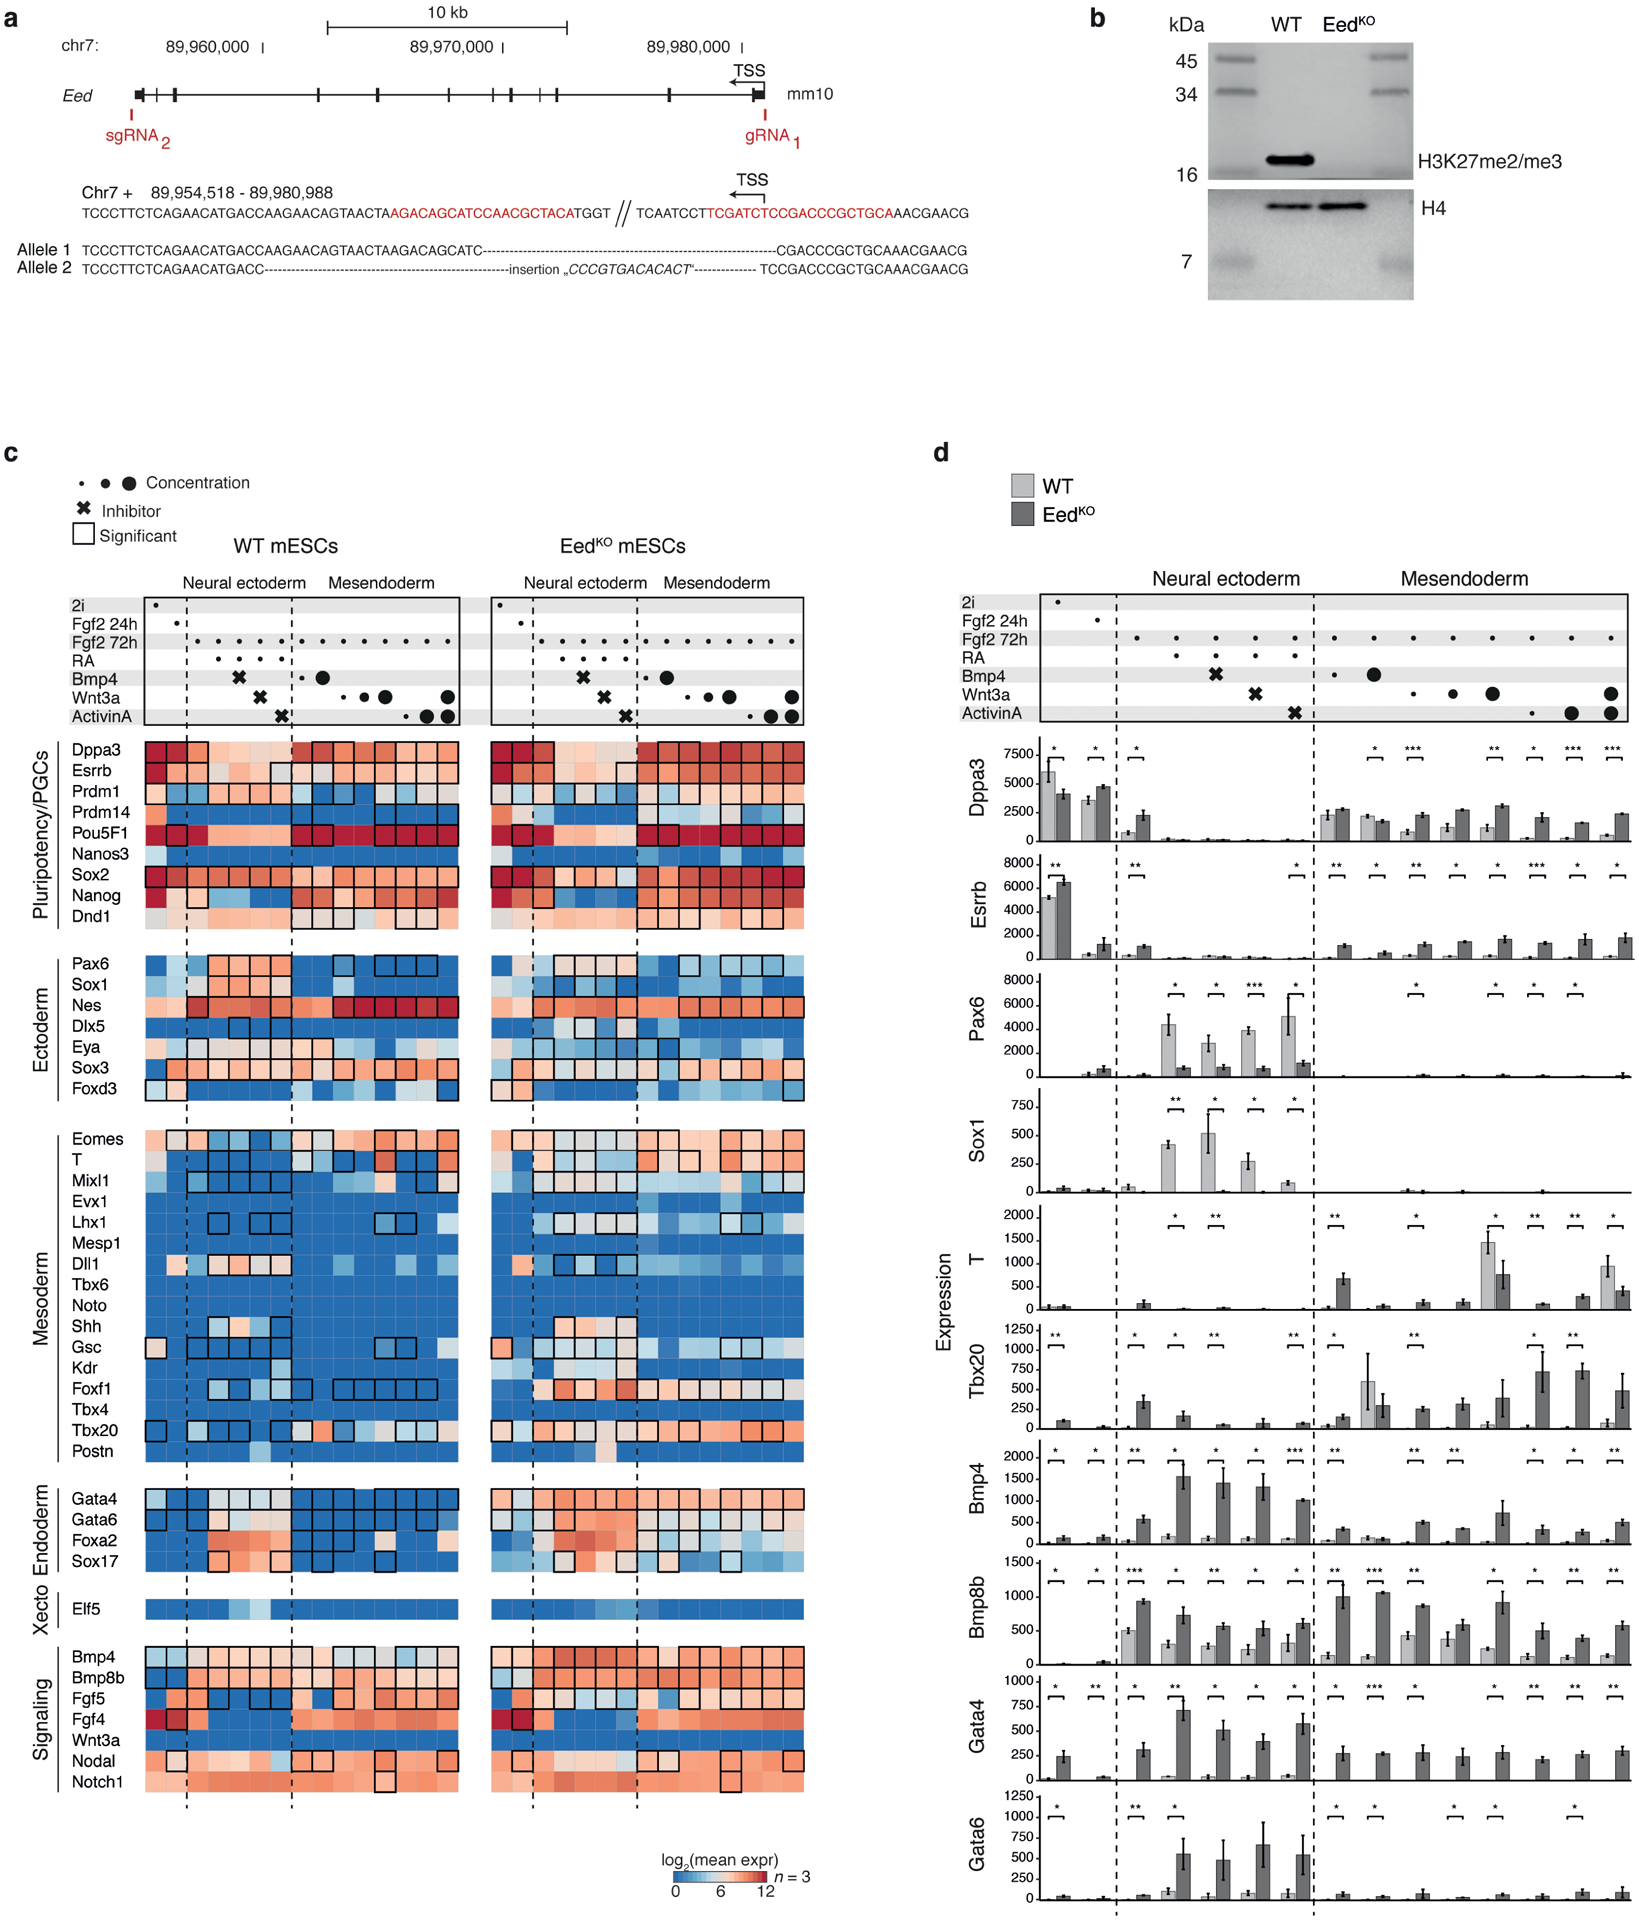
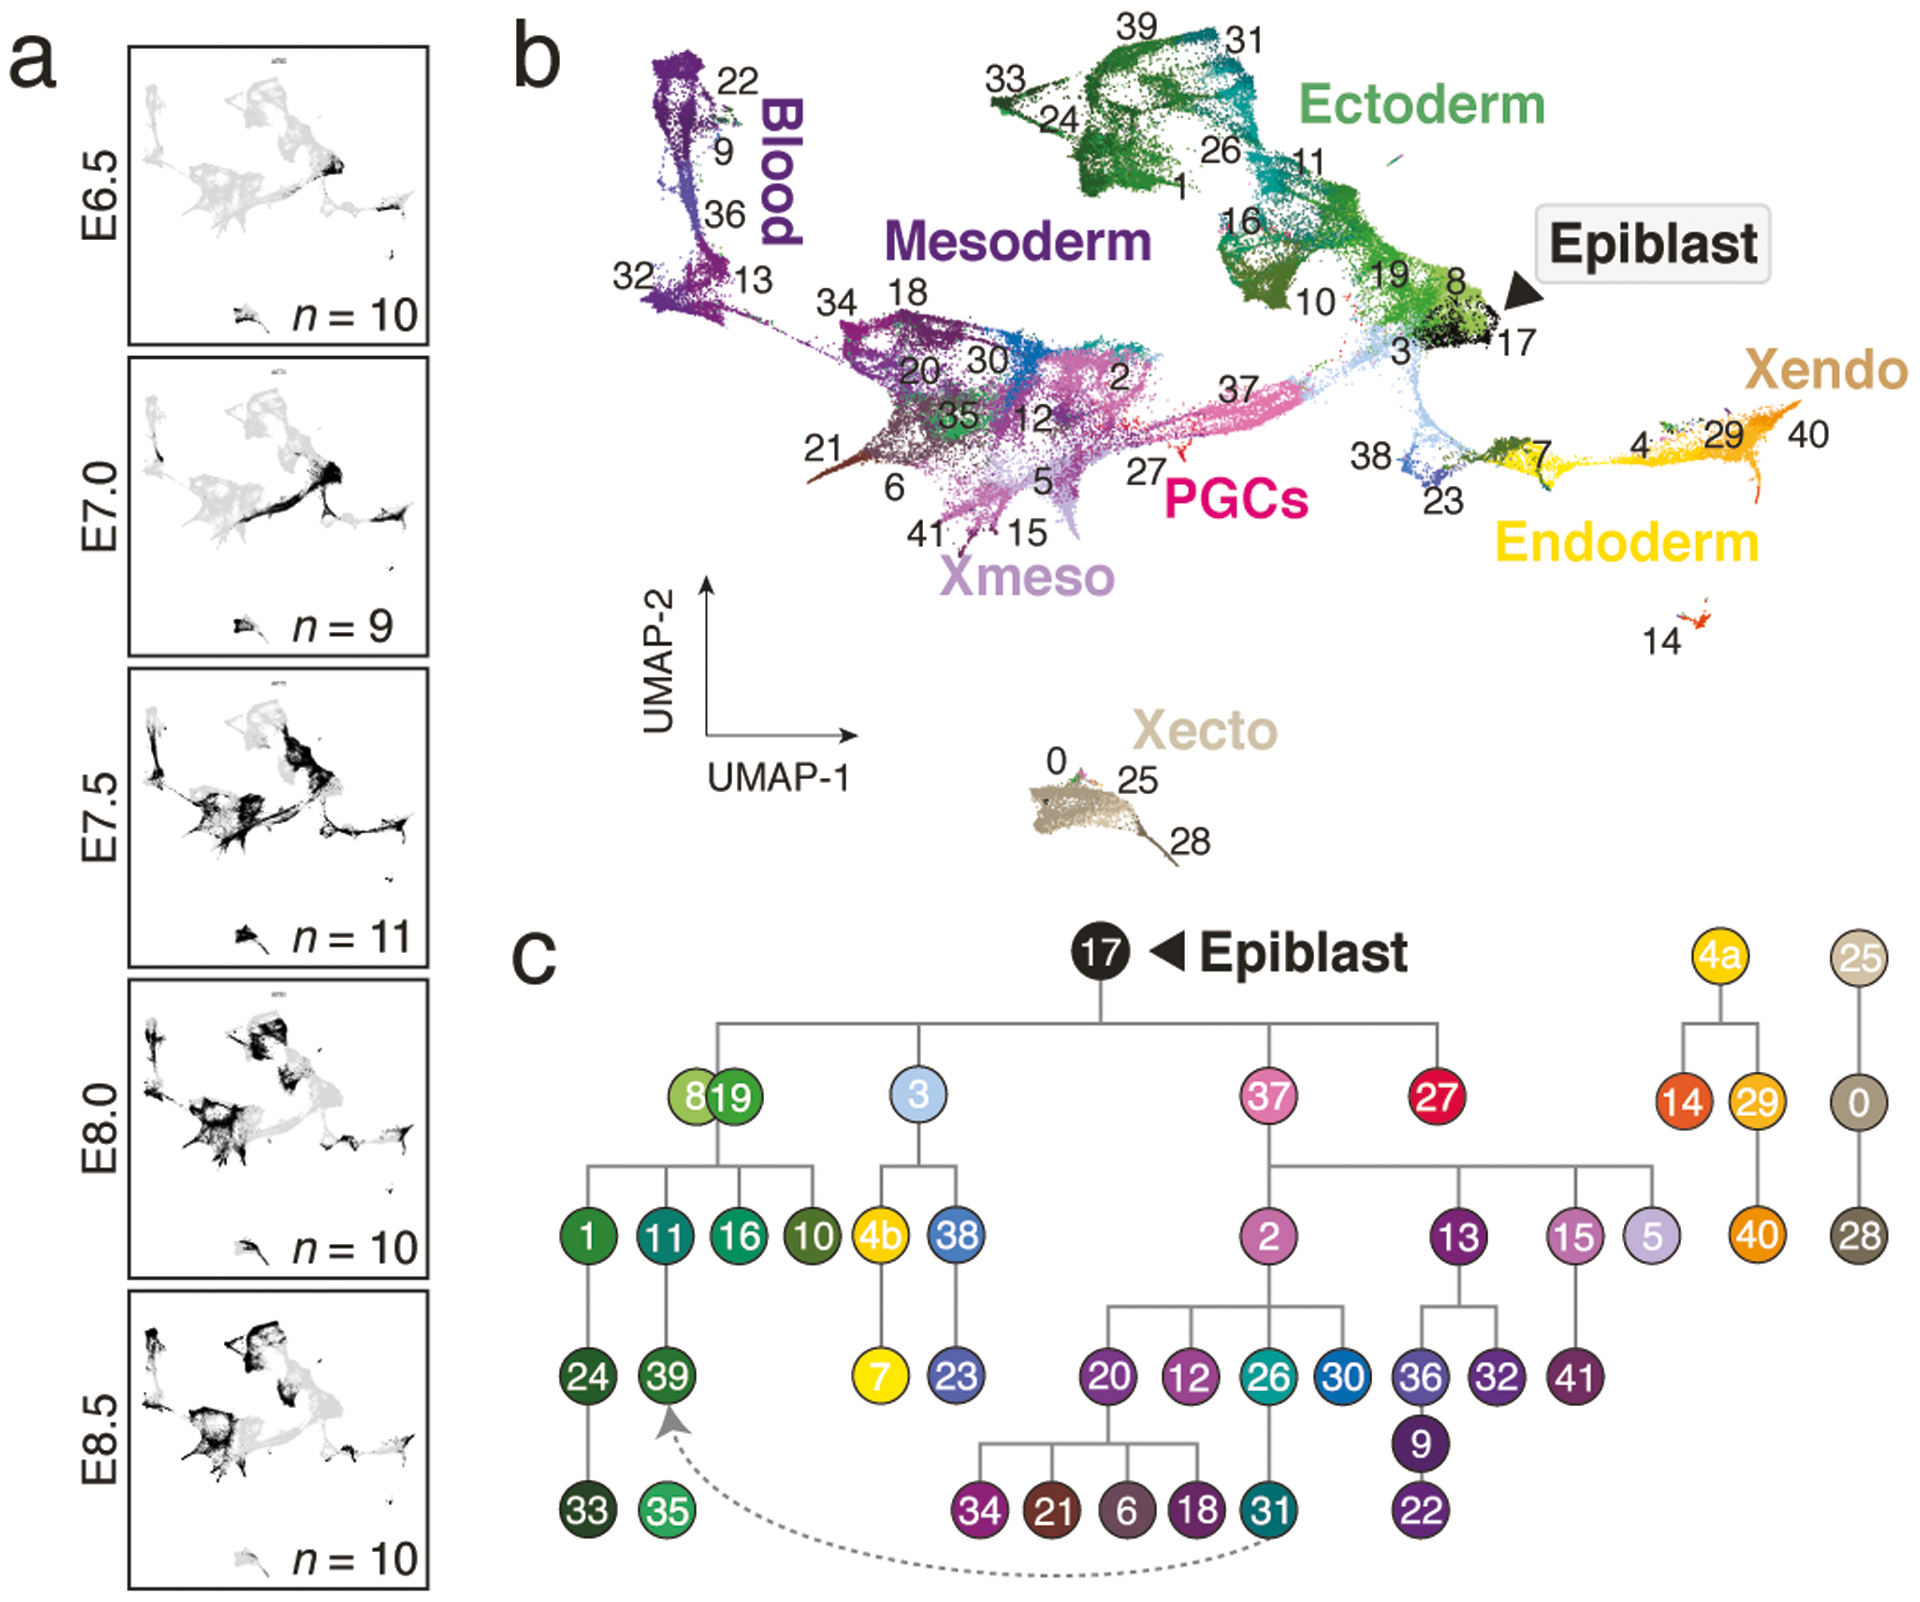
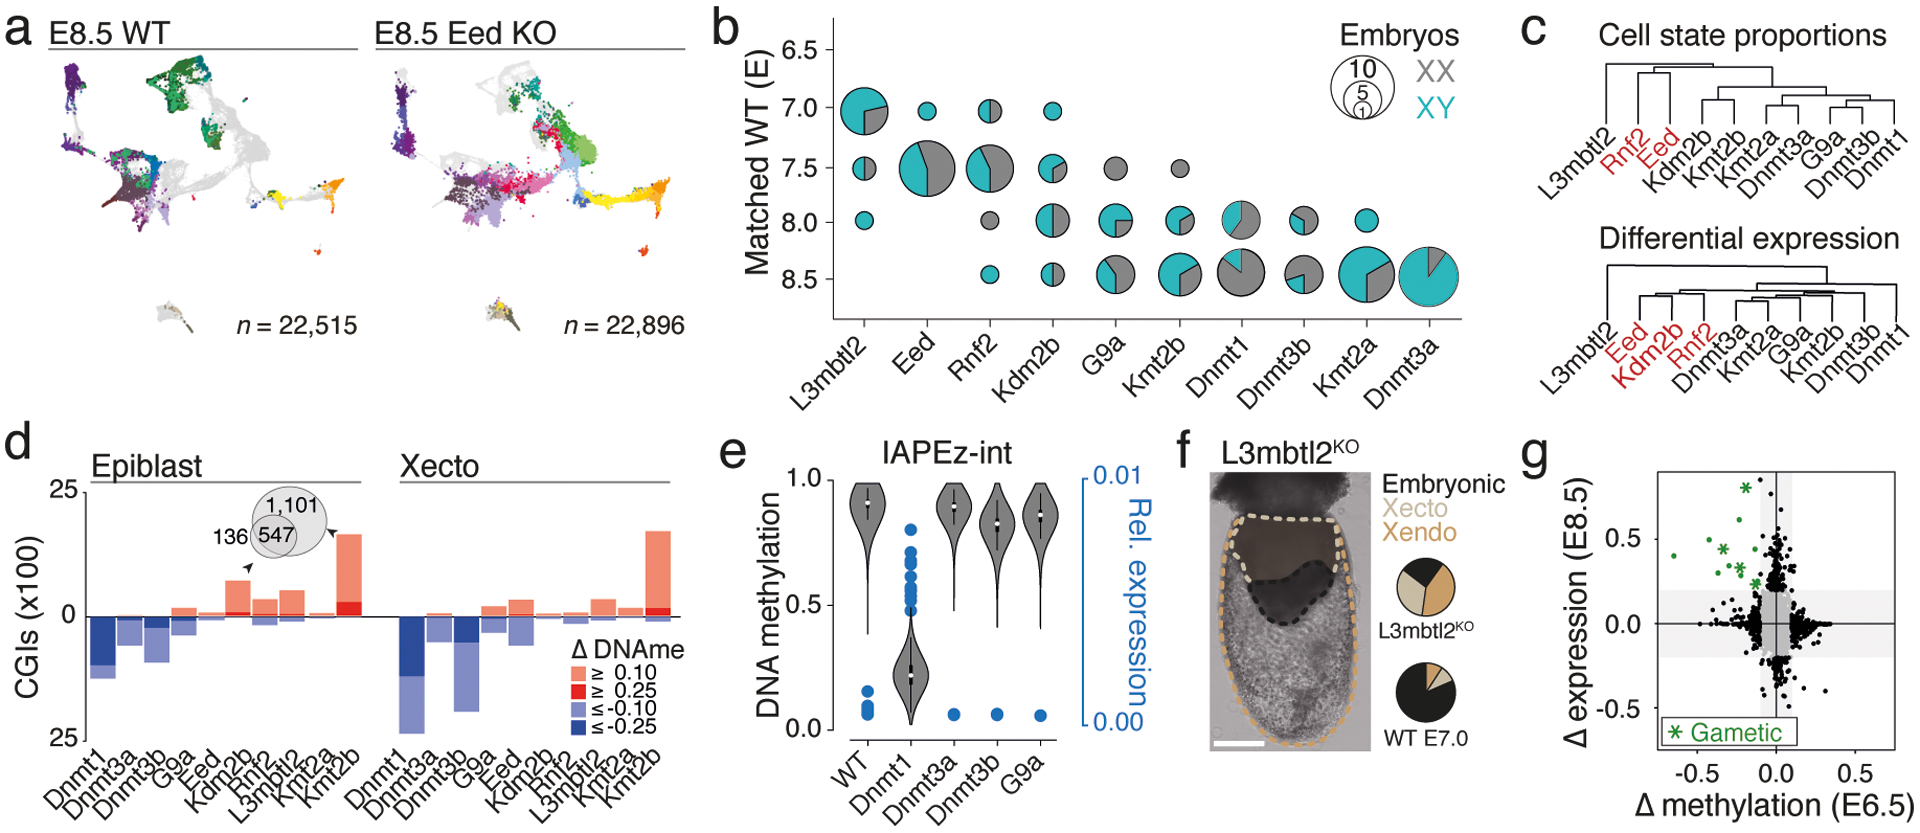
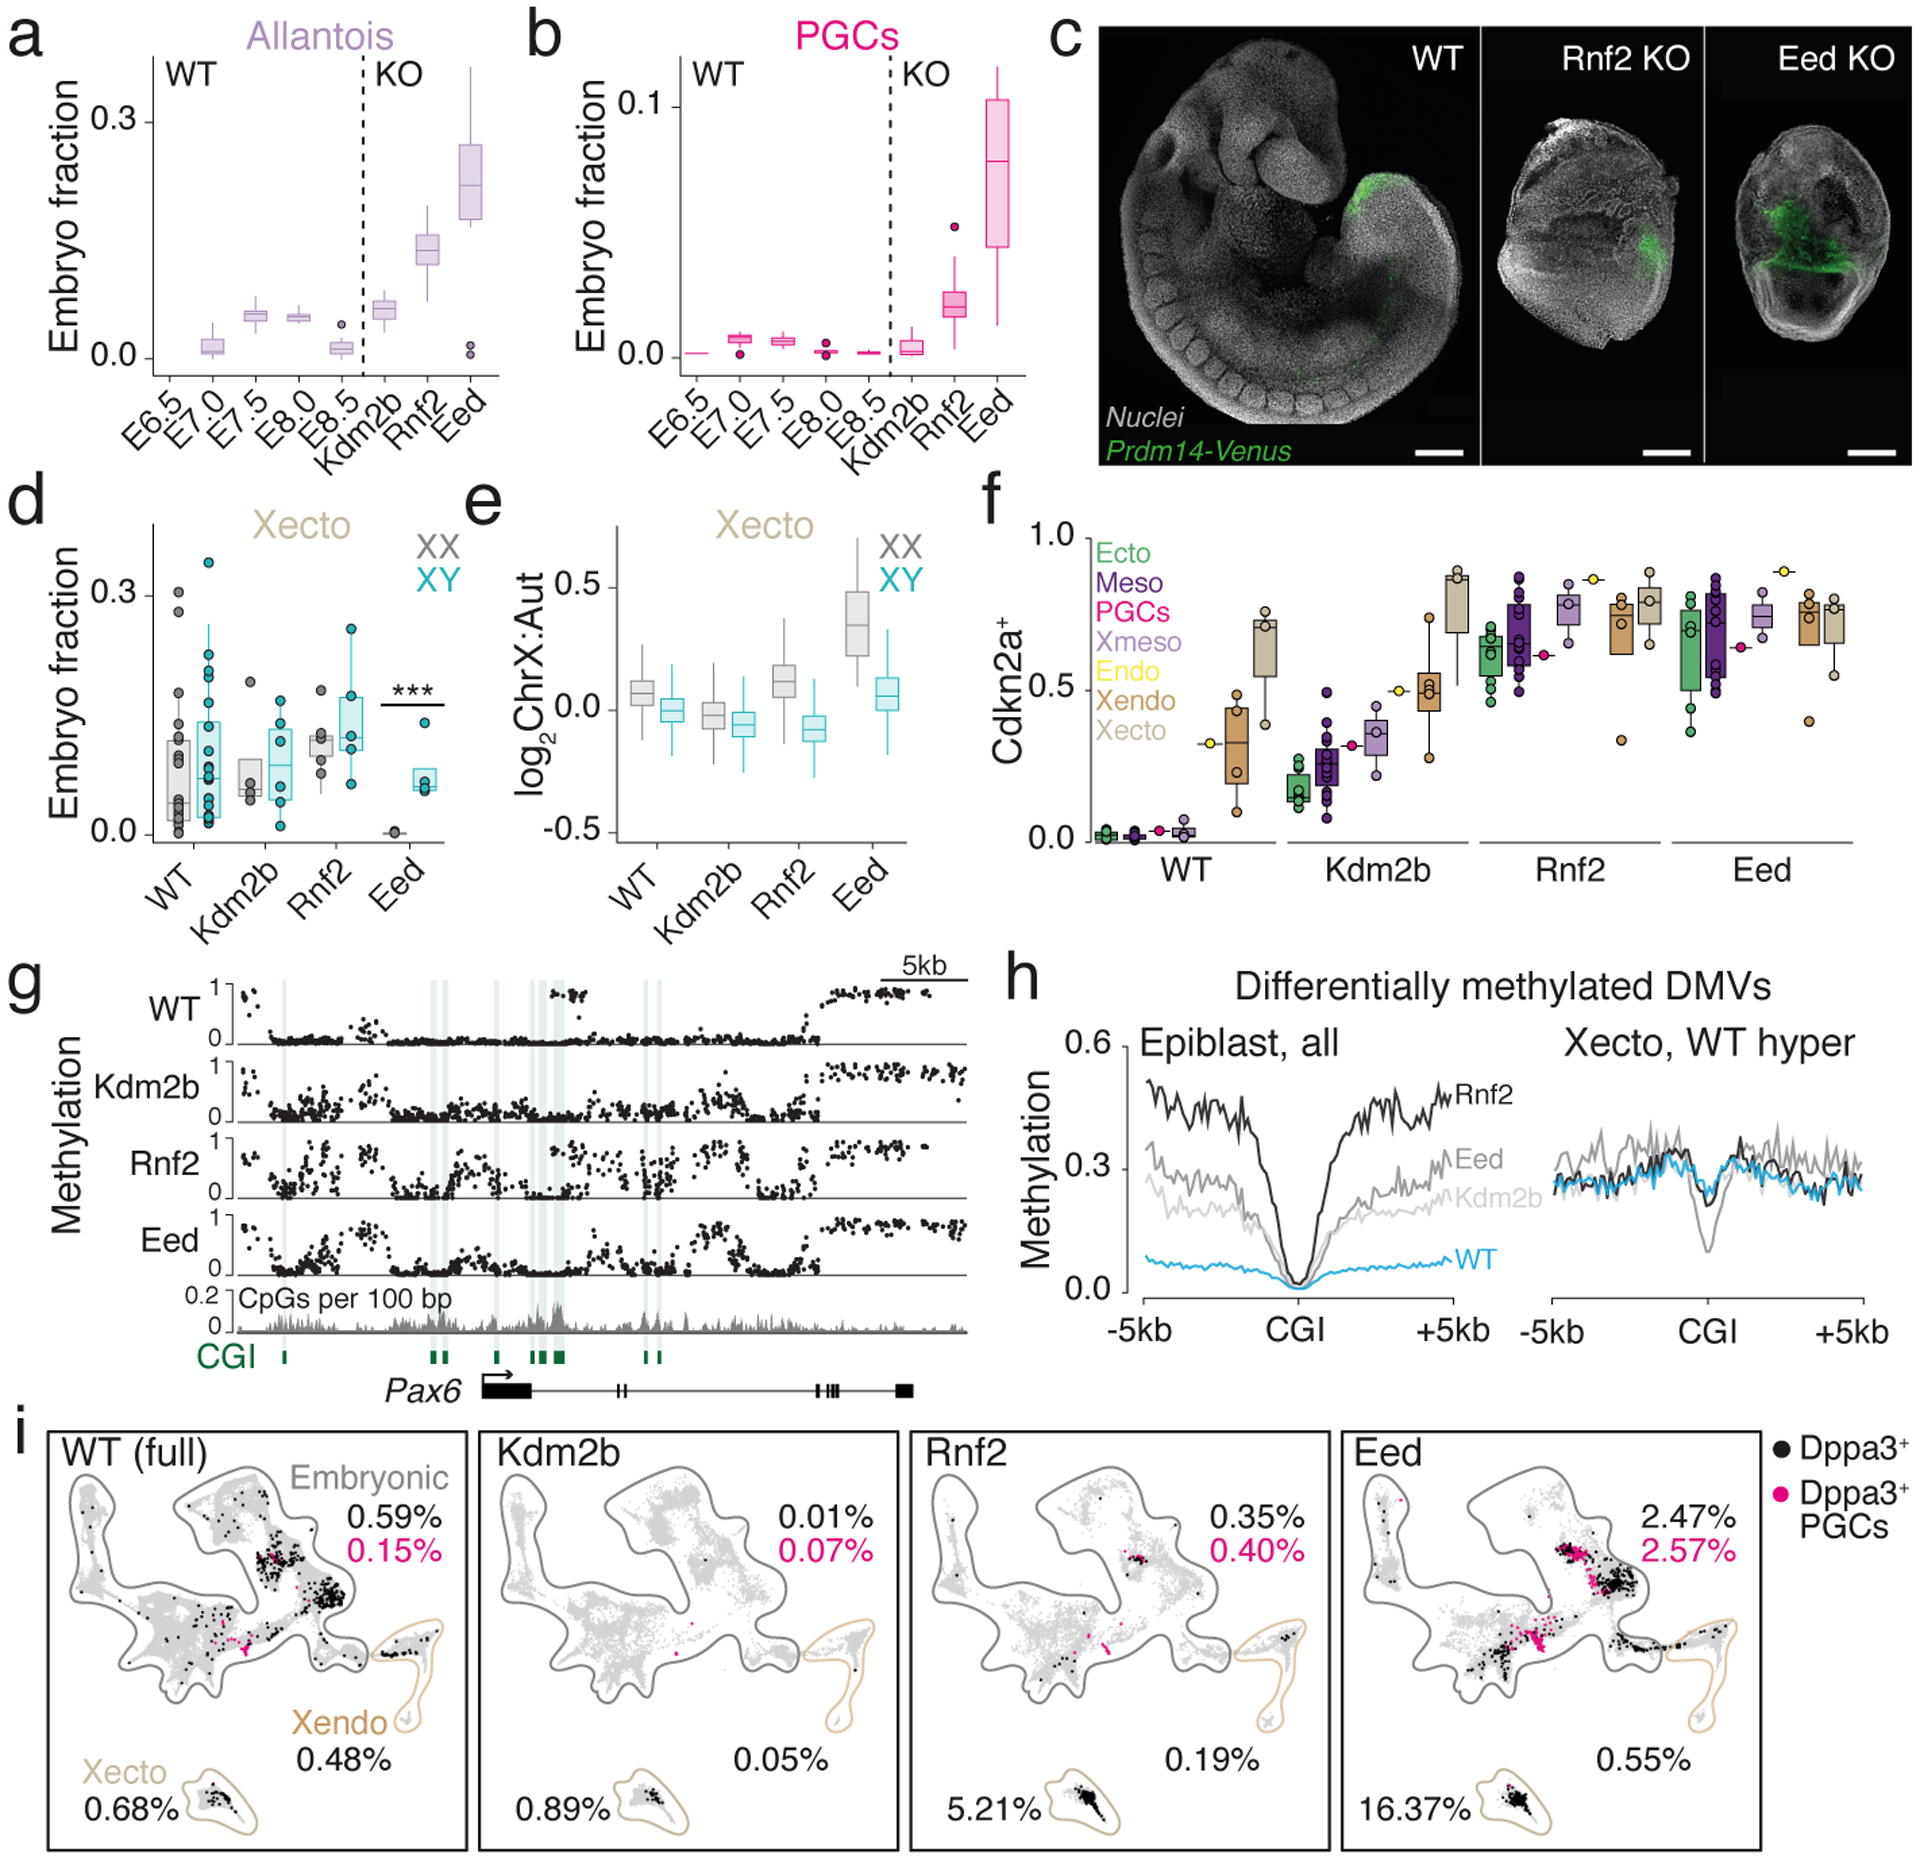
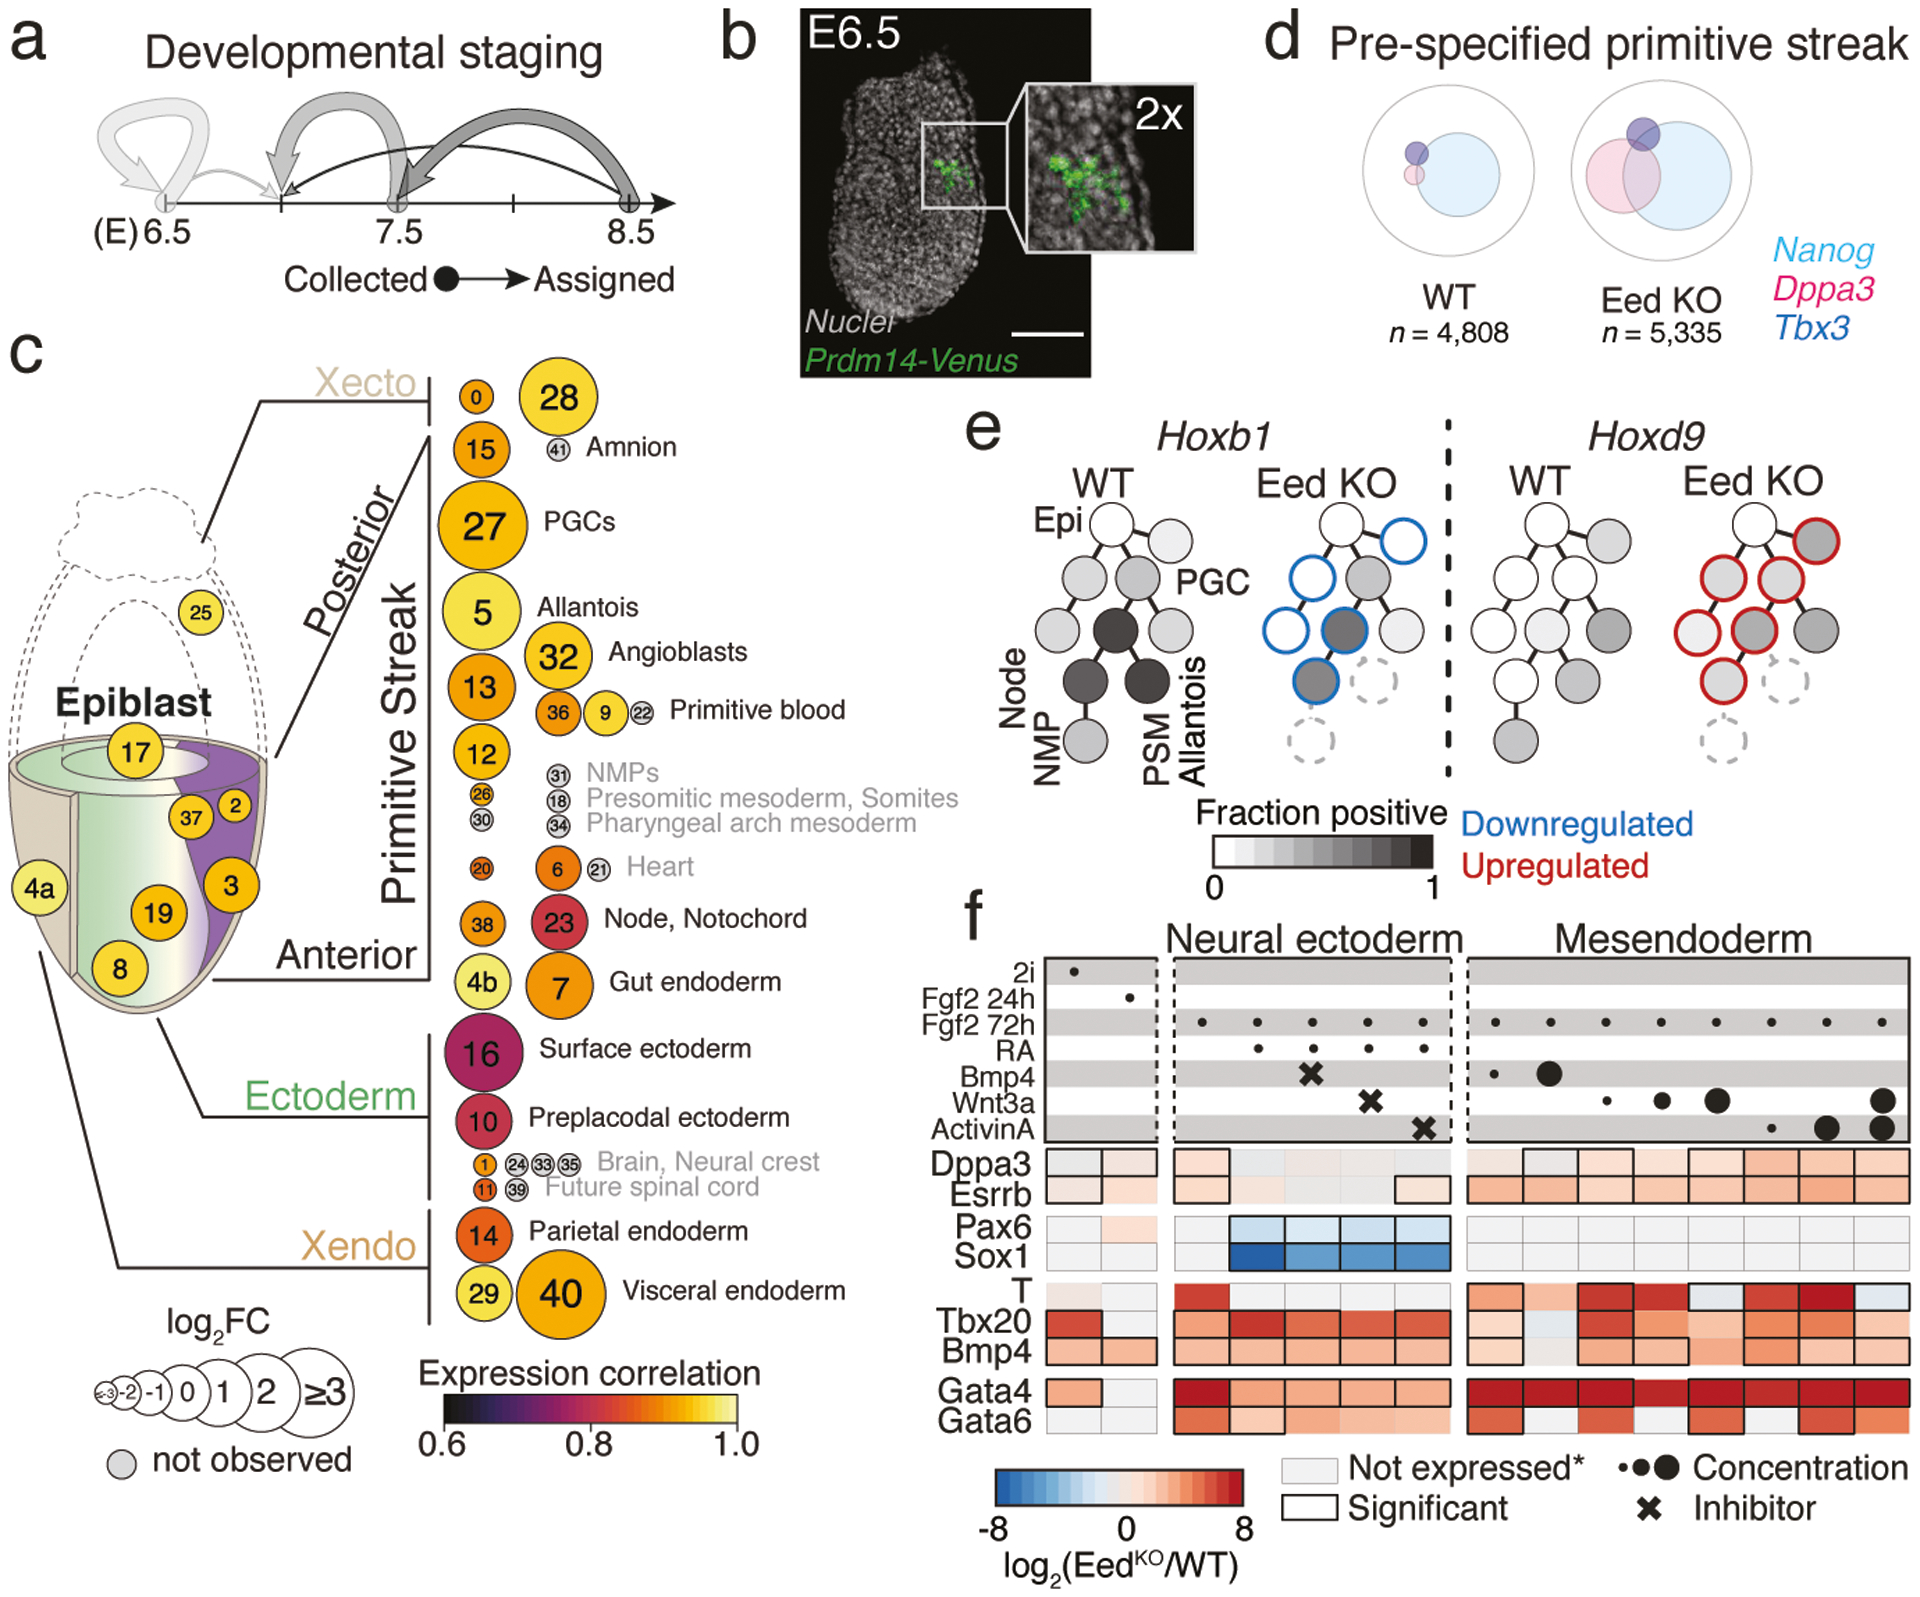
During ontogeny, proliferating cells become restricted in their fate through the combined action of cell-type-specific transcription factors and ubiquitous epigenetic machinery, which recognizes universally available histone residues or nucleotides in a context-dependent manner1,2. The molecular functions of these regulators are generally well understood, but assigning direct developmental roles to them is hampered by complex mutant phenotypes that often emerge after gastrulation3,4. Single-cell RNA sequencing and analytical approaches have explored this highly conserved, dynamic period across numerous model organisms5-8, including mouse9-18. Here we advance these strategies using a combined zygotic perturbation and single-cell RNA-sequencing platform in which many mutant mouse embryos can be assayed simultaneously, recovering robust morphological and transcriptional information across a panel of ten essential regulators. Deeper analysis of central Polycomb repressive complex (PRC) 1 and 2 components indicates substantial cooperativity, but distinguishes a dominant role for PRC2 in restricting the germline. Moreover, PRC mutant phenotypes emerge after gross epigenetic and transcriptional changes within the initial conceptus prior to gastrulation. Our experimental framework may eventually lead to a fully quantitative view of how cellular diversity emerges using an identical genetic template and from a single totipotent cell.


Conflict of interest statement

Competing interests

The authors declare no competing interests.

Figures

Extended Data Figure 1.
Extended Data Figure 1.. SNP-based genotyping and assignment of single cells into 42 discrete cell states
a. Single nucleotide polymorphism (SNP) based cell-to-embryo assignment strategy. Embryos were generated by intracytoplasmic sperm injection (ICSI) using sperm from hybrid males (C57BL6/J × CAST/EiJ) to confer a randomly inherited CAST/EiJ haplotype. Siblings (individually colored embryos) are pooled prior to single-cell RNA sequencing (scRNA-seq) and computationally deconvoluted based on their embryo-specific SNP profiles. Briefly, the ratios of CAST-specific SNPs (orange) are scored per chromosome to cluster cells into distinct embryos. We use B6D2F1 (C57BL6/J × DBA) oocytes, whose genotypes differ by only ~4.5M SNPs compared to ~17.7M for CAST/EiJ. b. SNP-based deconvolution of seven pooled E7.5 wild-type (WT) embryos. Left: Principal Component Analysis (PCA) projection of autosomal CAST SNP ratios for all sequenced cells with ≥1,000 covered SNPs. Cells are colored by cluster assignment, indicating individual genotypes (embryos). Center: Iterative sampling of 20% covered SNPs per cell flags cells with unstable embryo assignments. Flagged cells with lower than median SNP counts represent low quality cells, while those with higher counts collect between clusters and likely reflect doublets. Cells with unstable genotype assignments were excluded from further analysis. Right: PCA projection of all cells that were stably assigned to an embryo. c. Per embryo fraction of cells with Xist (grey) and three Y-linked gene transcripts (Erdr1, Ddx3y or Eif2s3y, blue) used for sex-typing. For cell numbers, see Supplementary Tables 1 and 2. d. Summary statistics of profiled WT embryos from E6.5–8.5 (n = 50 total). e. Left: Fraction of variable genes that are uniquely assigned to a single state when taking the top N-most differentially expressed genes per cluster. We selected the top 30 most unique genes per cluster (n = 712 genes) because it maximizes the information per cluster under the constraint that the number of marker genes be as similar across states as possible. Right: Ranked order distribution for the fraction of all variable or of the top 30 marker genes expressed in each of our 42 states. Our top 30 marker criterion reduces the range of variable genes that are used to assign single cells to each state. f. Single cell Euclidean distances to their closest (green) or second closest (grey) state. The distribution of differences between first and second closest cluster are all significant (P < 2×10⁻¹⁶, Wilcoxon test, two tailed, paired test). g. Per embryo barplots show percent of cells (y-axis) assigned to each cell state (n = 42 states, 50 embryos total). For absolute cell counts, see Supplementary Tables 1 and 5. h. Left: Heatmap of cell state prevalence across profiled embryonic stages. The median state proportions are calculated across embryos for each time point, then row normalized across time points to show their dynamics. Right: Expression heatmap of our 712 marker genes, with key markers for each state highlighted (see Supplementary Text). Mean state expression for each marker gene is normalized over the column and arranged by maximal expression value across states. i. Left: Uniform Manifold Approximation and Projection (UMAP) of WT cells (n = 88,779) colored by time point from dark to light gray. Right: WT UMAP overlaid with RNA velocity information as an indicator of transcriptome dynamics between different cell states.
Extended Data Figure 2.
Extended Data Figure 2.. Efficient genetic perturbation of epigenetic regulators and cell state characteristics across KO embryo replicates
a. Top: Epigenetic regulators investigated here with information about their target residues and function and grouped into three key pathways: regulation by DNA methylation, Polycomb, or Trithorax. The majority of lethality phenotypes occur soon after our last experimental collection time point (E8.5),,–,–. L3mbtl2 is a methyl-histone binding protein that participates in PRC1 regulation as part of ncPRC1.6. L3mbtl2 and Eed do not possess denoted enzymatic activities (asterisks) but are involved in the functionality of a multicomponent complex. Dnmt3a mutants die postnatally (w, weeks), with signs of defective neural development that may initiate in utero. Bottom: Summary statistics of scRNA-seq data generated for E8.5-isolated embryos with mutations in one of ten target epigenetic regulators (n = 103 embryos total). b. Fraction of cells positive for selected epigenetic regulator genes in WT ordered by developmental stage (E6.5-E8.5). The de novo DNA methyltransferases Dnmt3b and to some degree Dnmt3a become less expressed as the embryo develops, congruent with their early role in remethylating the genome shortly after implantation. n’s reflect the number of embryos collected at each time point. c. Fraction of cells positive for selected epigenetic regulator genes in WT for eight major developmental lineages. n’s reflect the number of embryos for which each lineage was recovered. d. Reads spanning the sgRNA protospacer sequences confirm highly efficient disruption of epigenetic regulator loci. Reads are grouped into the following categories: Mismatched, at least 1 base is a mismatch/deletion/insertion; Spliced/deleted, split read spans over the protospacer sequence; Insufficient, reads do not span the entire cut site; Complete, reads map without any mismatches to the cut site. Mapping distribution of scRNA-seq reads from E8.5 WT embryos is shown in comparison for each target site. A more comprehensive analysis of zygotic disruption is presented for Eed KO in Extended Data Fig. 9. e. KO embryo cells can be described using WT-defined states. Boxplots show the single cell Euclidean distances to their closest (green) and second closest (grey) states per KO experiment. The differences between first and second closest cluster are all significant (P < 2×10⁻¹⁶, Wilcoxon test, two tailed, paired test). We observe similar differences between first and second state assignment between KO cells as we do for the WT cells from which our state kernels were derived. n = 88,779; 20,890; 18,320; 25,408; 20,389; 22,896; 15,589; 18,943; 7,548; 15,776; 15,603 left to right f. Barplots showing the percentage of cells per embryo (x-axis) that were assigned to each of our 42 cell states (colors, y-axis) with E8.5 WT provided for comparison. Notably, KO embryos frequently match earlier developmental stages (Fig. 2a, b, Extended Data Fig. 1g for comparison). Aberrant cell state proportions indicate morphological abnormalities beyond developmental delay. For example, L3mbtl2 KOs underproduce early germ layer states, whereas Eed and Rnf2 mutants initially progress through gastrulation but substantially overproduce posterior products, such as allantois and amnion (states 5, 15, and 41, respectively). For absolute cell counts, see Supplementary Table 5.
Extended Data Figure 3.
Extended Data Figure 3.. Quantifying developmental delay of mutant embryos by cell state composition
a. Cell state composition of epigenetic regulator mutants. Cells were assigned to one of 42 WT cell states and projected onto our WT-defined gastrulation UMAP. That KO cells fall within WT states cannot confirm equivalent functionality or potential, but does suggest that cell states are largely constrained even without key epigenetic regulators. Instead, many KO embryos differ from WT by cell state composition. Adjacent barplots reflect the median embryo composition. A reference key for our WT time series is provided. n = number of cells. b. Distribution across Principal Component 1 (PC1) for WT embryos (dots n = 10, 9, 11, 10, 10) per time point using two data resolutions: a thresholded, binarized score of state presence (Left), or the exact proportion (Right). In PC1 space, embryos from early developmental stages (i.e. E6.5-E7.5) are better resolved according to the presence or absence of key states associated with the primitive streak, while later time points (i.e. E8.0 and E8.5) share many of the same states, but at different proportions. Tissues prone to technical recovery biases during embryo isolation (Xecto and Xendo) were excluded from this analysis (Supplementary Table 5). c. PC1 values for median WT embryos (n = 5 time points, stars). PCAs were based on the binary presence or absence of cell states (x-axis) and on cell state proportions (y-axis). d. Developmental staging of single KO embryo replicates (squares) by projecting them onto the WT-defined PCA space described in c. KOs of the DNA methyltransferases and the histone methyltransferases Kmt2a and G9a show no or mild developmental delays. The Polycomp components Eed, Rnf2, Kdm2b and L3mbtl2 exhibit stronger setbacks in developmental progression, with greater variability. For staging information see Supplementary Table 1. n = 12, 10, 8, 11, 10, 11, 10, 10, 11, 10 embryos e. Clustering of epigenetic regulator mutants based on genes that are recurrently differentially expressed across cell states. Expression changes were determined from scRNA-seq data by comparing each KO to WT cell state, split by embryonic (Top) or extraembryonic (Bottom) origin (Supplementary Table 6). Differentially up- or downregulated genes found in ≥ 2 states are shown in red and blue, with color intensity reflecting the fraction of cell states that change in a given direction (calculated as an average of +1 and −1 states). Within the embryonic lineage, the Kdm2b KO clusters with canonical PRC subunits, even though it progresses further in development. Other regulators show expression differences in fewer cells states and many correspond to within-lineage transitions (Supplementary Tables 6, 7). In these contexts, we cannot distinguish if lineage-specific regulation has been impeded or if these differences are merely a consequence of subtly offset development. Additional GO term analysis: upregulated genes in KOs of the three Dnmt enzymes significantly overlap with imprinted genes (Q = 1.3×10⁻¹² for Dnmt1 KO embryonic, upregulated) and our G9a KO is statistically enriched for genes upregulated in a transgenic G9a knockout model (Q = 0.002 for G9a KO embryonic, upregulated).
Extended Data Figure 4.
Extended Data Figure 4.. Aberrant DNA methylation in epigenetic regulator mutants at the onset of gastrulation
a. Overview of Whole Genome Bisulfite Sequencing (WGBS) data for epiblast and extraembryonic ectoderm (Xecto) of E6.5 WT and KO embryos. Correlation with WT methylation profiles are lowest for KOs of DNA methyltransferases, as expected. Additional data generated using both Dnmt3a and 3b sgRNAs confirms the redundancy of the enzymes and results in a gross reduction in DNA methylation to levels seen for the Dnmt1 KO. b. Correlation heatmaps of global DNA methylation at single CpG resolution between all epigenetic regulator mutants as well as WT, clustered independently for the epiblast and Xecto by Pearson. c. Violin plots of single CpG methylation status in WT and epigenetic regulator mutants. While most KOs do not show obvious differences to WT, large drops in methylation were observed for the KO of the maintenance methyltransferase Dnmt1 and for Dnmt3a and b combined. The effect for Dnmt3b KO alone is substantially weaker albeit more pronounced in Xecto, where it represents the primary de novo methyltransferase. Number of CpGs per sample is reported in a. Epiblast n = 21,232,347; 20,746,311; 19,640,675; 19,972,783; 20,121,708; 16,248,772; 20,976,243; 16,664,297; 20,129,240; 20,731,153; 19,503,271; 20,680,467; Xecto: n = 20,310,650; 20,431,529; 18,644,801; 19,348,253; 17,908,853; 18,481,468; 20,190,473; 20,773,191; 20,483,148; 20,127,465; 19,532,818; 20,532,593 CpGs. d. Scatterplots of CpG island (CGI) methylation in epigenetic regulator mutants (y-axis) versus WT (x-axis) for the E6.5 epiblast or Xecto. Red and blue indicate methylation increases or decreases compared to WT (≥0.1, light; ≥0.25, dark). Dnmt1 KO shows the greatest loss in both epiblast and Xecto, followed by Dnmt3b KO. Kdm2b KO shows substantial gain specifically within the epiblast, which is also apparent in Rnf2 and L3mbtl2 KOs to lesser degrees. In contrast, Eed KO loses CGI methylation within the Xecto. Kmt2b KO has the greatest increase in CGI methylation within both the epiblast and Xecto. n = 12,410 CGIs displayed across all plots. e. CGI methylation in Kdm2b or Kmt2b KO is largely associated with genes that are lowly or not expressed. Left: Venn diagram of hypermethylated CpG island promoters between Kmt2b and Kdm2b KO shows a large overlap. Furthermore, hypermethylated CpG island promoters have a ~2.5-fold enrichment for H3K27me3-based regulation compared to background. Right: Boxplots showing the expression of genes with CGI-containing promoters, calculated as the fraction of positive cells for each embryonic cell state. Data is shown for all CGI promoter-containing genes or for those that are hypermethylated in either the Kmt2b or Kdm2b KO epiblast (bold circles in left, n = 1,026 hypermethylated CGI-containing promoters total between Kmt2b and Kdm2b KO epiblast). Overall, genes that gain promoter methylation are lowly expressed across lineages independent of methylation state. The Kmt2a KO is shown for comparison because it does not gain promoter methylation at E6.5. f. Distance to the nearest CGI center for all CpGs in the genome as well as for hypermethylated (≥ 0.1) CpGs in Eed, Rnf2, Kdm2b and Kmt2b KO epiblast. Kmt2b hypermethylated CpGs are strongly shifted towards the center, while PRC KOs tend to methylate CpGs in close proximity to, but not within, CGIs.
Extended Data Figure 5.
Extended Data Figure 5.. DNA methylation-dependent changes in gene and retrotransposon expression.
a. Average E6.5 DNA methylation (Top) and E8.5 expression (Bottom) for retrotransposon families. Expression was calculated as the normalized fraction of reads recovered from scRNA-seq data for each subfamily. The Dnmt1 KO shows the strongest reduction in methylation across retrotransposons in the epiblast and the Xecto. The ERVK family of LTRs shows the strongest corresponding increase in expression, which is higher in the embryonic lineage than in Xecto. b. Intracisternal A particle (IAP) expression as detected by scRNA-seq depends on DNA methylation. Top: DNA methylation levels as profiled by WGBS. The largest drop in global and IAP-specific methylation is observed for Dnmt1 KO. Bottom: Mean expression within the embryonic and Xecto lineages of E8.5 KO embryos, shown as the fraction of total reads per cell. Epiblast IAPEz-int: n = 5,585; 5,579; 5,510; 5,440; 5,210, Xecto IAPEz-int: n = 5,576; 5,577; 5,498; 5,421; 5,367; 5,575; 5,529; 5,518; 5,500; 5,411; 5,543. c. Scatterplot of E6.5 promoter DNA methylation and E8.5 expression differences in the Xecto lineage of L3mbtl2 KO compared to WT, as shown for the embryonic lineage in Fig. 2g. Differentially hypomethylated (delta ≤ –0.1) and derepressed genes (delta ≥ 0.2 fraction positive cells) in L3mbtl3 KO (green) were strongly enriched in GO terms related to gametogenesis (green asterisks, P < 0.05), in line with previous reports on ncPRC1.6 targets. These genes contain key members of the piRNA biogenesis pathway, including the dead-box helicase Ddx4 (VASA homolog) and Maelstrom, as well as other genes with known functions or expression during gametogenesis. Extraembryonic lineages naturally express certain gametogenesis-associated regulators, which may explain their ability to proliferate in the KO while embryonic lineages arrest shortly after gastrulation onset. d. Genome browser tracks of WGBS methylation data for three aberrantly regulated loci in L3mbtl2 KO embryos. The bidirectional genes Lypd4 and Dmrtc2 initiate from the same CpG island (CGI), while Tex101 does not have a CGI, but does have a higher than genomic average CpG density (see density track). These promoters are specifically hypomethylated in gametes and throughout preimplantation, followed by de novo methylation by E6.5 that continues to increase over development. De novo methylation does not occur in the L3mbtl2 KO and corresponds with sharp increases in gene expression. WT data from gametes, preimplantation embryos, and late stage samples like somatic tissues and the E14.5 placenta are taken from Ref’s. e. Promoter DNA methylation (Top) and E8.5 expression (Bottom, shown as fraction of positive cells per embryo replicate) boxplots of L3mbtl2 sensitive genes (n = 13 genes taken from Fig. 2g, green). Many gametogenesis genes are regulated by “weak” CGI-containing promoters that become methylated during development. In line with this, the promoters of L3mbtl2 KO sensitive genes are hypomethylated in gametes and preimplantation and become de novo methylated over postimplantation development. Derepression is specific to L3mbtl2 KO, and does not occur in Dnmt1 or Dnmt3b KOs, where methylation levels drop globally. Expression changes are also not substantial for Rnf2 or G9a KO although these regulators are also expected to participate in ncPRC1.6 complex-directed repression. A single outlier gene, Ttr, is expressed in all KOs and WT, but is still upregulated in L3mbtl2 KO. Additional data taken from previous studies–,.
Extended Data Figure 6.
Extended Data Figure 6.. Impact of derepressed Polycomb group regulator targets
a. Euclidean distances of PGC-assigned cells from our WT, Eed, Rnf2, and Kdm2b KOs to the mean marker gene expression of our PGC (state 27, magenta), their second closest (light grey) or the epiblast (state 17, dark grey) cell states. PGC-assigned KO cells are transcriptionally distinct from the next closest or epiblast state, supporting our observation that this state is specifically overproduced in the Eed KO. We include the epiblast state as it shares some master regulators with PGCs and because some cells of this state are still present in the Eed KO. The differences between first and second closest or the epiblast state are all significant (P < 0.05 for all tests, Wilcoxon test, two tailed). For each boxplot: center line, median; edges, IQR; whiskers, 1.5xIQR; outliers, individually plotted. Number of recovered PGC state assigned cells is n = 290, 1,564, 250, and 44 for WT, Eed, Rnf2, and Kdm2b. P-value = 2.644257e-49, 3.733801e-257, 9.3103e-43, and 1.136868e-13 for PGC vs 2nd closest state. b. Per cell ChrX to autosome transcript ratios for PRC regulator KOs and WT cells, separated by sex. In our breeding system, X chromosomes are exclusively the B6 genotype, which makes it impossible for us to evaluate mono- vs biallelic transcription. However, these internally normalized measurements reveal increased transcription of ChrX-linked genes within certain KO lineages of female embryos. The Eed KO Xecto is most extreme and shows corresponding proliferation defects at E8.5 (see Fig. 3d). Within the Eed KO, female-specific ChrX deregulation is more subtly observed for the Xendo and embryonic lineages, implying either higher redundancy between PRC1 and 2 after the allocation of the trophectoderm or a lineage-specific failure to renormalize ChrX’s transcriptional output within Xecto. In Rnf2 KO, the effects generally follow a similar trend but are more muted. Embryonic cells: n = 39,411; 37,887; 5,391; 9,233; 4,448; 5,248; 7,459; 11,264, Xecto cells: n = 1,769; 3,685; 755; 1,372; 1,465; 1,220; 19; 1,594, Xendo cells: n = 2,509; 3,518; 773; 1,419; 1,745; 1,463; 1,013; 1,547. c. Reads spanning the sgRNA protospacer sequences confirms high efficiency disruption of Eed and Cdkn2a loci in single (Cdkn2a KO) and double (Eed+Cdkn2a DKO) sgRNA injected embryos. Figure as in Extended Data Fig. 2d. d. Single cells from Cdkn2a KO and Eed+Cdkn2a DKO embryos were assigned to one of our 42 WT cell states, projected onto our WT gastrulation UMAP and compared to E8.5 Eed KO and WT. Barplot shows the median embryo composition. In general, our DKO resembles the Eed KO, demonstrating that the derepression of the Cdkn2a locus in Eed KO is not responsible for the overall phenotype. The Cdkn2a KO is indistinguishable from WT. n = cells. e. Correlation heatmap of average cell state composition for our Cdkn2a KO and Eed+Cdkn2a DKO embryos compared to WT stages and other core PRC component KOs, including a 24 h resolution Eed KO time series described below (Fig. 4, Extended Data Fig. 10). Cdkn2a KO clusters with WT E8.0 and E8.5, while the Eed+Cdkn2a DKO clusters with WT E7.5 as well as our Eed and Rnf2 KOs. n = 42 cell states, Pearson correlation.
Extended Data Figure 7.
Extended Data Figure 7.. Molecular abnormalities of Polycomb group regulator mutants
a. Left: Large, multi-kb DNA methylation valleys (DMVs) associated with developmental genes gain DNA methylation in PRC KOs. We clustered 8,972 DMVs that exist within the WT E6.5 epiblast according to their methylation in our PRC KOs. A discrete set of 248 is specifically methylated within our Eed, Rnf2, and Kdm2b KOs (cluster 1). Compared to the non-dynamic set (no change), these differentially methylated DMVs are enriched for marker genes as identified by this study, the modification H3K27me3, and for CGI hypermethylation within the Xecto lineage. They are also ~4.3 times larger than constitutively hypomethylated DMVs (mean span = 12.2 kb for dynamically methylated, 2.8 kb for no change). Enrichment is calculated as an odds ratio (OR) or fold change (FC) compared to no change. DMV methylation status across these KOs is available as Supplementary Table 8. n = 248 DMVs in cluster 1 vs n = 6,888 for no change. Right: DNA methylation violin plots of the 248 DMVs that gain CpG methylation within the E6.5 epiblast of our PRC KOs. “DMV” measures methylation of all non-CpG island CpGs within DMV boundaries, while “CGI” measures those for all CGI positioned within DMV boundaries (n = 529). “CGI (Xecto hyper)” measures the methylation for the subset of DMV-associated CGI that are specifically de novo methylated in WT Xecto (n = 191). In the epiblast, DMV methylation is highest for Rnf2 KO and lower for the same regions in Eed KO. In contrast, Kdm2b KO shows substantial heterogeneity, with >55% of DMVs showing lower methylation compared to the Eed KO. The DMVs that gain DNA methylation in the epiblast of PRC KOs are generally naturally de novo methylated in the Xecto (including methylation of CGIs). Here, the CGIs in the Eed KO pose an exception as they show a specific loss of methylation. b. Heatmaps showing the WT expression status of 303 genes contained within differentially methylated DMVs. In PRC component KOs, the loss of bivalence may prime genes for induction. However, there is no clear correlation between the genes located within differentially methylated DMVs and the lineages that are ultimately overproduced. While the exact relationship remains unclear, our DNA methylation analysis indicates that aspects of the PRC mutant phenotype begin to manifest within the pre-gastrula embryo, leading to similar epigenetic changes within the promoters of master regulators associated with all three germ layers. Left: Mean DMV methylation for each KO and WT as calculated in a (with CGI CpGs excluded). Middle: Row-normalized expression of DMV-associated genes across our 42 WT states. Right: Fraction of KO cell states where a given gene is recurrently up- or downregulated. DMVs (rows) are clustered by methylation status and cell states (columns) by DMV-associated gene expression. Top: Identity and presence of cell states in E8.5 KOs. States are designated as early, middle or late (most prevalent in WT at E6.5 to E7.0, E7.5, or E8.0 to E8.5, respectively). The cumulative number of DMV-associated genes expressed within each state in WT is also provided. c. The percentage of DMV-associated genes that are expressed in our 42 WT states collapsed into early, middle or late based upon when states emerge (E6.5–7.0, E7.5, or E8.0-E8.5). In general, differentially methylated DMV-associated genes are normally expressed in the middle or late periods of our gastrulation time series.
Extended Data Figure 8.
Extended Data Figure 8.. PRC1 and 2 converge to block non-CpG island hypermethylation within DNA methylation valleys (DMVs)
a. Scatterplots of the difference between Eed KO and Rnf2 KO CpG island (CGI) methylation compared to WT for E6.5 epiblast (Left) and Xecto (Right), respectively. While overall Eed and Rnf2 KOs share a similar DNA methylation landscape within the epiblast, we identify some regions where the Rnf2 KO is differentially methylated and the Eed KO more closely resembles WT. Eed KO shows a more substantial loss of CGI methylation specifically within Xecto, while Rnf2 KO shows increased levels in epiblast that is primarily due to changes in flanking areas (see Fig. 3h). b. Genome browser WGBS methylation tracks for representative loci as they are regulated within the E6.5 epiblast (upper, dark grey) and Xecto (lower, light grey) in WT, Eed, Rnf2, or Kdm2b KO. Genes include master regulators from all three germ layers: Hand2 and Tbx1, mesoderm; Gata4, endoderm; Pax6, Otx2, and Sox1, neural ectoderm. CGI and local CpG density tracks are provided below. Promoter regions of these developmental genes are generally preserved as extended multi-kb hypomethylated domains. However, in Eed and Rnf2 KO, non-CGI CpGs become hypermethylated while the CGI remain unmethylated. This trend is also observed for the Kdm2b KO but to a substantially lower degree. Changes to promoter methylation status appear to be independent of the gene’s association with particular lineages or expression status at E6.5: mesodermal, endodermal and ectodermal regulators are affected. These regions are also extensively de novo methylated within the Xecto lineage during normal development, including at the CGIs themselves. Within the Xecto, Eed KO specifically causes loss of CGI methylation. Notably, Eed KO-specific methylation changes within the Xecto are also found at loci that do not acquire methylation changes in epiblast, such as for Otx2. c. Genome browser WGBS tracks for the Prdm14 locus in the epiblast (Left) and Xecto (Right) of WT, Eed, Rnf2, Kdm2b and L3mbtl2 KOs. Although this region is retained as a hypomethylated DMV in the WT and Eed KO epiblast, it is specifically methylated in PRC1 subunit KOs. In Xecto, the Prdm14 promoter is naturally methylated but specifically unmethylated in Eed KO.
Extended Data Figure 9.
Extended Data Figure 9.. Efficient Cas9-mediated zygotic disruption of the Eed locus across an expanded time series
a. Expanded description of our zygotic perturbation strategy for Eed. Three sgRNAs were designed to balance high efficiency cutting, off target potential, and coverage across the first half of the coding sequence (see Methods). Then, selected sgRNAs were injected as a pool to provide a high likelihood of functionally disruptive mutations. b. Comprehensive analysis of scRNA-seq reads aligned to the Eed transcript from E6.5, 7.5, 8.5 WT and Eed KO data. Top: Composite plot showing the fraction of reads that map continuously (light blue) or discontinuously due to spliced or deleted sequences (dark grey) to the Eed mRNA annotation. Substantially more reads map discontinuously in the KO compared to the WT, reflecting alterations in the transcripts as a result of Cas9-mediated genetic disruption. Middle: Read-level analysis of our E6.5, 7.5, 8.5 WT embryo data. Position of the three sgRNA target sequences (red) within the Eed mRNA are shown. The sgRNA target regions are magnified with aligned scRNA-seq reads from each embryo shown below (color bar to the left of each read stack). Each row of the read stack represents the mapped sequence of an scRNA-seq read. Reads are color coded as exactly matched (light blue) or spanning the deleted/spliced out target site (dark grey). Light grey indicates no data for this read at a given position (read ends). Even though the scRNA-seq strategy preferentially profiles the 3’end of transcripts, many reads can be found that span sgRNA target regions in data from WT embryos, with a subset covering the entire target site without mismatches, insertions or deletions. Bottom: Read-level analysis for our Eed KO samples from each time point. Compared to WT, a much lower number of reads from the Eed KO data match the target sites, likely a result of nonsense mediated decay or improper transcript processing. Moreover, aligned reads are imperfect, either spanning a deleted/spliced out target site (dark grey) or mapping with mismatches (dark blue), local deletions (green) or insertions (orange indicates the nucleotide to the right of an insertion). c. Representative immunofluorescence staining of H3K27me3 in WT and Eed KO embryos. Single z-stack displaying an anterior region of size-matched WT (E7.5) and Eed KO (E8.5) embryos (H3K27me3, red; nuclei stained by DAPI, blue). The nuclear signal for H3K27me3 is readily detectable in WT but absent in Eed KO. Two independent experiments were conducted with similar results.
Extended Data Figure 10.
Extended Data Figure 10.. Developmental roles of PRC2 during gastrulation
a. Our scRNA-seq profiled Eed KO series isolated at E6.5, 7.5, and 8.5. See Supplementary Tables 1 and 5 for information on sex-typing and cell state composition of individual embryos. b. Representative WT and Eed KO embryos at gestational days E6.5, 7.5, and 8.5, with size information (image area occluded by an embryo in μm2, n = embryos imaged, all experiments had been replicated at least once, with similar results). Eed KO embryos initially appear similar to WT in size and morphology, but become substantially smaller and more variable in morphology, consistent with previous reports using transgenic models,,. The initial lack of obvious abnormalities at E6.5 may indicate a later biological requirement or mitigating effects of maternally loaded PRC2, which is detectable until E3.5 (Ref). Complete Eed disruption is supported by the consistency of the resulting phenotype, as Eed+/– animals are viable and appear phenotypically normal during this period. WT embryos shown here are from natural matings isolated at the same gestational age. c. Connected barplots of median cell state composition across developmental stages for WT and Eed KO embryos, respectively. WT embryos rapidly increase in complexity, while Eed KOs advance more slowly and become substantially biased towards PGCs and extraembryonic mesoderm. The lack of more advanced neural ectoderm (dark greens) and embryonic mesoderm (purples) may be due to developmental delay or the abnormality of precursor states. Outermost extraembryonic tissues (Xendo, Xecto) can be technically variable during isolation and their proportions should be taken with caution. d. Absolute PGC numbers estimated for individual embryos (dots) show that the Eed KO overproduces PGCs beyond what is observed for WT over gastrulation. Eed KO embryos are presented after accounting for their developmental delay (i.e. PGC numbers of E8.5-isolated Eed KO embryos that match developmental stage E7.5 are displayed for E7.5). Wilcoxon test, two-sided, P-values: 0.322 (E6.5), 0.008 (E7.5), 0.0003 (E8.5), * P < 0.05, ** P < 0.01, *** P < 0.001; n = 10, 15, 9, 10, 11, 9, 10, and 10 embryos, left to right. e. Fraction of Cdkn2a transcript positive cells in recovered cell states (dots), shown per lineage across our WT and Eed KO time series. Cdkn2a is broadly derepressed across lineages in Eed KO from E6.5 onward. n = 10; 19; 1; 3; 1; 4; 3 cell states f. Ratio of X chromosomal to autosomal transcripts for all male and female cells isolated across our WT and Eed KO time series, separated according to preimplantation lineage (embryonic, Xendo, and Xecto). Derepression of ChrX-linked genes happens as early as E6.5 in Eed KO females. Xecto becomes substantially underproduced in Eed KO females over time (n = 428, 295, and 19 female Eed KO cells from E6.5-E8.5). Xendo and embryonic lineages show increased ChrX transcription, but not to the degree that is observed in Xecto. Embryonic: n = 581; 424; 7,119; 3,714; 4,188; 18,730; 9,519; 11,551; 18,004; 3,468; 3,541; 2,410; 6,041; 2,263; 7,459; 11,264; Xecto: n = 325; 355; 830; 360; 120; 2,371; 485; 552; 9; 47; 428; 649; 295; 363; 19; 1,594; Xendo: n = 295; 300; 780; 415; 134; 1,879; 533; 704; 767; 220; 930; 947; 1,531; 548; 1,013; 1,547 cells g. Venn diagrams of epiblast or early ectoderm 1 cells (states 17 and 8, respectively) that are positive for key transcription factors associated with germline formation,. These transcripts are more abundant in Eed KO and more frequently present within the same cells, suggesting a PGC-supporting subnetwork within alternative lineages, possibly due to insufficient silencing prior to gastrulation.
Extended Data Figure 11.
Extended Data Figure 11.. EedKO mouse ESC differentiation recapitulates many features of the in vivo mutant phenotype
a. Generation of a homozygous EedKO mESC line. The Eed gene was deleted in V6.5 mESCs by simultaneous Cas9-targeting of flanking sequences (red) to create a >20 kb deletion. Sanger sequencing confirmed complete deletion by non-homologous end joining for both alleles (sequences aligned to chromosomal sequence above with dashes for missing nucleotides). b. Western blot of histone extracts for H3K27me3 confirms homozygous Eed deletion and depletion of H3K27 trimethylation. Histone 4 served as loading control. c. Transcript counts of 44 genes associated with pluripotency, early germ layers, and the germline over directed differentiation experiments from EedKO mESCs. WT and EedKO mESCs were maintained in conditions supporting a naïve, inner cell mass-like state (2i), then subjected to low concentrations of bFGF for 24 h followed by culture in neural ectodermal and mesendodermal inducers for an additional 48 h. Top: The combination of signaling molecules and/or inhibitors used. Concentration ranges are indicated by circle diameter and small molecule inhibitors by crosses. Inhibitors were included to promote neural ectodermal gene induction by counteracting competing pathways. 12 ng/ml bFGF; 0.25 μM RA; 5 and 500 ng/ml BMP4; 10, 100, 1000 ng/ml WNT-3A; 10 and 1000 ng/ml ACTIVIN A; 0.5 μM BMP4 pathway inhibitor LDN-193189; 3.3 μM Wnt pathway inhibitor XAV939; 10 μM TGF-β/Activin/NODAL pathway inhibitor SB431542. Bottom: Heatmap of log2-transformed molecule counts (red being highly expressed) for WT and EedKO, separately. Black tile frames indicate significant changes between WT and KO. During differentiation, many pluripotency factors associated with the germline remain expressed in EedKO mESCs, especially within mesendodermal supporting conditions. Many mesodermal genes are also induced in EedKO in neural ectodermal supporting conditions. Retinoic Acid (RA) treatment directs a fraction of WT mESCs to an extraembryonic endodermal fate. This appears to be favored in EedKO mESCs, where many Xendo-associated genes are particularly sensitive to RA. Finally, many regulators of the endoderm, early mesendoderm and extraembryonic mesoderm, such as Gata4, Tbx20 and Bmp4, are broadly expressed in EedKO mESCs already in 2i/LIF. n = 3 experimental replicates profiled with the PlexSet assay on the NanoString nCounter SPRINT instrument. Significance (two-sided t-test) was tested for genes in conditions where at least one of the two cell lines produces a minimum average of 50 counts above background. d. Barplots of normalized, absolute Nanostring molecule counts for the genes and conditions presented as fold change in Fig. 4f. Mesodermal genes exhibit some responsiveness to exogenous signals and can be induced to different degrees under supportive conditions (BMP4 and WNT3A). However, many are also more highly expressed without these stimuli, particularly genes associated with posterior, extraembryonic mesodermal fates. Raw counts were normalized based on the expression of four housekeeping genes and a conservative background subtraction to account for the potential of false negative signals. Two-sided t-test, * <0.05, ** <0.01, ***<0.001, bars show the mean of n = 3 experimental replicates and error bars represent standard deviation. P-values are provided in the Source Data file Nanostring_pval.tsv.
Figure 1.
Figure 1.. Single-cell profiling of early post-implantation development
a. Uniform Manifold Approximation and Projection (UMAP) plots of 88,779 WT single-cell transcriptomes, separated by time point (black dots). n = replicate embryos b. UMAP of our WT scRNA-seq time series from panel a. Numbers denote the 42 cell states, colors indicate states of the same major lineages. c. Curated lineage tree of cell states. States were annotated and connected according to their emergence, marker gene expression, the literature and scRNA velocity (Extended Data Fig. 1h, i, Methods and Supplementary Text). Dashed arrow represents neuromesodermal progenitor (NMP)-containing states that are reported to contribute to neuroectoderm. Extraembryonic ectoderm and endoderm are disconnected to reflect their preimplantation origins. 0:extraembryonic ectoderm late, 1:neural ectoderm anterior, 2:primitive streak late, 3:streak pre-specified|anterior, 4:endoderm primitive(a)|definitive(b), 5:allantois, 6:2° heart field|splanchnic lateral plate, 7:gut, 8:ectoderm early 1, 9:primitive blood early, 10:preplacodal ectoderm, 11:neural ectoderm progenitor, 12:posterior lateral plate mesoderm, 13:hematopoeitic|endothethial progenitor, 14:parietal endoderm, 15:amnion mesoderm early, 16:surface ectoderm, 17:epiblast, 18:somites, 19:ectoderm early 2, 20:splanchnic-lateral|anterior-paraxial mesoderm, 21:primitive heart tube, 22:primitive blood late, 23:notochord, 24:fore|midbrain, 25:extraembryonic ectoderm early, 26:NMPs early, 27:PGCs, 28:differentiated trophoblasts, 29:visceral endoderm early, 30:presomitic mesoderm, 31:NMPs late, 32:angioblasts, 33:neural crest, 34:pharyngeal arch mesoderm, 35:similar to neural crest, 36:primitive blood progenitor, 37:primitive streak early, 38:node, 39:future spinal cord, 40:visceral endoderm late, 41:amnion mesoderm late. Note, “state 35:similar to neural crest” is not enriched for specific markers but most closely resembles “33:neural crest.” It is disconnected from the tree to reflect this ambiguity.
Figure 2.
Figure 2.. Morphological and molecular consequences of epigenetic regulator mutation
a. Example of single-cell data for one of our epigenetic regulator mutants at E8.5. KO cells were assigned to WT cell states (colors) and projected onto our gastrulation UMAP (see Extended Data Fig. 3a for all KOs). b. Developmental staging according to cell state composition. Circle size denotes KO embryo number assigned to a given WT stage (y-axis). Colors indicate sex. c. Hierarchical clustering of KOs based on composition (Top) and transcriptional deregulation (Bottom) of cell states compared to matching WT stages. d. CGI methylation across our KOs at E6.5. Hyper- or hypomethylation in comparison to WT for absolute changes ≥0.1 and ≥0.25. Dnmt1 KO shows the greatest loss in the epiblast, both Dnmt1 and 3b KOs show large effects in Xecto. Kmt2b and Kdm2b KO show substantial and overlapping CGI methylation in epiblast (Venn diagram), while Xecto is only affected by Kmt2b. e. DNA methylation (violin plots) of IAPs in E6.5 epiblast and per embryo IAP expression (blue dots) as fraction of reads per cell in E8.5 embryonic lineages. White dots, median; edges, the IQR; and whiskers,1.5xIQR. f. Representative E8.5-isolated L3mbtl2 KO embryo (of 10 total collected for scRNA-seq, injections were replicated three independent times with similar morphological results). Dashed lines demarcate lineages and pie charts show median proportions as calculated by scRNA-seq compared to stage-matched WT. Xecto and Xendo are overabundant, while embryonic lineages are substantially impeded. Scale bar, 200μm. g. Scatterplot of changes in E6.5 epiblast promoter methylation (x-axis) and E8.5 embryonic expression (y-axis) for L3mbtl2 KO compared to WT. Green indicates genes that lose promoter methylation (≥0.1) and increase expression (≥0.2 fraction of positive cells). Asterisks, genes that function in gametogenesis. n = 13 gene promoters.
Figure 3.
Figure 3.. Phenotypic and molecular abnormalities of PRC regulator mutants
a.-b. Fraction of cells assigned to the allantois (a) and PGC state (b) per embryo. Dots, outliers; n=10;9;11;10;10;10;11;10 embryos, left to right c. Prdm14 reporter activity in representative E8.5-isolated WT, Rnf2 and Eed KO embryos (from total of 4,7,5 embryos, respectively). Scale bars, 200 μm. d. Per embryo fractions assigned to Xecto cell states, separated by sex. ***, P≤0.001, two-sided Wilcoxon test, n=25;25;4;6;6;5;5 embryos and P-value=0.1276;0.9118;0.7618;0.0001 left to right e. ChrX to autosome transcript ratios per Xecto cell, separated by sex. Outliers omitted; n =1,769;3,685;755;1,372;1,465;1,220;19;1,594 cells f. Boxplots of the PRC target Cdkn2a, shown as the fraction of positive cells for each state (dots) grouped by lineage (colors). In WT, expression is limited to Xecto and Xendo, with mixed signal in endoderm (Endo) potentially reflecting its heterogeneous origins. n=10;19;1;3;1;3;4 cell states, a,b,d-f boxes, median and quantiles; whiskers, 1.5xIQR g. Developmental gene associated DNA methylation valleys (DMVs) gain methylation in PRC KOs in E6.5 epiblast. CpG resolution genome browser tracks of WGBS for the neuroectodermal regulator Pax6. CGIs and CpG density are provided. h. Median CpG methylation centered on CGIs within differentially methylated DMVs for E6.5 epiblast (Left) and Xecto (Right). CGIs that are normally methylated in the Xecto (WT) do not acquire de novo methylation in Eed KO (Supplementary Table 8). i. Dppa3-positive cells over our WT time series (E6.5–8.5) and in PRC KOs, with the PGC-assigned subset highlighted in pink. Percentages are indicated per major lineage. In the embryo proper, black and pink dots sum to the total fraction of Dppa3+ cells. Embryonic; Xecto; Xendo cells: WT n=77,298; 5,454; 6,027, Kdm2b n=14,624; 2,127; 2,192, Rnf2 n=9,696; 2,685; 3,208, Eed n=18,723; 1,613; 2,560
Figure 4.
Figure 4.. The Eed mutant phenotype extends from disrupted pluripotency exit
a. Developmental stage assignment of our Eed KO time series as in Fig. 2b. Arrow strength corresponds to the fraction of embryos matching a WT reference stage. Subsequent analyses compare Eed KO embryos to their closest WT stage. b. Representative E6.5 Eed KO embryo (out of 4 collected and analyzed from one experiment) showing Prdm14::mVenus signal within the posterior-proximal epiblast. Scale bar, 100 μm. c. Composition and expression changes in Eed KO embryos. KO state proportions were compared to matched WT stages (circle sizes). Gene expression correlation (purple to yellow) was determined using our defined marker genes. States are organized according to lineage. The earliest states (within conceptus) are less affected compared to later states. Many later states are not observed (grey), but whether some could be produced before lethality remains unclear. Proportion changes for outermost tissues (Xendo and Xecto) may be sensitive to technical variability during isolation. State annotation as in Fig. 1c. d. For WT and Eed KO, Venn diagram of pre-specified and anterior primitive streak (state 3) cells that express key transcription factors with shared functions in pluripotency and the germline. e. Select mesodermal lineages and PGCs as they stem from the pluripotent epiblast. Grey-scale indicates fraction of Hoxb1+ and Hoxd9+ cells. Eed KO embryos induce Hoxd9 prematurely, leading to a profile that resembles extraembryonic lineages. Differential up- or downregulation is highlighted in red or blue, respectively. States that are not produced are dashed. f. Log2-fold change between KO and WT for select genes, taken from a total of 44 profiled using Nanostring (n = 3 experimental replicates, Extended Data Fig. 11, Supplementary Table 11). Top rows: circles, morphogen concentrations; crosses, inhibitors. Grey boxes, expression below threshold in both samples.

Comment in

  • Testing the developing epigenome.
    Burgess DJ. Burgess DJ. Nat Rev Genet. 2020 Oct;21(10):579. doi: 10.1038/s41576-020-00282-z. Nat Rev Genet. 2020. PMID: 32820272 No abstract available.

References

    1. Hemberger M, Dean W & Reik W Epigenetic dynamics of stem cells and cell lineage commitment: digging Waddington’s canal. Nature Publishing Group 10, 526–537 (2009). - PubMed
    1. Meissner A Epigenetic modifications in pluripotent and differentiated cells. Nat. Biotechnol 28, 1079–1088 (2010). - PubMed
    1. Surani MA, Hayashi K & Hajkova P Genetic and epigenetic regulators of pluripotency. Cell 128, 747–762 (2007). - PubMed
    1. Rivera-Pérez JA & Hadjantonakis A-K The Dynamics of Morphogenesis in the Early Mouse Embryo. Cold Spring Harb Perspect Biol 7, a015867 (2014). - PMC - PubMed
    1. Plass M et al. Cell type atlas and lineage tree of a whole complex animal by single-cell transcriptomics. Science 360, eaaq1723 (2018). - PubMed

Publication types

Substances

LinkOut - more resources