. 2020 Aug;584(7820):244-251.
doi: 10.1038/s41586-020-2559-3. Epub 2020 Jul 29.

Index and biological spectrum of human DNase I hypersensitive sites

Affiliations

Index and biological spectrum of human DNase I hypersensitive sites

Wouter Meuleman et al. Nature. 2020 Aug.

Abstract

DNase I hypersensitive sites (DHSs) are generic markers of regulatory DNA1-5 and contain genetic variations associated with diseases and phenotypic traits6-8. We created high-resolution maps of DHSs from 733 human biosamples encompassing 438 cell and tissue types and states, and integrated these to delineate and numerically index approximately 3.6 million DHSs within the human genome sequence, providing a common coordinate system for regulatory DNA. Here we show that these maps highly resolve the cis-regulatory compartment of the human genome, which encodes unexpectedly diverse cell- and tissue-selective regulatory programs at very high density. These programs can be captured comprehensively by a simple vocabulary that enables the assignment to each DHS of a regulatory barcode that encapsulates its tissue manifestations, and global annotation of protein-coding and non-coding RNA genes in a manner orthogonal to gene expression. Finally, we show that sharply resolved DHSs markedly enhance the genetic association and heritability signals of diseases and traits. Rather than being confined to a small number of distal elements or promoters, we find that genetic signals converge on congruently regulated sets of DHSs that decorate entire gene bodies. Together, our results create a universal, extensible coordinate system and vocabulary for human regulatory DNA marked by DHSs, and provide a new global perspective on the architecture of human gene regulation.


Conflict of interest statement

The authors declare no competing interests.

Figures
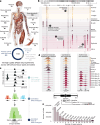
Fig. 1
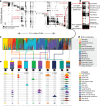
Fig. 1. Index of DHSs in the human genome.
a, DNA accessibility assayed across multiple biosamples (indicated) from the main human organ systems. Of 733 biosamples, 531 were derived from primary cells and tissues. b, Example locus on chromosome 1, showing DNase I cleavage density in haematopoietic biosamples (right) with cell type-selective differences. c, Outline of DHS index procedure; 76.5 million DHSs aggregated across individual datasets jointly delineate and annotate 3.59 million consensus DHSs. d, Examples of consensus DHSs with varying cell-type selectivity and genome positional stability. Annotations include consensus DHS coordinates (start/end), single-base ‘centroid’, ‘core’ region aggregating centroids across biosamples, and a unique numerical identifier. e, Number of organ systems across which DHSs are shared.
Fig. 2
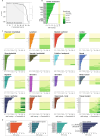
Fig. 2. A simple vocabulary captures complex patterning of DHSs.
a, DNA accessibility at 3.59 million consensus DHSs assayed across 733 biosamples encapsulated in a visually compressed DHS-by-biosample matrix. Recurring accessibility patterns indicate extensive sharing across cell contexts. Dark column (right) shows DHSs detected in (nearly) all datasets. b, Modular behaviour of DHS actuation illustrated by thousands of DHSs with similar cross-biosample accessibility patterns. c, Decomposition of DHS actuation patterns across 733 biosamples into 16 components using NMF. The cellular patterning of each DHS is described using a mixture of components, indicated by distinct colours. d, DHS component labels provide a regulatory vocabulary for DHSs. e, Component mixtures for ten example DHSs with varying degrees of component specificity. The biosample dataset most strongly associated with each component is shown. Bottom, annotation of individual DHSs with a single dominant component.
Fig. 3
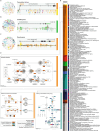
Fig. 3. Regulatory annotation of human genes.
a, Over-representation of DHS components in gene bodies and immediate flanks (maximum 5 kb upstream and 1 kb downstream). b, Percentage of genes annotated with DHS components (GENCODE gene categories). c, Regulatory annotation of GATA1, FOXP3, HOXB9 and CDX2 genes. d, Two-dimensional t-distributed stochastic neighbour embedding (t-SNE) projection of DHS component enrichment patterns across genes, coloured by dominant significant component (number of genes per component indicated). e, f, Summarized view of number of genes per component. Top five results for all protein-coding genes (e) and TF genes subset (f), for selected components. g, Correspondence between regulatory annotation and RNA expression shown using relative transcriptional activity across a panel of component-matched tissues and cell types (log2 observed/expected ratios). h, Putative TF-dependent regulatory elements defined by DHSs exclusively sharing regulatory components with genes encoding a given TF that also contain an occupied (footprinted) cognate TF motif.
Fig. 4
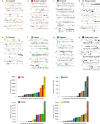
Fig. 4. DHS components illuminate genetic associations and heritability.
a, Association of DHSs with GWAS traits by component, shown as enrichment ratios for increasingly stringent subsets of variants (canonical genome-wide significance threshold of 5 × 10⁻⁸ indicated). Grey, enrichments for top 15 component-associated biosamples. b, Stratified LD-score regression (S-LDSC) for traits shown in a associates GWAS variants and DHS components. Heritability enrichment for the top three most enriched baseline annotations (white); the full DHS index (grey); and trait-relevant DHS components (red). *Statistically significant enrichment (one-sided test, 1% FDR). c, Enrichment of DHS component (x-axis) heritability across 261 GWAS traits (y-axis). Greyscale indicates heritability enrichment levels for statistically significant associations (one-sided tests, 1% FDR). Right, sampling of labels of enriched traits for each component. Arrows, traits from a and b. d, Distribution of S-LDSC coefficient z-scores across 261 GWAS traits, shown for all baseline annotations (dashed grey line), top 15 DHS component-associated biosamples (solid grey line) and DHS components (black line). e, S-LDSC coefficient z-scores for selected traits (lupus, q = 0.002; maximum heart rate during fitness, q = 0.016; alcohol drinking status, q = 0.009), shown for all biosamples (grey lines), top 15 component-associated biosamples (coloured ticks) and DHS components (coloured arrows). f, Stronger heritability contribution of component-concordant DHSs shown by stratifying S-LDSC z-scores by DHS types. Boxes, medians and IQRs (25–75%); whiskers, 1.5 × IQRs; n = 261 GWAS traits. Grey areas in df indicate S-LDSC z-scores (S-LDSC coefficients, normalized using estimated standard errors) with P < 0.01; FDR-corrected q-values shown for traits in e.
Extended Data Fig. 1
Extended Data Fig. 1. Construction of a DHS index.
a, Increase in number of DNase-seq datasets relative to previous efforts. b, c, Delineation of index DNase I hypersensitive sites (DHSs) from raw DNase-seq signal tracks, shown for simplified data (b) and actual data (c). Starting from individual DNase-seq datasets (step 1), we call peaks in each dataset (step 2), aggregate peak summits into clusters, indicating isolated accessibility events (step 3), group full peak coordinates according to these clusters (step 4), and delineate DHSs using full-width at half maximum (FWHM) (step 5). d, Increase in number of detected DHSs relative to previous efforts. e. Detailed view of FWHM delineation. f, g, Confidence scores based on DNase I signal strengths assigned to each DHS, allowing for pragmatic filtering using either summed (f) or mean (g) signal strength—the former assigning high confidence scores to DHSs with overall high signal levels across datasets, the latter providing a score normalized by the number of datasets in which a DHS was observed.
Extended Data Fig. 2
Extended Data Fig. 2. Genomic context of DHS index elements.
a, Overall coverage of 3.5M+ DHSs across genes and repetitive elements. b, Coverage of classes and families of repetitive elements. c, Coverage of annotated genic regions. d, Barplot of the number of DHSs as a function of distance to the nearest annotated transcription start site (TSS), up to 100,000 base pairs. e, Density plot of DHS distance to the closest TSS for all index DHSs, showing that the vast majority of DHSs are found distal to annotated promoters. f, Density plot of element widths for full DHSs and their core regions only, shown for DHSs observed in more than one biosample. Uniform 20 bp jitter added for smoothness. g, DHS centroids show an increase in sequence conservation (phyloP) and a decrease in within-human sequence variation (TOPMed, π × 104). h, Mean number of new DHSs observed as a function of the nth DNase-seq dataset added, shown for the first 733 observed biosamples, as well as for an extrapolation to an additional future 733 new biosamples. i, Histogram indicating the variety in cell type selectivity of DHSs, ranging from single cell types to groups of 10s, 100s or even all assayed cellular conditions.
Extended Data Fig. 3
Extended Data Fig. 3. NMF decomposition of DHS index.
a, Schematic of non-negative matrix factorization (NMF) applied to an n-by-m matrix resulting in k components. The objective is to minimize the difference between the original matrix (V) and the product of (W) and (H), such that all elements of (W) and (H) are non-negative. b, Depiction of NMF applied to our DNase-seq dataset of 733 biosample datasets and 3.5M+ DHSs, using k components. c, Colour-based view from the values shown in b. Colours indicate relative loadings of each NMF component, for both biosamples and DHSs. d, Two-dimensional UMAP projection of 733 biosamples coloured by their strongest representative NMF component. e, Choice of NMF decision boundary (0.35) based on maximal F1 score as a function of number of components k (4 to 36). f, F1 score as a function of the number of components k, with the chosen k = 16 and corresponding F1 score indicated. g, Gradient showing reduced gain in F1 score after k = 16.
Extended Data Fig. 4
Extended Data Fig. 4. Association of DHS components with cellular conditions and TF motifs.
a, Bar plots showing for each NMF component the top 15 DNase-seq datasets in terms of NMF loadings. NMF loading strength (x-axes) and dataset labelling (y-axes) are indicated. b, Box plots showing for each NMF component its loadings across those biosamples for which that component is maximally loaded. Boxes denote medians and interquartile ranges (IQRs, 25–75%), whiskers represent 1.5 × IQRs, n = 18,57,46,27,52,23,34,49,40,107,33,27,54,40,36,90 biosamples, respectively. c, Beyond the top 15 biosamples for each component, general associations of components with annotations regarding human organ systems and cancer. Indicated are Bonferroni corrected P values, resulting from one-sided Mann–Whitney U tests. d, Distribution of biosamples across (maximal) NMF components, for the number of components (k) ranging from 2 to 16. Labels at the top indicate at which point distinct lineages became represented in corresponding components. e, Enrichment of transcription factor (TF) binding motifs in DHS components. Greyscale values indicate enrichment levels, only statistically significant results are included. DHS components shown on the x-axis, TF motif clusters with top representative motif on the y-axis. f, Top enriched TF motifs for each DHS component.
Extended Data Fig. 5
Extended Data Fig. 5. DHS component robustness.
a, F1 score as a function of L1 penalization levels (ƛ), with separately indicated levels of sparsity reflected by the percentage of non-zero parameters in the resulting models. Shaded area represents penalization levels resulting in comparable 16-component models, as opposed to models with effectively less than 16 components, which are discarded in subsequent analyses. b, All biosamples with non-zero NMF loadings in the cardiac DHS component (for ƛ = 0). Horizontal line separates the top 15 biosamples (yellow shading) from the rest (shades of green), where green shading indicates quantile ranking in terms of component loading strength. c, Biosamples with non-zero NMF loadings for each DHS component, extended with agreement of quantile ranking as a function of L1 penalization levels, indicating that these rankings stay near constant for most components. d, Top 15 biosamples in terms of NMF loading per DHS component for an alternative NMF model resulting from a 40% downsampling of high-quality haematopoietic biosamples. NMF loading strength (x-axes) and dataset labelling (y-axes) are indicated, only for components that differ with the final model.
Extended Data Fig. 6
Extended Data Fig. 6. Clustering of same-component DHSs near genes.
a, Component-specific genomic clustering of DHSs, as shown by the median distance between same-component DHSs as compared to the median distance after random permutation of DHS-component labels. b, Regulatory landscape +/− 50kb around the GATA1 gene, indicating GENCODE gene annotations, meta-DNase tracks for individual DHS components (Methods), and a meta-DNase overlay track. c, Detailed view, restricted to the GATA1 regulatory landscape, including its delineated and annotated DHSs. Collectively, this landscape shows a statistical over-representation of DHSs associated with the myeloid/erythroid (red) component. d, Density plot of DHS distance to the closest TSS for all Index DHSs (black line) and the subset (65%) of DHSs considered for the purpose of annotating genes using DHS components. e, f, Alignment plots showing DHS summit density across the transcription start sites (TSSs, e) and transcription termination sites (TTSs, f) of annotated genes. Shaded areas indicate regions included for the purpose of annotating genes using DHS components. g, DHS density expressed in terms of number of DHSs per kilobase, indicating a general enrichment of DHSs in and immediately surrounding genes. h, Venn diagram showing the overlap between regulatory annotations based on the gene-centric approach described in this work and a TSS-centric approach (+/−5kb). The gene-centric approach captures the vast majority of genes annotated using the TSS-centric approach, while adding an additional approximately 11,000 genes. i, Type of genes annotated using a gene-centric versus TSS-centric approach, showing the former yielding larger fractions of protein-coding and long non-coding genes.
Extended Data Fig. 7
Extended Data Fig. 7. Top labelled genes for selected components.
ad, Top-scoring protein-coding genes per DHS component reflect their functional roles, as shown for lymphoid (a), myeloid / erythroid (b), stromal (c) and tissue-invariant (d) components. eh, Top-scoring transcription factor (TF) genes per DHS component reflect their functional roles, as shown for placental (e), cardiac (f), digestive (g) and organ developmental/renal (h) components. Full gene regulatory landscapes used for labelling are shown, with GENCODE gene annotations, meta-DNase overlay track, and DHSs. i, Examples of component-annotated genes with discordant expression patterns. Coloured squares next to gene names indicate relevant components, in this particular case discordant with cell and tissue types with maximal expression.
Extended Data Fig. 8
Extended Data Fig. 8. Annotation of genes with unknown function and pathways.
ac, Two-dimensional projection coordinates generated using t-SNE on all genes significantly associated with a DHS component and shown selectively for subsets of gene categories, namely transcription factors (TFs; diamonds: ZNF TF genes) (a), lincRNA genes (b) and pseudo-genes (c). Indicated are the number of labelled genes in each combination of gene category and DHS component. Examples of labelled genes are shown as follows. a, Regulatory landscape of ZNF331; a poorly annotated zinc-finger (ZNF) TF gene (lymphoid and placental components). b, Regulatory landscape of BANCR; a long intergenic non-coding RNA (lincRNA) gene, recently associated with cardiomyocyte migration. c, Regulatory landscape of the pseudo-gene IGHGP (lymphoid component). d, DHS component labelling of MSigDB canonical pathways, through the regulatory landscapes of constituent genes. Shown are pathways with a significant association (5% FDR) and an observed/expected ratio of at least 2. The most strongly associated components are indicated for each pathway, with their source databases. e, Examples of three component-associated pathways from the KEGG database, with genes coloured according to their majority component.
Extended Data Fig. 9
Extended Data Fig. 9. GWAS trait associations of DHS components.
ac, Quantitative association of component-DHSs with GWAS traits reticulocyte count, pulse rate, and FEV1/FVC ratio. Canonical genome-wide significance threshold indicated (5 × 10⁻⁸). a, Enrichment ratios for increasingly stringent subsets of variants, per DHS component. b, Nominal enrichment −log10(P value) of a one-sided binomial test for each DHS component. c, Nominal enrichment -log10(p-value) of a one-sided binomial test for the strongest DHS component only, along with its strongest associated biosamples. d, GWAS traits associated with component-annotated index DHSs. e, Greyscale values, heritability enrichment levels for statistically significant (FDR 1%) traits based on the full delineated width of index DHSs (left) and restricted to index DHS ‘core’ regions (right). Row labelled as per d. f, Ratio of heritability enrichment values for ‘core’ versus ‘full size’ DHSs. g, DHS confidence scores (mean signal) stratified according to gene landscape DHS types. Boxes denote medians and interquartile ranges (IQRs, 25–75%), whiskers represent 1.5 x IQRs, n = 261 GWAS traits. h, Heritability enrichments stratified according to gene landscape DHS types. Greyscale indicates heritability enrichment levels for statistically significant associations (1% FDR).
Extended Data Fig. 10
Extended Data Fig. 10. Extendability of the DHS annotation framework.
a, Two-dimensional UMAP projection of 733 biosamples by way of their index DHS utilization, coloured by their strongest representative NMF component. Stars indicate the embeddings of 38 previously unseen immune-related DNase-seq peak call datasets. b, Area under precision recall curve (AUPRC) values for predicting per-biosample DHSs from DNase-seq signal alone, shown for a trophoblast biosample. c, AUPRC values for the matching trophoblast versus all other 732 biosamples. d, Top 20 biosamples matching the aforementioned trophoblast biosample in terms of AUPRC values. e, Top 20 biosamples (out of 733) matching an unseen CD4+ biosample in terms of AUPRC values.

References

    1. Gross, D. S. & Garrard, W. T. Nuclease hypersensitive sites in chromatin. Annu. Rev. Biochem. 57, 159–197 (1988). - PubMed
    1. McGhee, J. D., Wood, W. I., Dolan, M., Engel, J. D. & Felsenfeld, G. A 200 base pair region at the 5′ end of the chicken adult β-globin gene is accessible to nuclease digestion. Cell27, 45–55 (1981). - PubMed
    1. Mills, F. C., Fisher, L. M., Kuroda, R., Ford, A. M. & Gould, H. J. DNase I hypersensitive sites in the chromatin of human μ immunoglobulin heavy-chain genes. Nature306, 809–812 (1983). - PubMed
    1. Chung, J. H., Whiteley, M. & Felsenfeld, G. A 5′ element of the chicken β-globin domain serves as an insulator in human erythroid cells and protects against position effect in Drosophila. Cell74, 505–514 (1993). - PubMed
    1. Li, Q., Peterson, K. R., Fang, X. & Stamatoyannopoulos, G. Locus control regions. Blood100, 3077–3086 (2002). - PMC - PubMed

Publication types