. 2020 Jul;583(7818):752-759.
doi: 10.1038/s41586-020-2119-x. Epub 2020 Jul 29.

Spatiotemporal DNA methylome dynamics of the developing mouse fetus

Affiliations

Spatiotemporal DNA methylome dynamics of the developing mouse fetus

Yupeng He et al. Nature. 2020 Jul.

Abstract

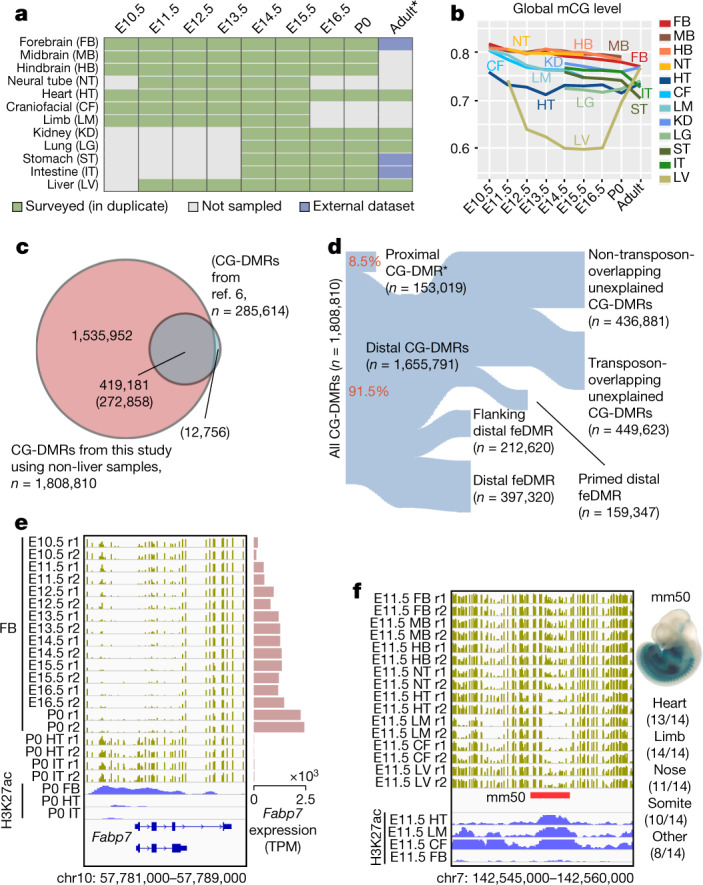
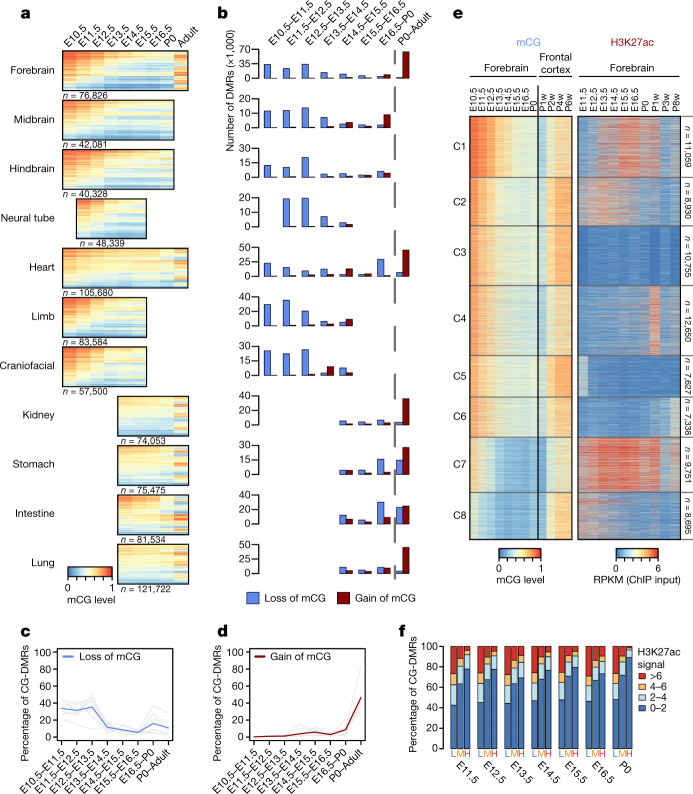
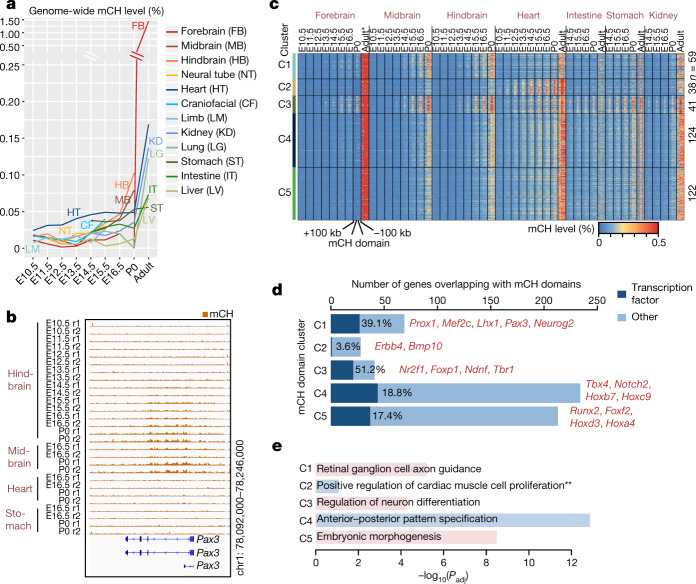
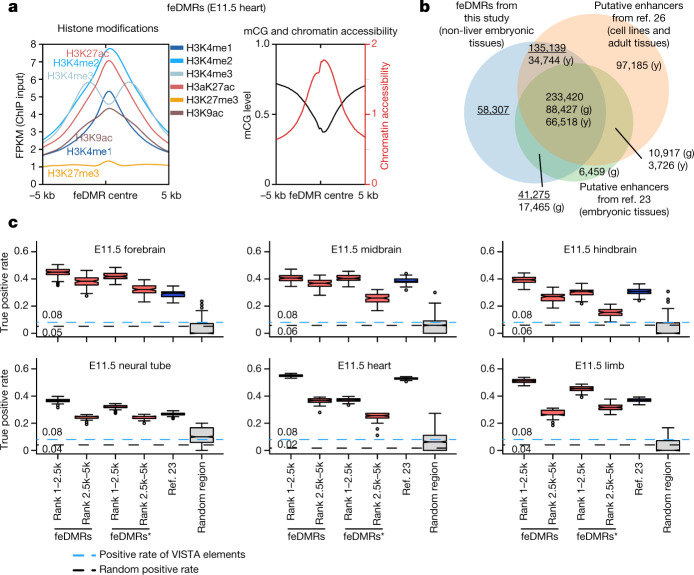
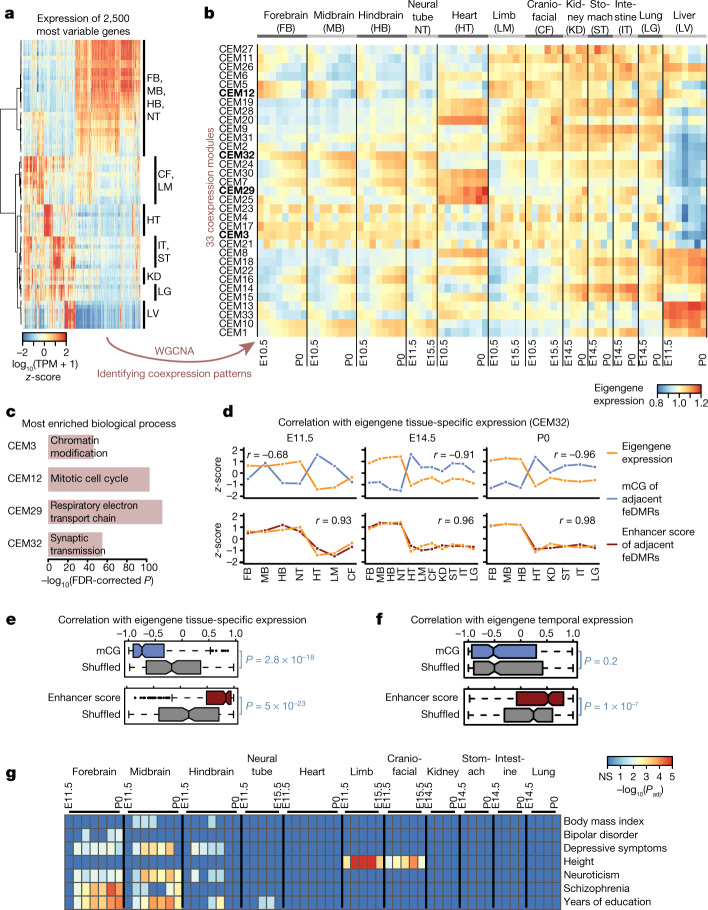
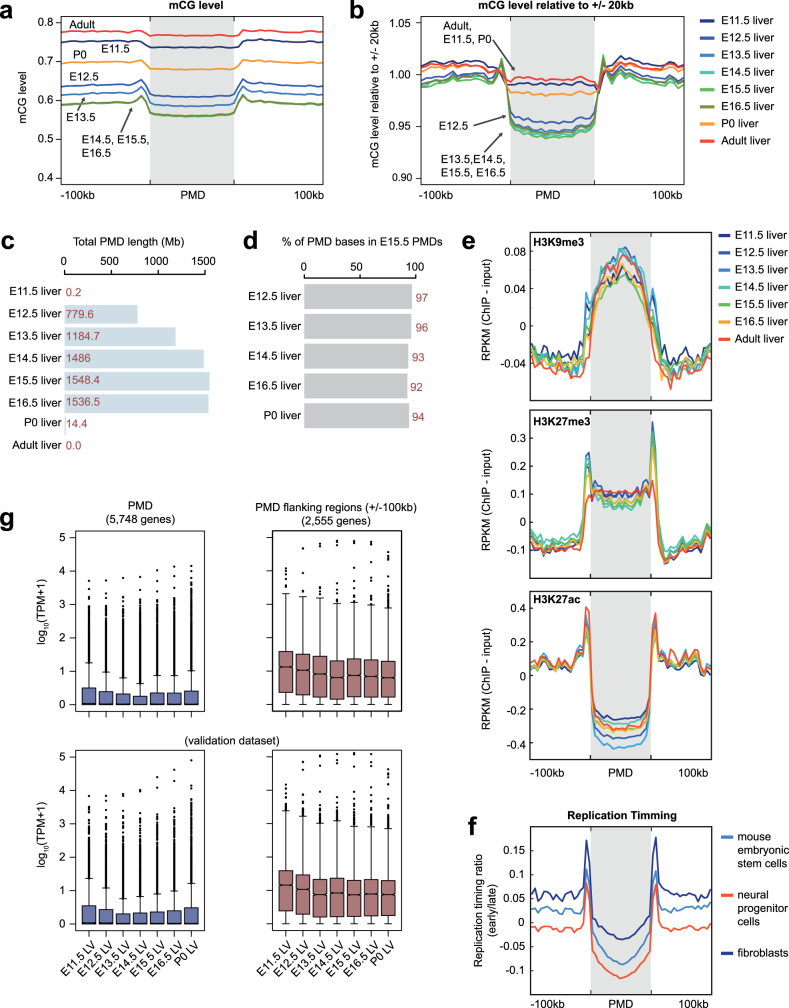
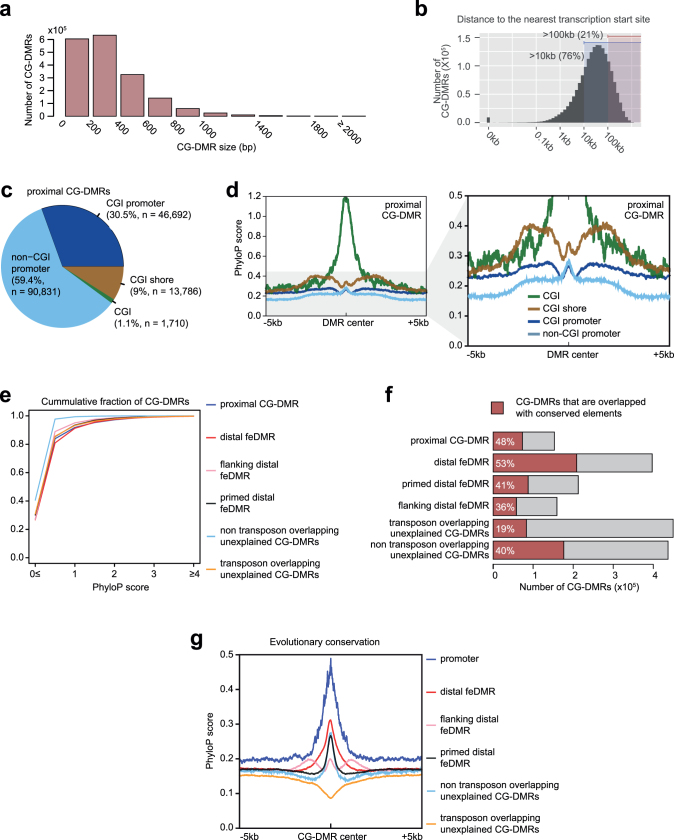
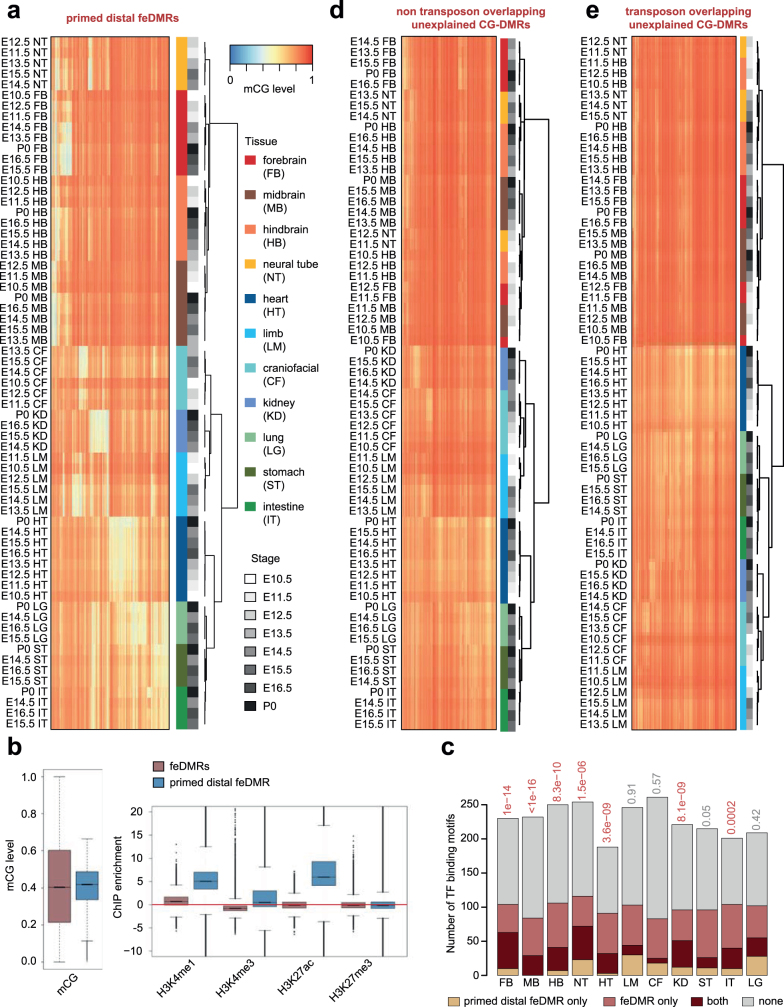
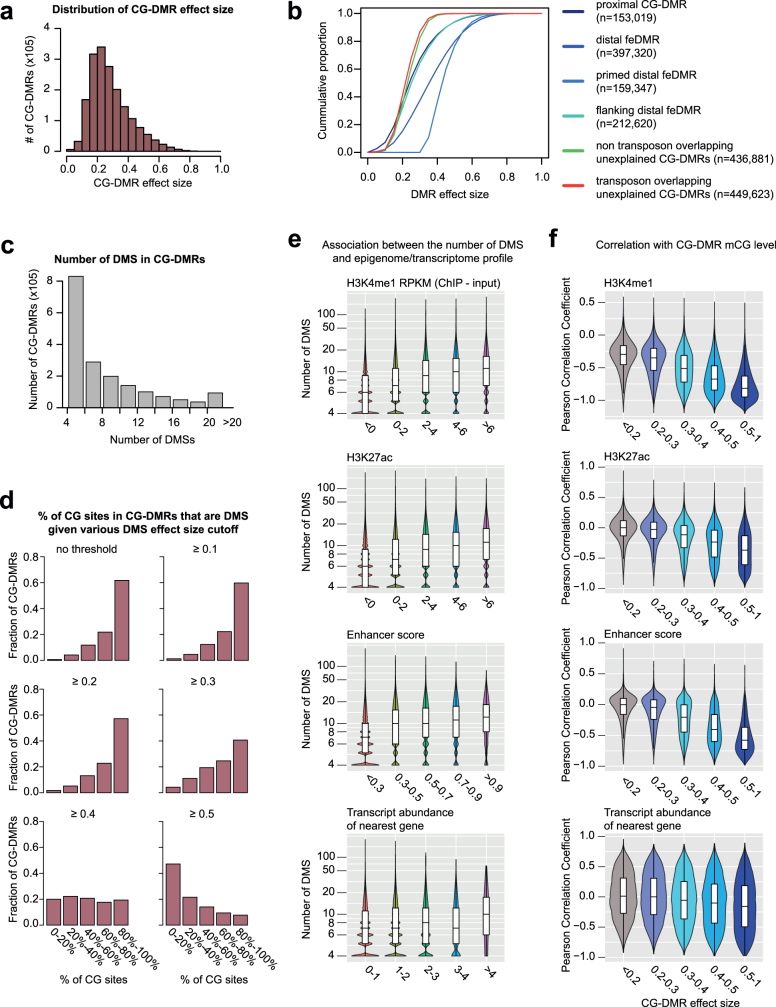
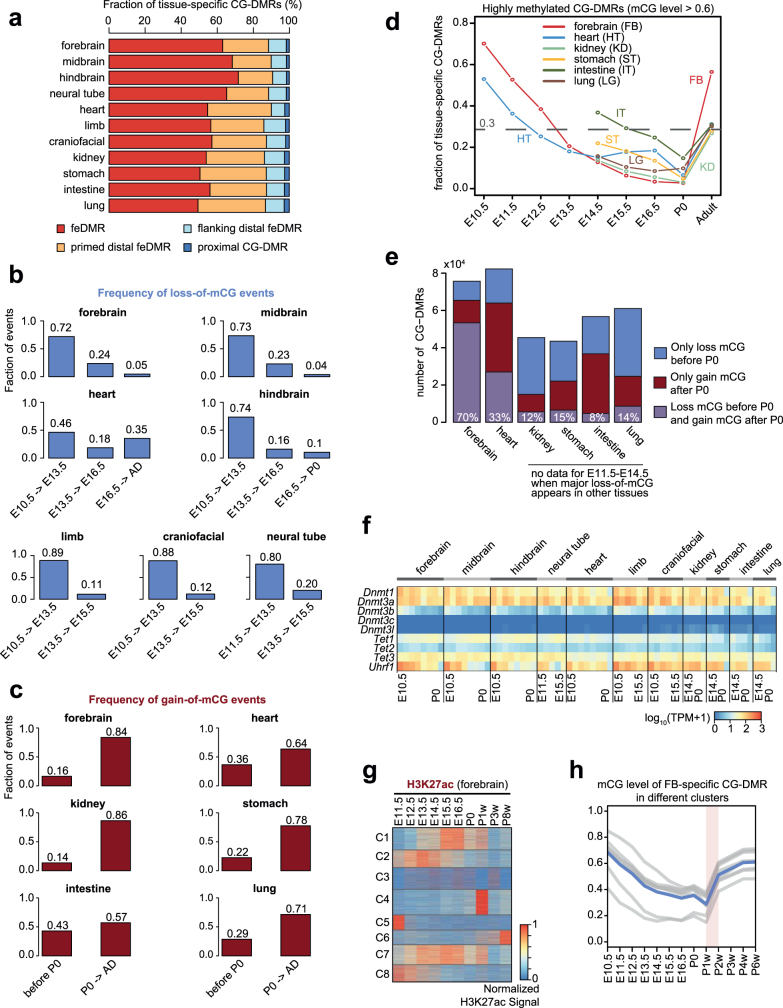
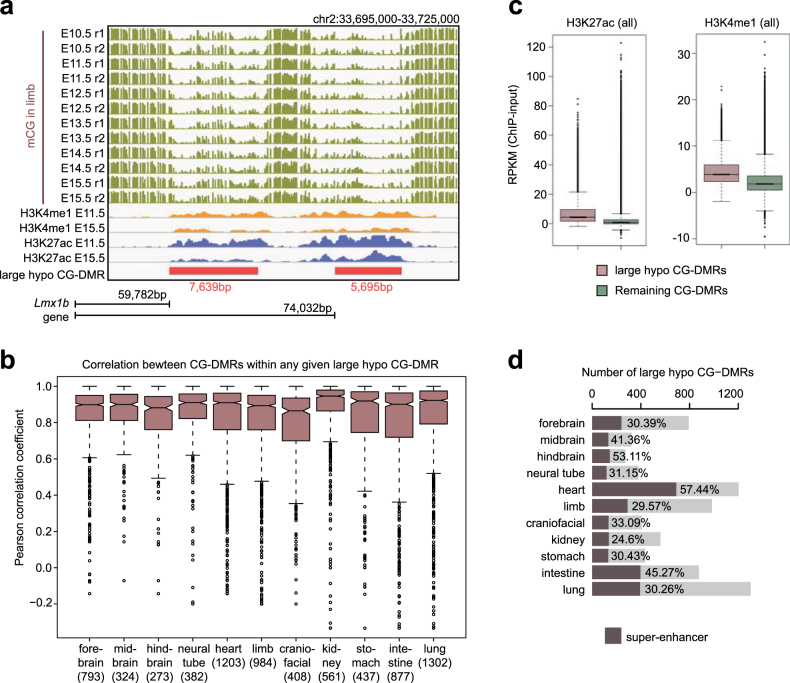
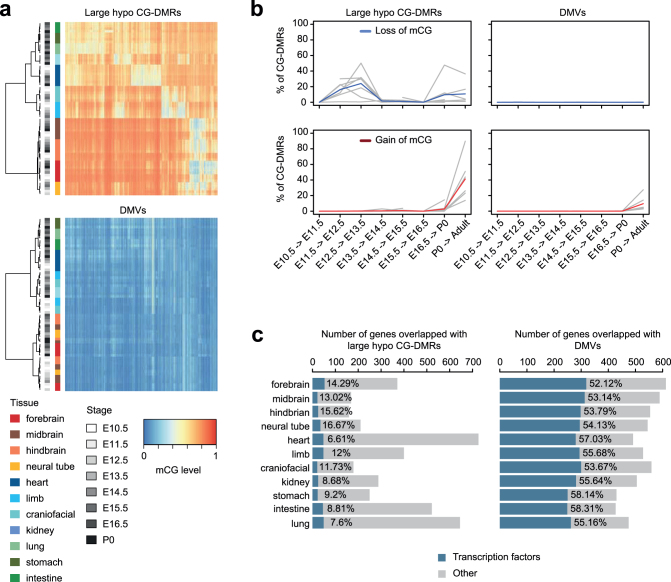
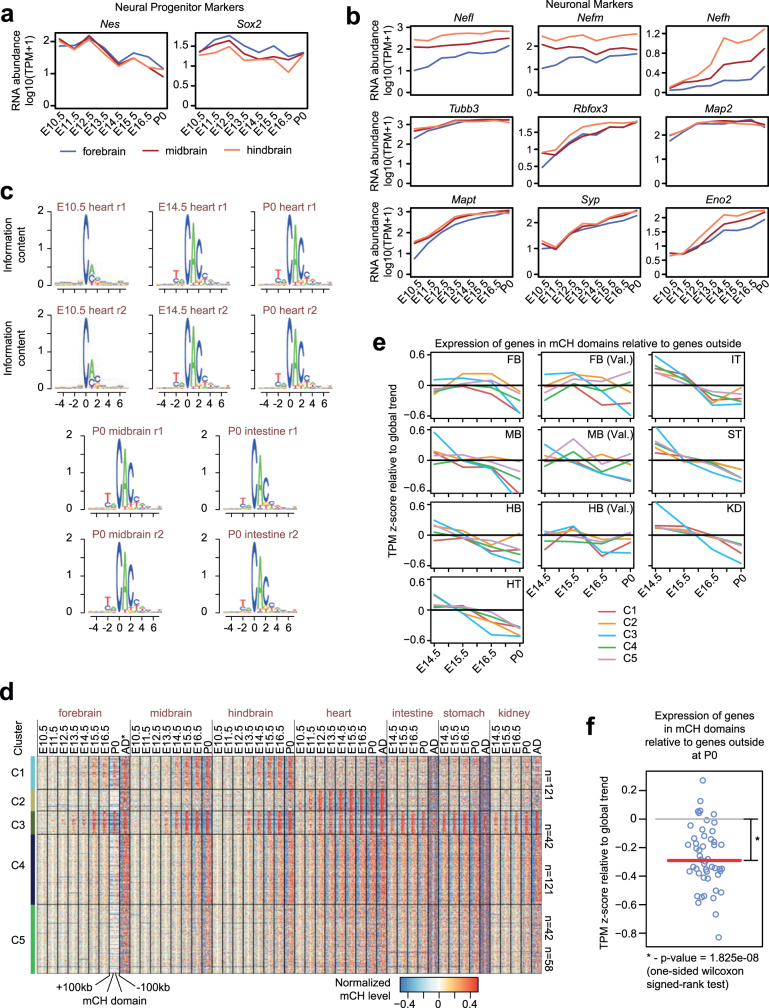
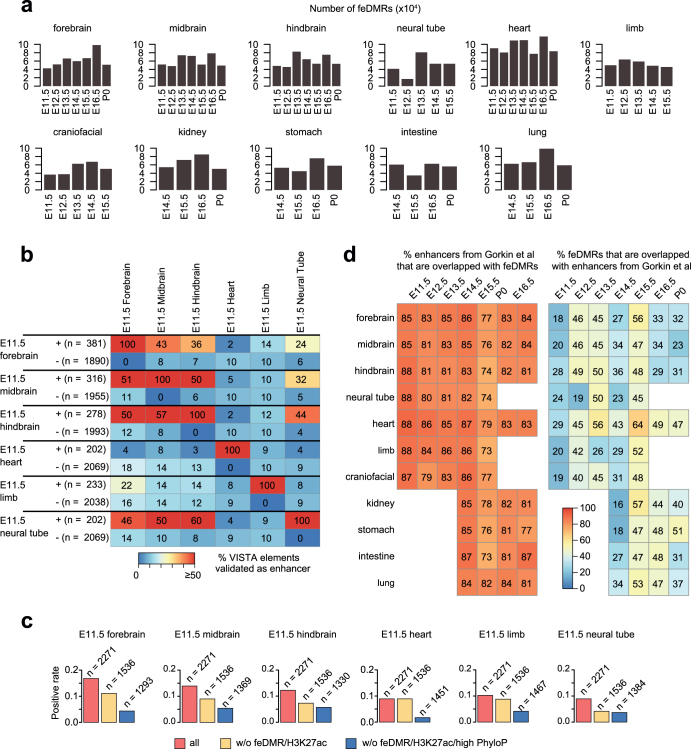
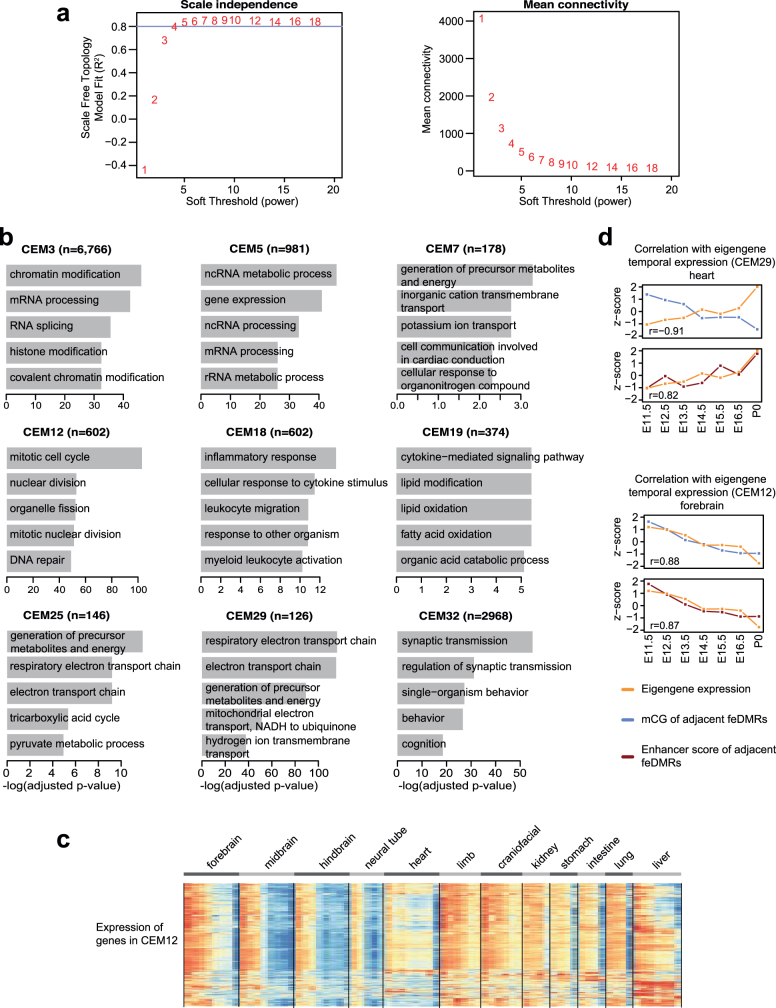
Cytosine DNA methylation is essential for mammalian development but understanding of its spatiotemporal distribution in the developing embryo remains limited1,2. Here, as part of the mouse Encyclopedia of DNA Elements (ENCODE) project, we profiled 168 methylomes from 12 mouse tissues or organs at 9 developmental stages from embryogenesis to adulthood. We identified 1,808,810 genomic regions that showed variations in CG methylation by comparing the methylomes of different tissues or organs from different developmental stages. These DNA elements predominantly lose CG methylation during fetal development, whereas the trend is reversed after birth. During late stages of fetal development, non-CG methylation accumulated within the bodies of key developmental transcription factor genes, coinciding with their transcriptional repression. Integration of genome-wide DNA methylation, histone modification and chromatin accessibility data enabled us to predict 461,141 putative developmental tissue-specific enhancers, the human orthologues of which were enriched for disease-associated genetic variants. These spatiotemporal epigenome maps provide a resource for studies of gene regulation during tissue or organ progression, and a starting point for investigating regulatory elements that are involved in human developmental disorders.


Conflict of interest statement

B.R. is a co-founder and shareholder of Arima Genomics, Inc. The other authors declare no competing interests.

Figures

Fig. 1
Fig. 1. Annotation of methylation variable regulatory elements in developing mouse tissues.
a, Tissue samples (green) profiled in this study. Blue cells indicate published data, grey cells indicate tissues and stages that were not sampled because either the organ is not yet formed or it was not possible to obtain sufficient material for the experiment, or the tissue was too heterogeneous to obtain informative data. *Additional data were generated in duplicate for adult tissues. b, Global mCG level of each tissue across their developmental trajectories. The adult forebrain was approximated using postnatal six-week-old frontal cortex. c, Fetal CG-DMRs identified in this study encompass the majority of the adult CG-DMRs from a previous study. Numbers with and without parentheses are related to fetal CG-DMRs and adult CG-DMRs, respectively. d, Categorization of CG-DMRs. Proximal CG-DMRs are those that overlap with promoters, CGIs or CGI shores. The rest are distal CG-DMRs. Fetal enhancer-linked CG-DMRs (feDMRs) are those that are predicted to be putative enhancers; those within 1 kb of distal feDMRs are flanking distal feDMRs. The remaining distal CG-DMRs showing hypomethylation are primed distal feDMRs. The rest are unexplained distal CG-DMRs, the functions of which are unknown, and they are further stratified according to their overlap with transposons (Methods). *Proximal CG-DMRs include 70,821 proximal feDMRs. e, mCG, H3K27ac and expression dynamics of Fabp7. Gold ticks represent CG sites; height represents mCG level, ranging from 0 to 1. The bottom three tracks show input-normalized H3K27ac enrichment in reads per kilobase per million mapped reads (RPKM), ranging from 0 to 20. Fabp7 expression in transcripts per million mapped reads (TPM) is shown on the right. f, mCG and H3K27ac profiles near an experimentally validated enhancer from the VISTA enhancer data set. The data on the right show the number of embryos in which the enhancer element (ID in VISTA: mm50) was active in a given tissue (out of a total n = 14 embryos). The image shows the tissue where the tested enhancer was active in one representative embryo. r1 and r2 denote first and second replicate, respectively.
Fig. 2
Fig. 2. Tissue-specific CG-DMRs undergo continuous demethylation during embryogenesis and remethylation after birth.
a, mCG levels of tissue-specific CG-DMRs. The adult forebrain was approximated using postnatal six-week-old frontal cortex. Each row of the heatmaps represents an individual CG-DMR. b, The numbers of loss-of-mCG (blue) and gain-of-mCG (red) events in tissue-specific CG-DMRs for each developmental period (tissues aligned with a). c, d, Percentage of tissue-specific CG-DMRs that undergo loss of mCG (c) or gain of mCG (d) at each developmental period. Grey lines show the data for each non-liver tissue, and the blue or red line shows the mean. e, mCG and H3K27ac dynamics of forebrain-specific CG-DMRs. f, Relationship between mCG and H3K27ac in tissue-specific CG-DMRs. For each tissue type, tissue-specific CG-DMRs were grouped by their mCG level into low (L, mCG level ≤ 0.2), medium (M, 0.2 < mCG level ≤ 0.6) or high (H, mCG level > 0.6). Then, we quantified the fraction of tissue-specific CG-DMRs in each category that showed different levels of H3K27ac enrichment (Methods).
Fig. 3
Fig. 3. mCH accumulation predicts reduced gene expression.
a, Global mCH level dynamics for each tissue. b, Pax3-overlapping mCH domain. c, mCH domain clustering based on mCH dynamics. *The adult forebrain was approximated using postnatal six-week-old frontal cortex. d, mCH domain genes. Dark blue bars represent genes that encode TFs and examples are listed. e, The most enriched biological process terms from EnrichR for mCH domain genes. P values were calculated using one-tailed Fisher’s exact test with sample sizes of 69, 28, 41, 234 and 213 for C1, C2, C3, C4 and C5, respectively. P values were adjusted (Padj) for multiple testing correction using the Benjamini–Hochberg method. **Padj = 0.082.
Fig. 4
Fig. 4. Enhancer annotation of developing mouse tissues.
a, Chromatin signatures of feDMRs in E11.5 heart. The aggregate plots show the average histone modifications (left) and chromatin accessibility and mCG profiles (right) of ±5-kb regions flanking the feDMR centres. b, The overlap between feDMRs, adult enhancers from ref. , and putative enhancers from ref. . The letter in parenthesis indicates the enhancer set from which the number is calculated. g and y, putative enhancers from ref. and ref. , respectively. Numbers related to feDMRs are underlined. c, True positive rate of putative enhancers on 100 down-sampled VISTA data sets in each E11.5 tissue for (from left to right): top 1–2,500 and 2,501–5,000 feDMRs; *top 1–2,500 and 2,501–5,000 feDMRs that do not overlap with the putative enhancers from ref. ; top 1–2,500 putative enhancers from ref. (blue); and random region (grey). The sample size is 1,000 for random region and 100 for all others. Random region indicates ten sets of randomly selected genomic regions with GC density and evolutionary conservation matching the top 5,000 feDMRs. Blue dashed line shows the fraction of elements that are experimentally validated enhancers (positives) in the dataset that is downsampled to match the estimated abundance of enhancers (see Supplementary Note 4 for details). Black dashed line indicates the random positive rate. Middle line, median; box, upper and lower quartiles; whiskers, 1.5 × (Q3 − Q1) above Q3 and below Q1; points, outliers.
Fig. 5
Fig. 5. Association between mCG, gene expression and disease-associated SNPs.
a, Expression profiles for 2,500 of the most variable genes. b, Thirty-three CEMs identified by WGCNA and their eigengene expression. CEMs shown in bold are related to c. c, The most enriched biological process terms of genes in four representative CEMs using EnrichR. P values based on one-tailed Fisher’s exact test with sample sizes 6,766, 602, 126 and 2,968 for CEM3, CEM12, CEM29 and CEM32, respectively, adjusted for multiple testing correction using the Benjamini–Hochberg method. d, Correlation of the tissue-specific eigengene expression (orange) for each developmental stage with the mCG level or enhancer score (blue or red, respectively) z-scores of feDMRs linked to the genes in CEM32. Pearson correlation coefficients were calculated (n = 7, 11 and 8 for E11.5, E14.5 and P0, respectively). e, f, Pearson correlation coefficients of mCG level or enhancer score (blue or red, respectively) of feDMRs linked to the genes in each CEM with tissue-specific eigengene expression across all 33 CEMs on all stages (e), and temporal epigengene expression across all CEMs in all tissue types (f), excluding liver. P values based on two-tailed Mann–Whitney test (n = 231 (e), n = 363 (f)). Middle line, median; box, upper and lower quartiles; whiskers, 1.5 × (Q3 − Q1) above Q3 and below Q1; points, outliers. g, feDMRs are enriched for human GWAS SNPs associated with tissue- or organ-specific functions and tissue-related disease states. P values calculated using LD score regression, adjusted for multiple testing correction using the Benjamini–Hochberg approach.
Extended Data Fig. 1
Extended Data Fig. 1. Global hypomethylation in fetal liver.
a, Average mCG level of PMDs and flanking regions (±100 kb) in liver samples from different developmental stages. b, Normalized average mCG level of PMDs and flanking regions in liver samples. The mCG level was normalized (scaled) such that the average mCG level of ±20-kb regions around each PMD is 1.0. c, The total bases that PMDs encompass in liver at different developmental stages. d, Percentage of bases in PMDs identified in each of the liver samples (E12.5 liver, E13.5 liver and so on) that are also within PMDs identified in E15.5 liver sample. e, Histone modification profiles for H3K9me3 (top), H3K27me3 (middle) and H3K27ac (bottom) within PMDs and flanking regions (±100 kb) in liver samples from different developmental stages. f, Replication timing profiling of PMDs and flanking regions (±100 kb). The values indicate the tendency to be replicated at an earlier stage in the cell cycle. g, Expression of genes that overlap PMDs and flanking regions (±100 kb) (left) compared with those with no PMD overlap (right). Two plots below show data from a validation data set, containing RNA-seq data generated using a different protocol on matched tissues. Middle line, median; box, upper and lower quartiles; whiskers, 1.5 × (Q3 − Q1) above Q3 and below Q1; points, outliers.
Extended Data Fig. 2
Extended Data Fig. 2. Categorization of CG-DMRs.
a, CG-DMR size distribution. b, Distance from CG-DMRs to the nearest TSSs. c, Genomic distribution of proximal CG-DMRs. d, Evolutionary conservation of proximal CG-DMRs that overlap with CGIs, CGI shores, CGI promoters and non-CGI promoters. PhyloP score was used to measure the degree of conservation. e, Cumulative distribution of conservation score of CG-DMRs in different categories. f, Fraction of CG-DMRs in different categories that overlap with PhastCons conserved elements (Methods). g, Conservation (PhyloP) scores of promoters and different categories of distal CG-DMRs and flanking regions (±5 kb).
Extended Data Fig. 3
Extended Data Fig. 3. Characterization of primed distal feDMRs and unxDMRs.
a, mCG level of all primed distal feDMRs in all non-liver tissues. Each row in the heatmap is one tissue sample and each column corresponds to one primed distal feDMR. Both rows and columns were clustered using hierarchical clustering. Coloured bars indicate tissue types and grey bars indicate developmental stages of samples. b, mCG (left) and histone modification (right) signatures of primed distal feDMRs (blue; n = 618,786) and feDMRs (red; n = 3,715,052). The boxplots were generated using ‘boxplot’ function in R (3.3.1) and show the median and quartiles of the values in all non-liver tissues. Middle line, median; box, upper and lower quartiles; whiskers, 1.5 × (Q3 − Q1) above Q3 and below Q1; points, outliers. c, Number of enriched TF binding motifs only in feDMRs (red), only in primed distal feDMRs (orange), both (dark red) and none (grey). Only the motifs linked to expressed TFs (TPM ≥ 10) were included. Hypergeometric test was used to estimate the significance of overlap between motifs enriched in feDMRs and ones enriched in primed distal feDMRs. d, e, Similar to a, heatmaps showing the mCG levels of unxDMRs, including transposon overlapping unxDMRs (d) and non-transposon overlapping unxDMRs (e).
Extended Data Fig. 4
Extended Data Fig. 4. CG-DMR effect size analysis.
a, Distribution of CG-DMR effect sizes. b, Cumulative distribution of CG-DMR effect sizes for CG-DMRs in different categories. c, Distribution of the number of DMSs in CG-DMRs. d, Fraction of CG sites in CG-DMRs that are DMSs given different DMS effect-size cutoffs. e, Number of DMSs in CG-DMRs with different H3K4me1 enrichment, H3K27ac enrichment, enhancer score (from REPTILE), and RNA abundance (log10(TPM + 1)) of the nearest genes with TSSs that are within 5 kb of CG-DMRs. The value was calculated in the most hypomethylated sample of each CG-DMR. The sample size for each violin or box from left to right is 732,389, 626,599, 254,925, 108,012 and 74,277 for H3K4me1, 935,017, 560,213, 136,778, 58,396 and 105,798 for H3K27ac, 1,593,822, 89,797, 70,254, 36,776 and 5,553 for enhancer score, and 1,045,863, 645,080, 98,020, 7,052 and 187 for gene expression. f, Distribution of Pearson correlation coefficient between mCG level and various metrics for CG-DMRs with different effect sizes. The metrics include H3K4me1 enrichment, H3K27ac enrichment, enhancer score (from REPTILE), and transcription (TPM) of nearest genes whose TSSs are within 5 kb of CG-DMRs. The number of CG-DMRs with effect size <0.2, 0.2–0.3, 0.3–0.4, 0.4–0.5 and 0.5–1 are 523,106, 615,414, 347,019, 184,116 and 138,512, respectively. Boxplots and violin plots were generated using ggplot2 (2.2.1) R (3.3.1) package. In the violin plot, width represents the density of different data values. In the boxplots, middle line, median; box, upper and lower quartiles; whiskers, 1.5 × (Q3 − Q1) above Q3 and below Q1; points, outliers.
Extended Data Fig. 5
Extended Data Fig. 5. Link between methylation dynamics and histone modifications at tissue-specific CG-DMRs.
a, Composition of tissue-specific CG-DMRs. b, c, Percentage of loss-of-mCG (b) and gain-of-mCG (c) events for different fetal stage intervals. d, Fraction of tissue-specific CG-DMRs that are heavily CG methylated (mCG level >0.6). e, Number and fraction of tissue-specific CG-DMRs that only gained mCG (mCG level increases by at least 0.1; red) after P0, only lost mCG (mCG level decreases by at least 0.1; blue), and both (purple) in six tissues for which adult methylome data are available. f, RNA abundance of genes involved in DNA methylation pathways, measured in TPM. g, Normalized H3K27ac signals in different clusters. h, Dynamic mCG level of forebrain-specific CG-DMRs. Grey lines, mean methylation levels of CG-DMRs in different clusters; blue line, mean of the mean of each cluster.
Extended Data Fig. 6
Extended Data Fig. 6. Large-scale CG hypomethylation overlaps strongly with super-enhancers.
a, Epigenomic profiles of two limb-specific large hypo CG-DMRs near the Lmx1 gene. Bottom, locations of the two large hypo CG-DMRs relative to Lmx1. b, Correlation between the mCG levels of CG-DMRs within the same large hypo CG-DMR across development stages in the given tissue type. If multiple CG-DMRs are within one large hypo CG-DMR, the mean Pearson correlation coefficient of all pairwise comparisons is reported. Numbers of CG-DMRs are shown in parentheses. c, H3K27ac and H3K4me1 enrichment in large hypo CG-DMRs (red; n = 39,729) and remaining CG-DMRs (green; n = 4,045,384) at all developmental stages across all tissue types except liver. d, Number of large hypo CG-DMRs identified in each tissue type and the percentage that overlap with super-enhancers (red). The boxplots (b, c) were generated using ‘boxplot’ function in R (3.3.1). Middle line, median; box, upper and lower quartiles; whiskers, 1.5 × (Q3 − Q1) above Q3 and below Q1; points, outliers.
Extended Data Fig. 7
Extended Data Fig. 7. Comparing large hypo CG-DMRs and DMVs.
a, mCG level of large hypo CG-DMRs (top) and DMVs (bottom) in all non-liver tissues. Both rows and columns were clustered using hierarchical clustering. Coloured bars indicate tissue types and grey bars indicate developmental stages of samples. The heatmap shows the data of merged large hypo CG-DMRs and DMVs for predictions from all tissue samples. b, Fraction of large hypo CG-DMRs (left) and DMVs (right) that undergo loss of mCG (top) and gain of mCG (bottom) during development. The blue (loss) or red (gain) line shows the aggregated values over all non-liver tissues, whereas the grey lines show the data for each tissue type. c, Number of genes that overlap with large hypo CG-DMRs (left) or DMVs (right). The dark blue bar indicates the number of genes that encode TFs.
Extended Data Fig. 8
Extended Data Fig. 8. Non-CG methylation accumulation in fetal tissues.
a, Expression of the neural progenitor marker genes Nes and Sox2. b, Expression of several neuronal markers from ref. . c, Sequence context preference for non-CG methylation (mCH). d, Grouping mCH domains into five clusters according to the dynamics of methylation accumulation. The heatmap shows normalized methylation levels of mCH domains and flanking genomic regions (±100 kb). mCH in the adult (AD) forebrain was approximated using data from the frontal cortex from six-week-old mice. e, Expression dynamics of genes within mCH domains relative to the other genes. Z-scores were calculated for each gene across development and each line shows the mean value of mCH overlapping genes for each cluster. f, The expression of genes in mCH domains at P0 relative to the expression dynamics of genes outside mCH domains. Each circle corresponds to the value given one mCH domain cluster and one tissue. Red line indicates median, which was tested against 0 using a one-sided Wilcoxon signed-rank test (n = 50).
Extended Data Fig. 9
Extended Data Fig. 9. Fetal-enhancer-linked CG-DMRs.
a, Number of feDMRs predicted in each tissue from each stage. b, Positive rate in E11.5 tissues of elements that were experimentally validated as an enhancer (+) or not (−) in a given E11.5 tissue. Numbers indicate the number of VISTA elements. c, Positive rate (fraction of elements that are experimentally validated as enhancer in a given tissue) of DNA elements in VISTA enhancer browser (left), ones that do not overlap with feDMRs or H3K27ac peaks (middle), and those that do not overlap with feDMRs or H3K27ac peaks and do not show a high evolutionary PhyloP score (right). Numbers in parentheses indicate the number of VISTA elements. d, Left, percentage of putative enhancers from ref. that overlap with feDMRs in each tissue sample. Right, percentage of feDMRs that overlap with putative enhancers from ref. .
Extended Data Fig. 10
Extended Data Fig. 10. WGCNA identification of co-expression modules.
a, The scale-free topology model fit (R2) (top) and the mean connectivity of the coexpression network (bottom) given different soft-thresholding powers. These two plots show how thresholds were chosen for WGCNA. Blue line indicates model fit cutoff (R2 = 0.8). A soft threshold of 5 was chosen to construct the co-expression network because it is the first threshold value at which the model fit is greater than 0.8. b, Top enriched ontology terms of genes in co-expression modules. EnrichR, was used for this analysis, which uses a one-tailed Fisher’s exact test to calculate P values (number of overlapping genes shown in parentheses). The Benjamini–Hochberg method was used to adjust P values for multiple testing correction. c, Expression of genes in CEM12. Each row is a gene in certain module and the TPM z-scores were calculated along each row. d, Similar to Fig. 5d, correlation of temporal eigengene expression for CEM29 (top) and CEM12 (bottom) with the z-scores of average mCG level (top plots) and the z-scores of average enhancer score of neighbouring feDMRs (bottom plots) (Pearson correlation coefficient; n = 7).

References

    1. Reik, W. Stability and flexibility of epigenetic gene regulation in mammalian development. Nature447, 425–432 (2007). - PubMed
    1. Bird, A. DNA methylation patterns and epigenetic memory. Genes Dev. 16, 6–21 (2002). - PubMed
    1. Davidson, E. H. Emerging properties of animal gene regulatory networks. Nature468, 911–920 (2010). - PMC - PubMed
    1. Spitz, F. & Furlong, E. E. M. Transcription factors: from enhancer binding to developmental control. Nat. Rev. Genet. 13, 613–626 (2012). - PubMed
    1. Patel, D. J. & Wang, Z. Readout of epigenetic modifications. Annu. Rev. Biochem. 82, 81–118 (2013). - PMC - PubMed

Publication types

MeSH terms

LinkOut - more resources