. 2020 Jul;583(7818):720-728.
doi: 10.1038/s41586-020-2023-4. Epub 2020 Jul 29.

Occupancy maps of 208 chromatin-associated proteins in one human cell type

Affiliations

Occupancy maps of 208 chromatin-associated proteins in one human cell type

E Christopher Partridge et al. Nature. 2020 Jul.

Abstract

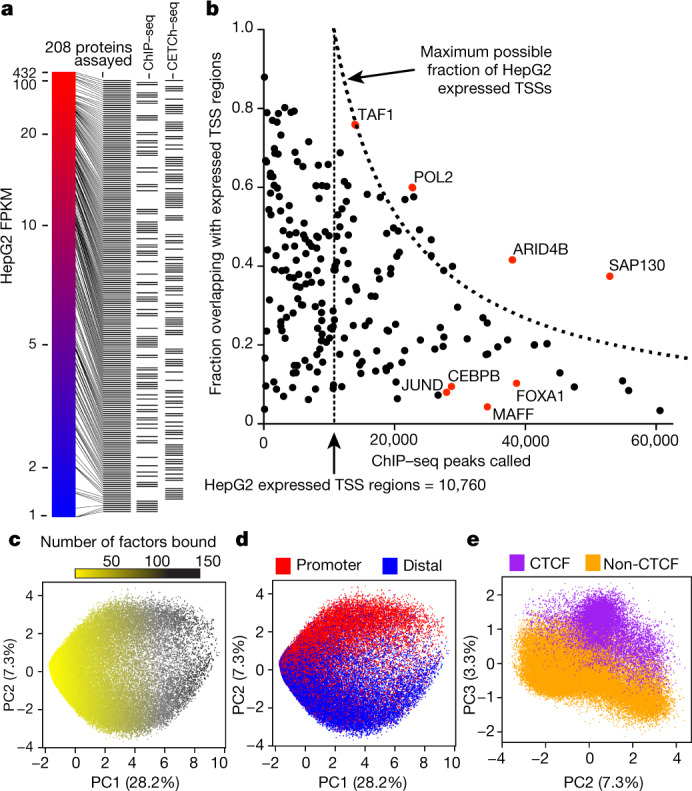
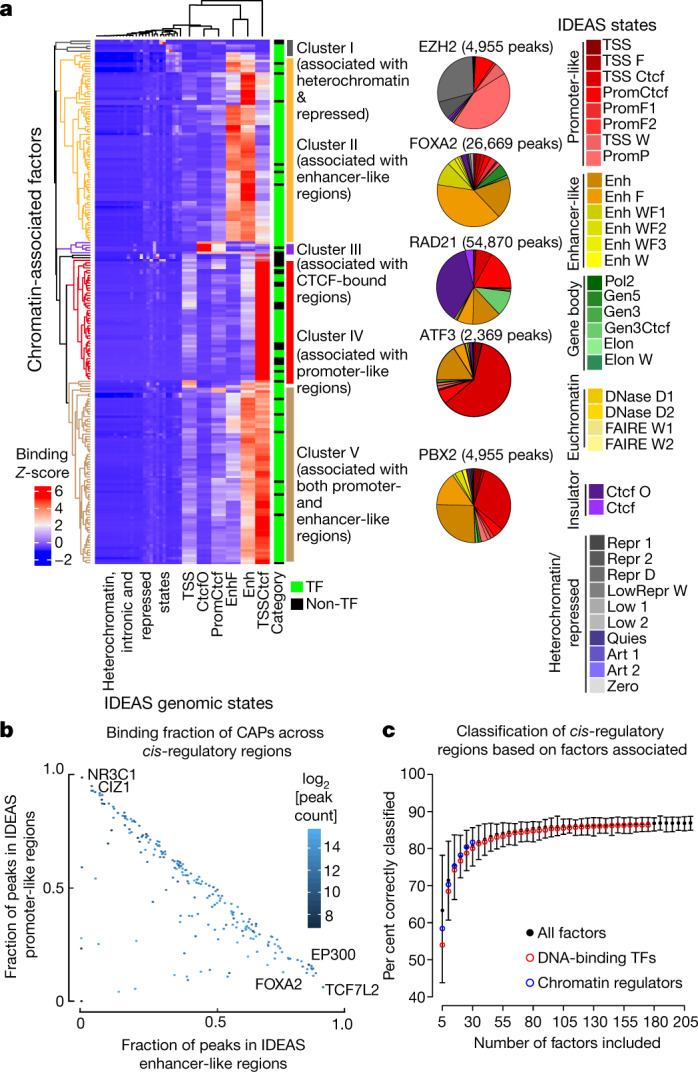
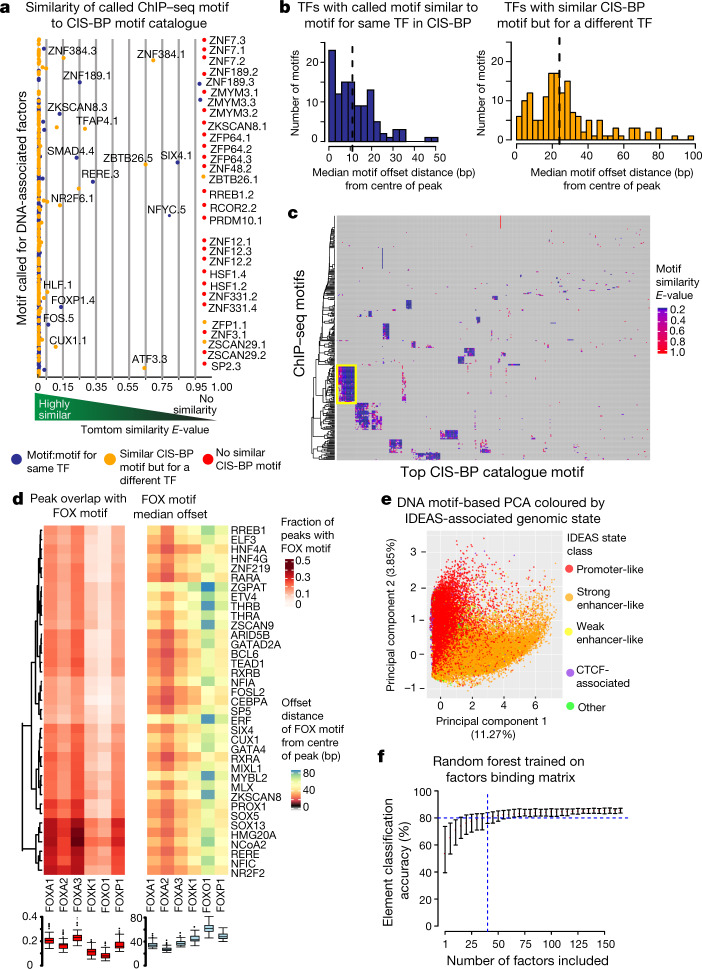
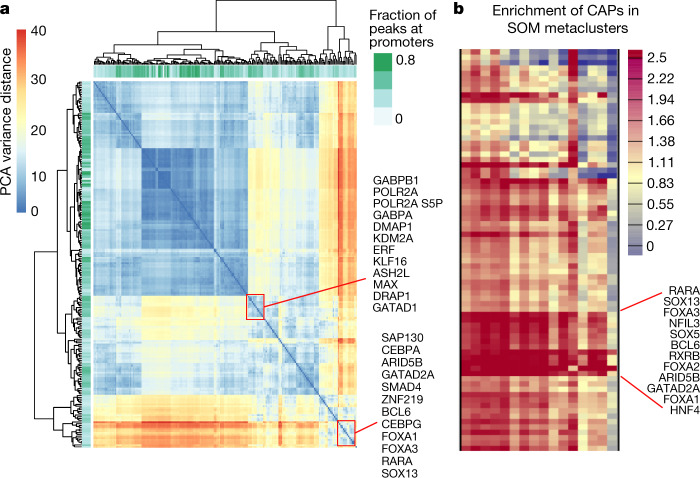
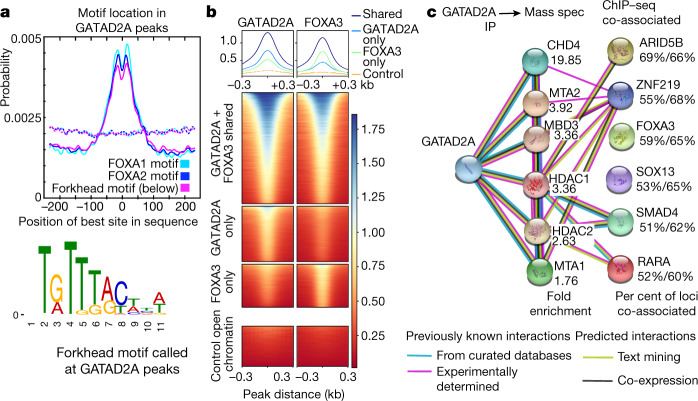
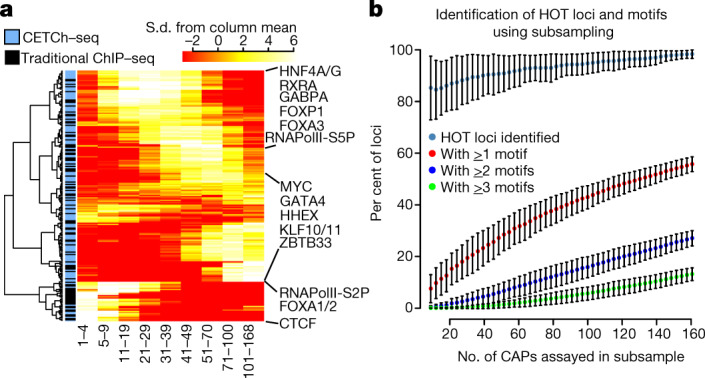
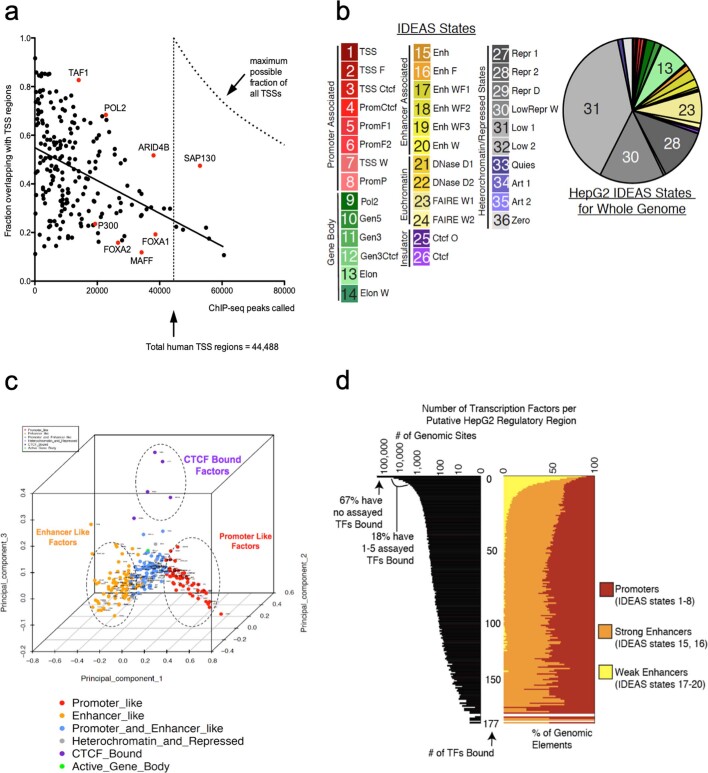
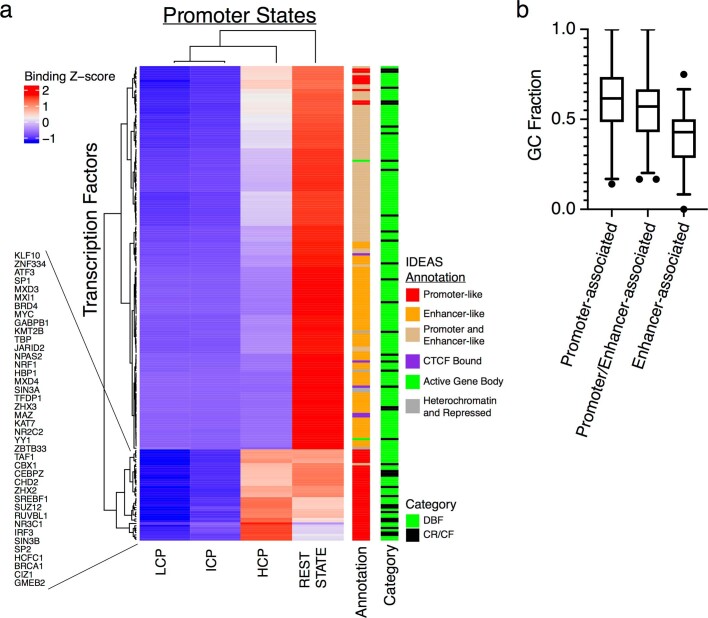
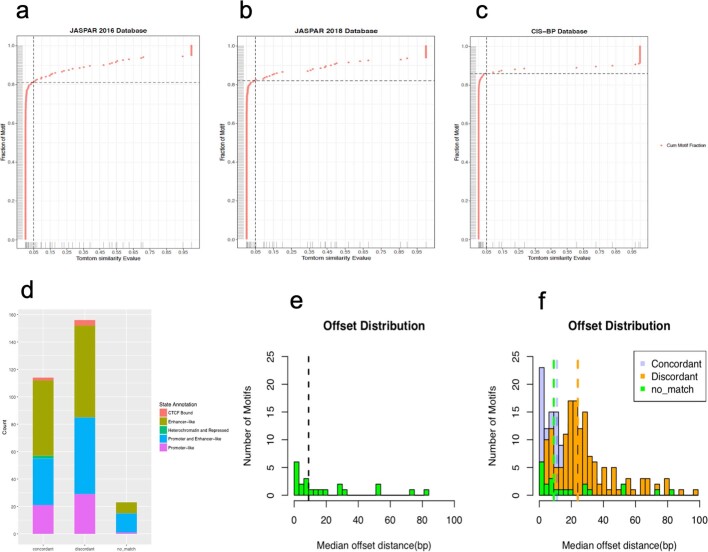
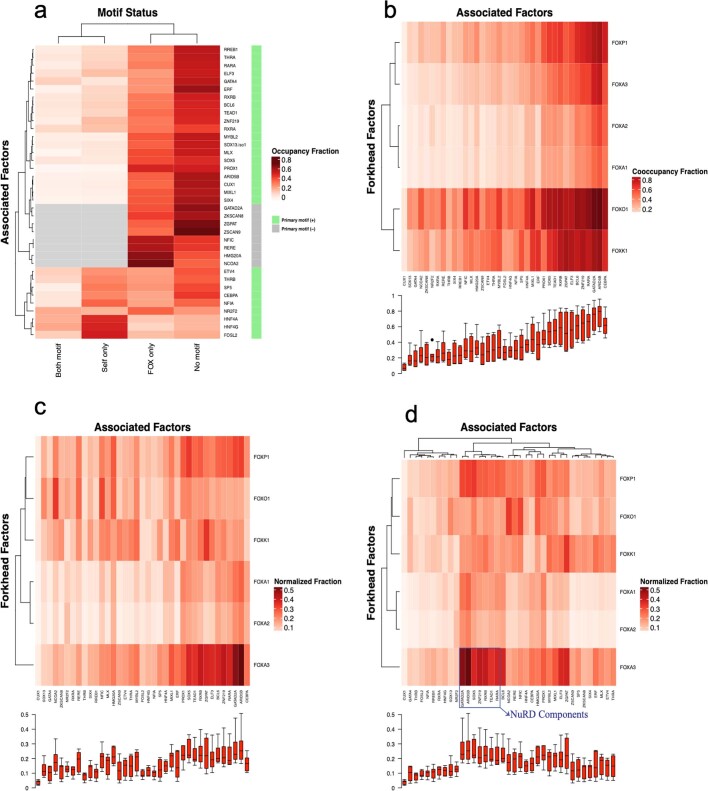
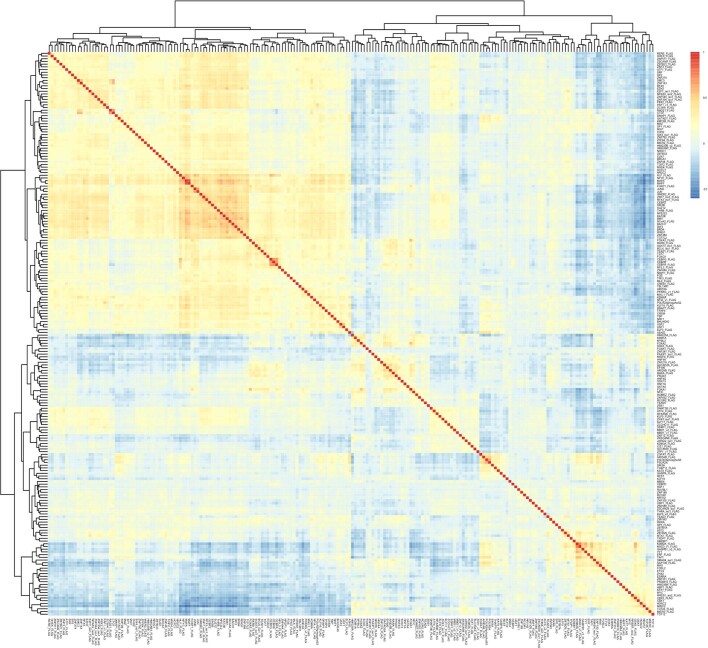
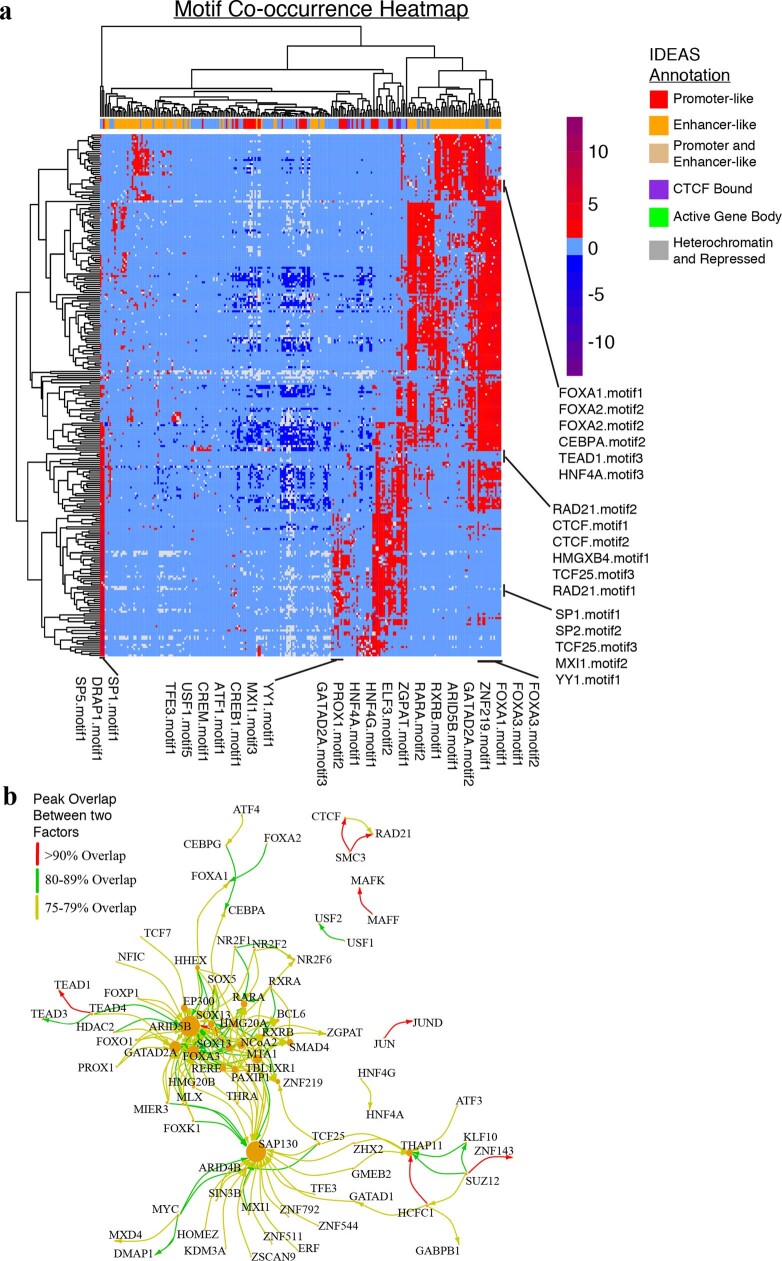
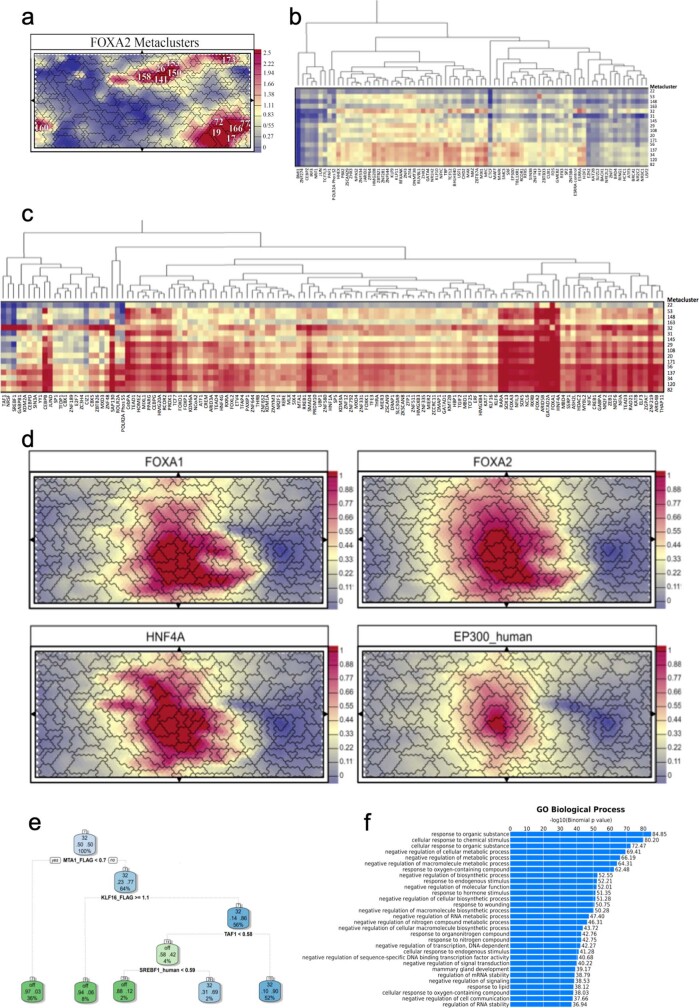
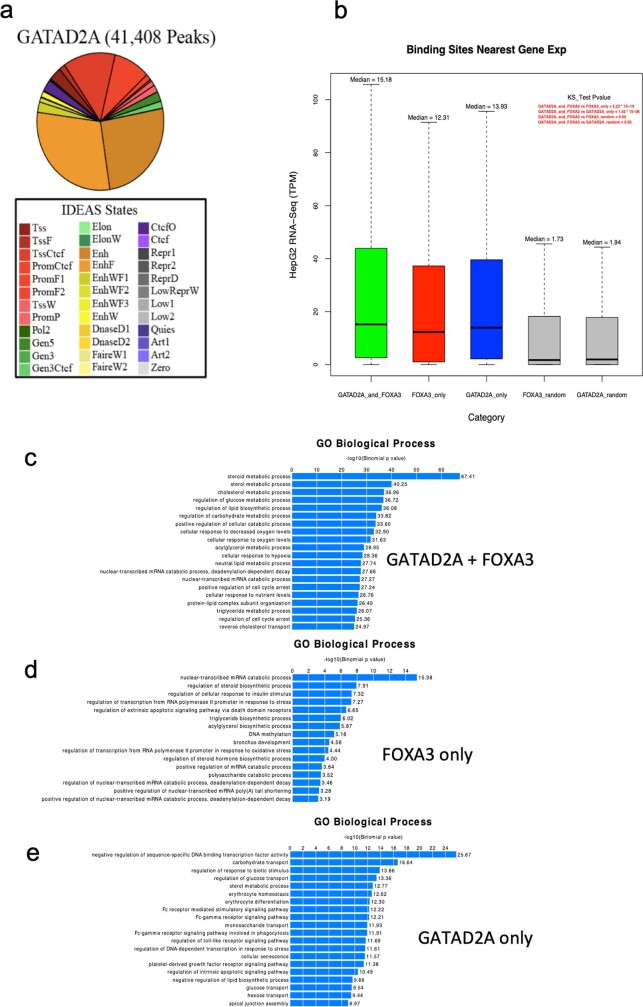
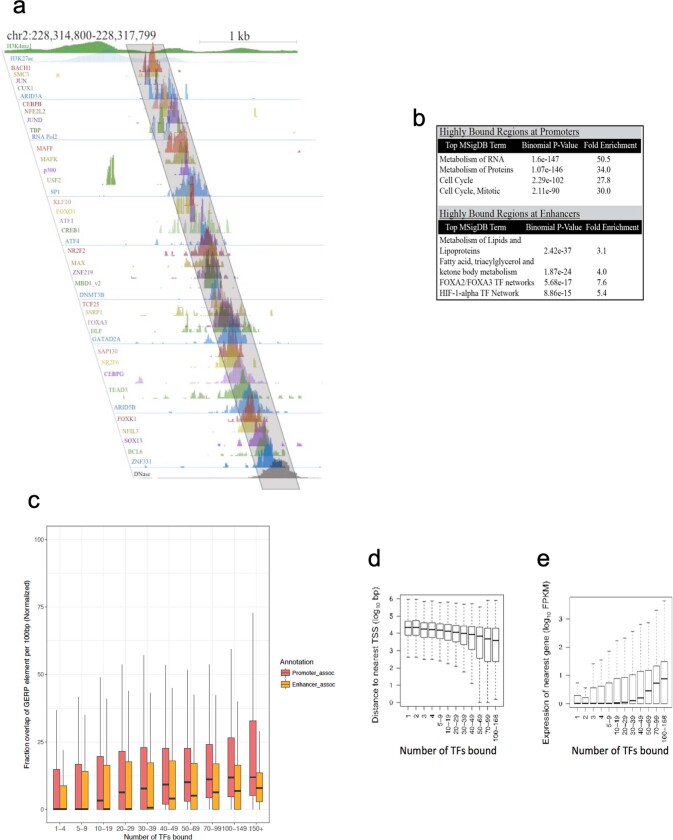
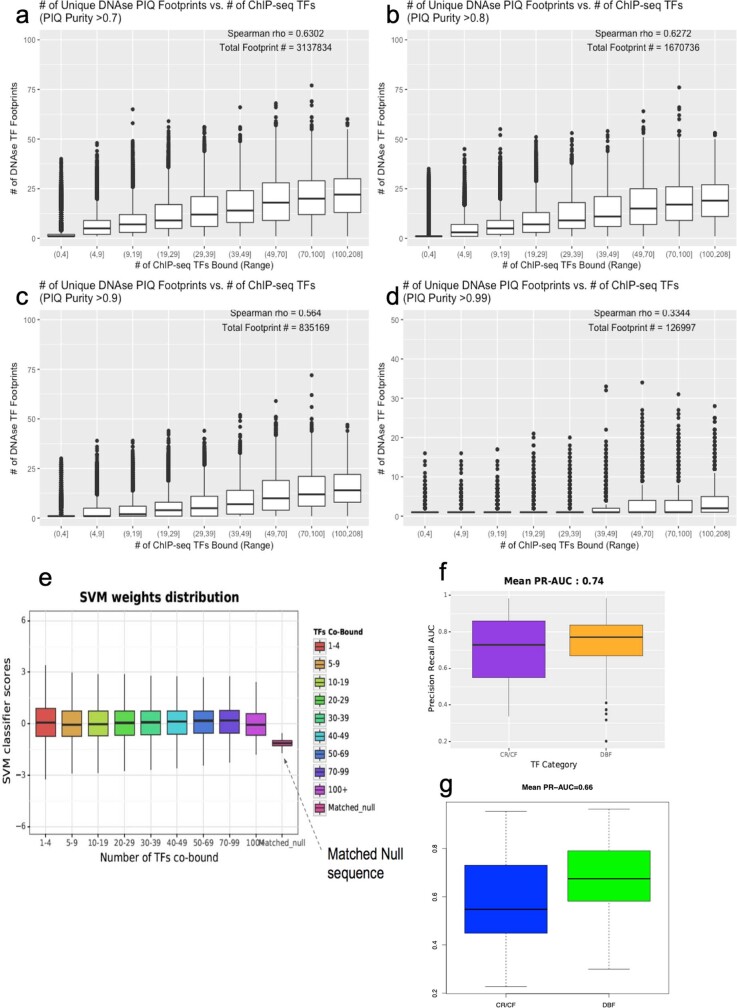
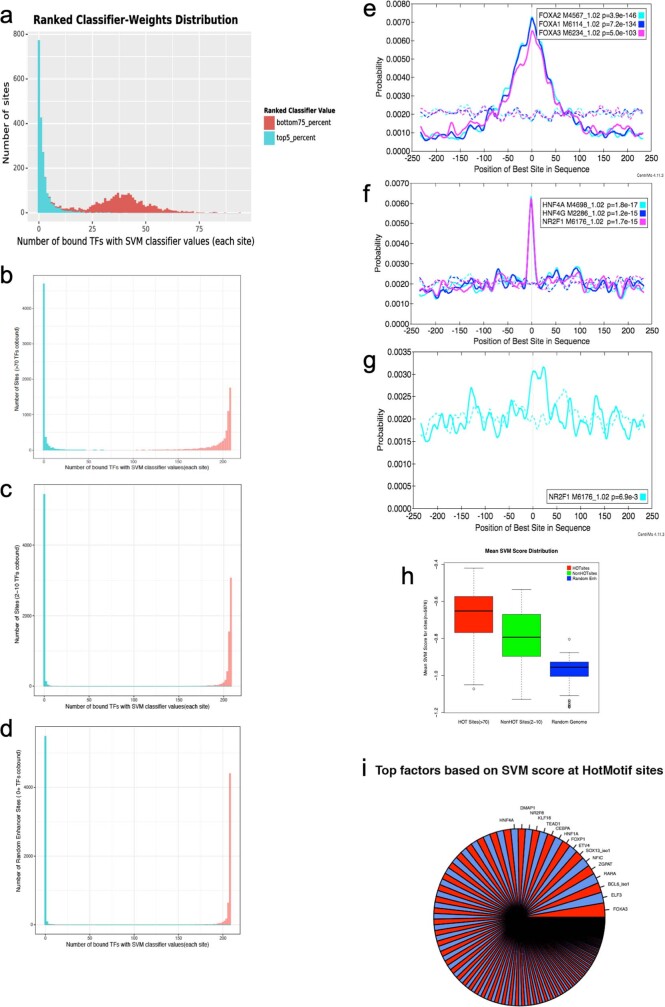
Transcription factors are DNA-binding proteins that have key roles in gene regulation1,2. Genome-wide occupancy maps of transcriptional regulators are important for understanding gene regulation and its effects on diverse biological processes3-6. However, only a minority of the more than 1,600 transcription factors encoded in the human genome has been assayed. Here we present, as part of the ENCODE (Encyclopedia of DNA Elements) project, data and analyses from chromatin immunoprecipitation followed by high-throughput sequencing (ChIP-seq) experiments using the human HepG2 cell line for 208 chromatin-associated proteins (CAPs). These comprise 171 transcription factors and 37 transcriptional cofactors and chromatin regulator proteins, and represent nearly one-quarter of CAPs expressed in HepG2 cells. The binding profiles of these CAPs form major groups associated predominantly with promoters or enhancers, or with both. We confirm and expand the current catalogue of DNA sequence motifs for transcription factors, and describe motifs that correspond to other transcription factors that are co-enriched with the primary ChIP target. For example, FOX family motifs are enriched in ChIP-seq peaks of 37 other CAPs. We show that motif content and occupancy patterns can distinguish between promoters and enhancers. This catalogue reveals high-occupancy target regions at which many CAPs associate, although each contains motifs for only a minority of the numerous associated transcription factors. These analyses provide a more complete overview of the gene regulatory networks that define this cell type, and demonstrate the usefulness of the large-scale production efforts of the ENCODE Consortium.


Conflict of interest statement

The authors declare no competing interests.

Figures

Fig. 1
Fig. 1. Overview and analysis of HepG2 data sets.
a, The 208 chromatin-associated factors assayed in HepG2 cells, organized by expression (FPKM), and denoting whether the factors were assayed by ChIP–seq or CETCh–seq. b, Scatter plot of all 208 factors, showing broad distribution of fraction of called peaks at expressed TSSs (±3 kb from TSS) against total peak number; points beyond the maximum possible fraction are possible owing to multiple peaks at single TSS regions. c, Plot showing PCA of genomic segments (n = 282,105) with more than two factors bound, highlighting the separation on the basis of the number of factors bound. d, Same plot as in c showing promoter versus distal location. e, Same plot as in c showing PC2 versus PC3 and highlighting the presence of CTCF.
Fig. 2
Fig. 2. Landscape of factor binding to regulatory states.
a, Unsupervised clustering of the 208 factors on the basis of binding enrichment at 36 IDEAS genome states and the 5 main clusters of factors, along with pie charts showing absolute binding fractions of an example of a factor from each cluster. b, Correlation plot showing the fraction of promoter (y-axis) or enhancer (x-axis) binding for all 208 factors, with points coloured by peak counts for each factor. c, Predictive ability of random forest classification of genomic regions as either enhancer or promoter on the basis of the number of factors used to train the algorithm; n = 100 iterations, lines from minimum to maximum with median indicated.
Fig. 3
Fig. 3. Motif identification and analysis.
a, The 293 high-confidence motifs derived from analysis of the ChIP–seq data were quantitatively compared to all (human) motifs in the CIS-BP database and plotted according to similarity scores. Blue points represent motifs that matched the assayed factor, yellow points represent motifs that match a factor other than the one assayed, and red points represent motifs not similar to any in CIS-BP. b, Histograms showing the distance from the centre of the ChIP–seq peak for motifs that do (left) or do not (right) match the TF. c, Clustered heat map showing the similarity of all 293 significant motifs to 733 motifs from CIS-BP for the assayed factors. d, Further analysis of the cluster containing 37 factors that had FOX family motifs, showing the overlap of FOX TF binding in these peaks, as well as the median offset of the FOX motif from the centre of the ChIP–seq peaks. For box plots (bottom), n = 37 CAPs; boxes show middle quartiles, centre line shows median, whiskers show 1.5× interquartile range (IQR). e, PCA showing separation of motifs that fall in promoters versus those that fall in enhancers; n = 408,382 genomic elements. f, Prediction accuracy for calling whether an element is a promoter or enhancer on the basis of motifs that are present; n = 100 iterations, lines from minimum to maximum with median indicated.
Fig. 4
Fig. 4. Co-localization of factors.
a, Correlation matrix based on the cumulative principal component distances weighted by the proportion of variance explained by each component between all factors, derived from the PCA of all genomic loci with a peak containing at least two factors. b, SOM for a group of FOX TFs in HepG2 cells, with metaclusters showing major associations with specific factors.
Fig. 5
Fig. 5. Analysis of GATAD2A co-localization.
a, Presence of top motifs at GATA2DA-bound regions (top) and the top motif called at these peaks (bottom). b, Heat map showing signal intensity at shared and unique peaks for FOXA3 and GATAD2A. A set of random open chromatin regions is shown as a control. c, NuRD complex members and their identification through immunoprecipitation (IP)–mass spectrometry of GATAD2A immunoprecipitations, and through co-binding at GATAD2A-bound loci. Annotations from the String Database on protein interactions are shown as coloured lines connecting the proteins.
Fig. 6
Fig. 6. Association and motif trends in high CAP co-localization.
a, CAP enrichment at loci with increasing number of factors bound. b, Subsampling plot showing the frequency of identification of motifs in HOT regions using increasing number of factors in permutations. Points represent median percentage of loci with one or more motifs (red), two or more motifs (dark blue), or three or more motifs (green) for CAPs bound at those regions; n = 100 iterations, lines from minimum to maximum.
Extended Data Fig. 1
Extended Data Fig. 1. CAP associations with annotated TSSs and IDEAS regions.
a, The 208 ChIP–seq and CETCh–seq experiments plotted by number of peaks called in each experiment (x-axis) against fraction of peaks overlapping with any of 44,488 TSSs in the human genome (peaks ±3 kb from TSS). Selected individual CAPs are labelled. Solid line is linear regression through all points; dotted lines represent number of total TSS regions and maximum possible fraction of TSSs. b, IDEAS segmentation of HepG2 cell genome. Left, colour key for all IDEAS states; right, pie chart indicating fraction of HepG2 genome associated with each state. c, Clustering of 208 CAPs on the basis of chromatin state recapitulating the assigned cluster, with PC1 (63.50%), PC2 (16.51%) and PC3 (6.48%) variances explained. d, Left, distribution of regulatory regions by number of associated CAPs; right, distribution of horizontally matched sites by IDEAS state.
Extended Data Fig. 2
Extended Data Fig. 2. CAP associations with varying CpG and GC content.
a, Heat map and clustering of CAPs on the basis of association with low, intermediate, and high CpG content promoters (LCP, ICP, and HCP, respectively). All regions outside promoters are denoted as rest state. Annotation from Fig. 2a is shown, as are categories of direct DNA-binding factors (DBFs) and chromatin regulators or cofactors (CR/CF). b, Box plot of GC content of motifs for CAPs associating with promoters (n = 26), with both enhancers and promoters (n = 45), or with enhancers (n = 55). Centre line, median; boxes, 25th–75th percentiles; whiskers, 5th–95th percentiles.
Extended Data Fig. 3
Extended Data Fig. 3. Motif analysis.
a, Cumulative fraction of called motifs in our data compared to motifs in the JASPAR 2016 vertebrate database as scored by Tomtom similarity E-value. b, Cumulative fraction of called motifs in our data compared to motifs in the JASPAR 2018 vertebrate database as scored by Tomtom similarity E-value. c, Cumulative fraction of called motifs in our data compared to motifs in the CIS-BP (build 1.02) Homo sapiens database as scored by Tomtom similarity E-value. d, Distribution of TF motifs by concordance (matching expected TF), discordance (matching different TF), and no match in the CIS-BP database. Stacked bar plots are coloured by main TF groups from previous unsupervised clustering. e, Distribution of TF motifs highly dissimilar to all motifs in CIS-BP (y-axis) and their median offset distance from the centre of peaks (x-axis). f, Stacked distribution of highly dissimilar motifs (no match; green) with similar (concordant; blue) and motif called for secondary factor (discordant; orange) and their median offset distances from the peak centre (x-axis).
Extended Data Fig. 4
Extended Data Fig. 4. CAPs associated with FOX TFs and motifs.
a, Thirty-seven non-FOX TFs with a called Forkhead motif, with heat map denoting fraction of called peaks with both a primary (matched to specific TF) motif and a FOX motif, with a primary motif but not a FOX motif, with a FOX motif but no primary motif, and with neither a primary nor a FOX motif. The eight TFs with grey boxes do not have a known primary motif. b, Peak overlaps between the 37 TFs and 6 FOX factors for which we obtained ChIP–seq data; box plots represent distribution of all FOX overlaps for each of the 37 factors. c, Same as b, but normalized for peak counts of each of the 37 factors. d, Same as c, but clustered vertically, revealing NuRD component clustering. Box plots are vertically matched, n = 6 overlap measurements; boxes, middle quartiles; centre line, median; whiskers, 1.5 × IQR.
Extended Data Fig. 5
Extended Data Fig. 5. Read count correlations between CAPs.
Read count correlations between all 208 assayed CAPs, mean centred and squared, with unsupervised clustering.
Extended Data Fig. 6
Extended Data Fig. 6. Motif and peak associations.
a, Directional co-occurrence of motifs in ChIP–seq called peaks. b, Subset of network plot derived from peak overlaps between all factors, showing strong associations between a subset of factors.
Extended Data Fig. 7
Extended Data Fig. 7. Self-organizing maps.
a, SOM showing FOXA2 metaclusters. b, Example heat map showing CAP enrichment in 16 key SOM metaclusters. c, Example heat map showing CAP enrichment in 16 key SOM metaclusters. d, SOMs for FOXA1, FOXA2, HNF4A, and EP300. e, Example decision tree showing the presence or absence of CAPs for metacluster 32. f, GREAT analysis of metacluster 32-assigned genes that are likely to be regulated in this metacluster, and GO term analysis for these genes; P represents sample frequency probability.
Extended Data Fig. 8
Extended Data Fig. 8. GATAD2A analyses.
a, GATAD2A genome-wide ChIP–seq binding in HepG2 cells annotated by IDEAS state. b, Box plots showing expression level (RNA-seq TPM) of genes nearest sites with both GATAD2A and FOXA3 ChIP–seq peaks (green), genes nearest sites with FOXA3 peaks but no GATAD2A peaks (red), genes nearest sites with GATAD2A peaks but no FOXA3 peaks (blue), and GC-matched null regions for each CAP (grey). Boxes, middle quartiles; centre line, median; whiskers, 1.5 × IQR; n = 27,440 binding sites (GATAD2A + FOXA3), n = 10,658 binding sites (FOXA3 only), n = 13,706 binding sites (GATAD2A only), n = 37,073 binding sites (FOXA3 null matched), n = 40,441 binding sites (GATAD2A null matched). c, GO enrichments for genes with both GATAD2A and FOXA3 peaks. d, GO enrichments for genes with FOXA3 peaks but no GATAD2A peaks. e, GO enrichments for genes with GATAD2A peaks but no FOXA3 peaks. GO P value represents sample frequency probability.
Extended Data Fig. 9
Extended Data Fig. 9. Extensive co-associations between CAPs.
a, Example of genomic site with many associated CAPs. Each track shows aligned ChIP–seq reads, and is slightly offset to better show peaks for each experiment. b, Enrichment of biological pathways at HOT regions near enhancers or promoters; P represents sample frequency probability. c, Increasing numbers of CAPs bound at genomic sites correlate with increased evolutionary constraint as measured by GERP, showing incremental fraction overlap of highly constrained elements with CAP-associated sites for both promoter regions (red) and enhancer regions (orange). Boxes, quartiles; centre line, median; whiskers, 1.5 × IQR. d, Increasing numbers of CAPs bound at genomic sites (<2 kb in size) are associated with decreasing distance to nearest TSS; boxes, middle two quartiles; centre line, median; whiskers, 1.5 × IQR. e, Increasing numbers of CAPs bound at genomic sites (<2 kb in size) are associated with increasing expression of nearest gene; boxes, middle two quartiles; centre line, median; whiskers, 1.5 × IQR. d, e, Left to right: n(1) = 124,074, n(2) = 59,407, n(3) = 19,661, n(4) = 12,433, n(5–9) = 23,517, n(10–19) = 14,757, n(20–29) = 7,077, n(30–39) = 4,703, n(40–49) = 3,542, n(50–69) = 5,061, n(70–99) = 4,655, n(>100) = 3,219, total n = 282,105.
Extended Data Fig. 10
Extended Data Fig. 10. PIQ and SVM analyses in CAP co-associated regions.
a, Number of unique DNase PIQ footprints (y-axis) plotted by sites with varying numbers of associated CAPs (x-axis), for PIQ threshold >0.7. b, Number of unique DNase PIQ footprints (y-axis) plotted by sites with varying numbers of associated CAPs (x-axis), for PIQ threshold >0.8. c, Number of unique DNase PIQ footprints (y-axis) plotted by sites with varying numbers of associated CAPs (x-axis), for PIQ threshold >0.9. d, Number of unique DNase PIQ footprints (y-axis) plotted by sites with varying numbers of associated CAPs (x-axis), for PIQ threshold >0.99. ad, Boxes, middle two quartiles; whiskers 1.5 × IQR; centre line, median; n(0–4) = 216,496, n(4–9) = 23,540, n(9–19) = 14,859, n(29–39) = 4,947, n(39–49) = 3,735, n(49–70) = 5,517, n(70–100) = 3,995, n(100–208) = 1,681. e, Distribution of SVM classifier scores (y-axis) for sites with varying numbers of associated CAPs (x-axis). The scores remain relatively constant across sites and are significantly higher than the scores of classifier values in matched null sites. Boxes, middle two quartiles; whiskers 1.5 × IQR; centre line, median; n(1–4) = 1,814,475 bins, n(5–9) = 643,997 bins, n(10–19) = 646,453 bins, n(20–29) = 330,795 bins, n(30–39) = 194,981 bins, n(40–49) = 118,622 bins, n(50–69) = 131,167 bins, n(70–99) = 57,819 bins, n(100+) = 3,545 bins, n(matched null) = 9,597,800 bins. f, SVM PR-AUC scores for non-TFs (chromatin regulators and cofactors; CR/CF) and for TFs at motif-level mean PR-AUC (0.74). g, SVM PR-AUC scores for non-TFs (chromatin regulators and cofactors) and for TFs at motif-level mean PR-AUC (0.66). f, g, Boxes, middle two quartiles; whiskers 1.5 × IQR; centre line, median; n(CR/CF) = 37, n(DBF) = 171.
Extended Data Fig. 11
Extended Data Fig. 11. SVM and motif analyses in HOT sites.
a, Number of sites (y-axis) by measured number of TFs (x-axis) with classifier values in the top 5% of all classifier values (blue) or with classifier values in the bottom 75% of all classifier values (red) in highly bound regions, based on SVM scores of factor peaks associated with highly bound regions. b, Number of sites (y-axis) by measured number of TFs (x-axis) with classifier values in the top 5% of all classifier values (blue) or with classifier values in the bottom 75% of all classifier values (red), in HOT sites with >70 associated TFs. c, Number of sites (y-axis) by measured number of TFs (x-axis) with classifier values in the top 5% of all classifier values (blue) or with classifier values in the bottom 75% of all classifier values (red), in sites with 2–10 associated TFs. d, Number of sites (y-axis) by measured number of TFs (x-axis) with classifier values in the top 5% of all classifier values (blue) or with classifier values in the bottom 75% of all classifier values (red), in a random set of enhancers with any number of associated TFs (0+). e, Degree of motif enrichment in highly bound regions for all HepG2-expressed TFs with available motifs (n = 365) for top three motifs enriched in highly bound sites with 50+ CAPs (highest P = 3.9 × 10−146). f, Degree of motif enrichment in highly bound regions for all HepG2-expressed TFs with available motifs (n = 365) for top three motifs in enhancers with 2–10 CAPs (highest P = 1.8 × 10−17). g, Degree of motif enrichment in highly bound regions for all HepG2-expressed TFs with available motifs (n = 365) for top motif in random genome enhancers with 0+ CAPs (highest P = 6.9 × 10−3). h, Distribution of all SVM scores (y-axis) for HOT sites with >70 associated CAPs (red), for sites with 2–10 associated CAPs (green), and for random enhancer sites with 0+ CAPs (blue). i, Pie chart showing fraction of HOT sites in which each TF has the highest SVM classifier value, indicating the strongest motif present.

References

    1. Vaquerizas, J. M., Kummerfeld, S. K., Teichmann, S. A. & Luscombe, N. M. A census of human transcription factors: function, expression and evolution. Nat. Rev. Genet. 10, 252–263 (2009). - PubMed
    1. Lambert, S. A. et al. The human transcription factors. Cell172, 650–665 (2018). - PubMed
    1. Yosef, N. et al. Dynamic regulatory network controlling TH17 cell differentiation. Nature496, 461–468 (2013). - PMC - PubMed
    1. Busskamp, V. et al. Rapid neurogenesis through transcriptional activation in human stem cells. Mol. Syst. Biol. 10, 760 (2014). - PMC - PubMed
    1. Chen, X. et al. Integration of external signaling pathways with the core transcriptional network in embryonic stem cells. Cell133, 1106–1117 (2008). - PubMed

Publication types

MeSH terms