. 2020 Jul;583(7818):711-719.
doi: 10.1038/s41586-020-2077-3. Epub 2020 Jul 29.

A large-scale binding and functional map of human RNA-binding proteins

Affiliations

A large-scale binding and functional map of human RNA-binding proteins

Eric L Van Nostrand et al. Nature. 2020 Jul.

Erratum in

  • Author Correction: A large-scale binding and functional map of human RNA-binding proteins.
    Van Nostrand EL, Freese P, Pratt GA, Wang X, Wei X, Xiao R, Blue SM, Chen JY, Cody NAL, Dominguez D, Olson S, Sundararaman B, Zhan L, Bazile C, Bouvrette LPB, Bergalet J, Duff MO, Garcia KE, Gelboin-Burkhart C, Hochman M, Lambert NJ, Li H, McGurk MP, Nguyen TB, Palden T, Rabano I, Sathe S, Stanton R, Su A, Wang R, Yee BA, Zhou B, Louie AL, Aigner S, Fu XD, Lécuyer E, Burge CB, Graveley BR, Yeo GW. Van Nostrand EL, et al. Nature. 2021 Jan;589(7842):E5. doi: 10.1038/s41586-020-03067-w. Nature. 2021. PMID: 33402748 Free PMC article. No abstract available.

Abstract

Many proteins regulate the expression of genes by binding to specific regions encoded in the genome1. Here we introduce a new data set of RNA elements in the human genome that are recognized by RNA-binding proteins (RBPs), generated as part of the Encyclopedia of DNA Elements (ENCODE) project phase III. This class of regulatory elements functions only when transcribed into RNA, as they serve as the binding sites for RBPs that control post-transcriptional processes such as splicing, cleavage and polyadenylation, and the editing, localization, stability and translation of mRNAs. We describe the mapping and characterization of RNA elements recognized by a large collection of human RBPs in K562 and HepG2 cells. Integrative analyses using five assays identify RBP binding sites on RNA and chromatin in vivo, the in vitro binding preferences of RBPs, the function of RBP binding sites and the subcellular localization of RBPs, producing 1,223 replicated data sets for 356 RBPs. We describe the spectrum of RBP binding throughout the transcriptome and the connections between these interactions and various aspects of RNA biology, including RNA stability, splicing regulation and RNA localization. These data expand the catalogue of functional elements encoded in the human genome by the addition of a large set of elements that function at the RNA level by interacting with RBPs.


Conflict of interest statement

E.L.V.N. is a co-founder, member of the Board of Directors, equity holder and paid consultant for Eclipse BioInnovations Inc. G.W.Y. is co-founder, member of the Board of Directors, on the SAB, equity holder and paid consultant for Locana and Eclipse BioInnovations Inc. G.W.Y. is a distinguished visiting professor at the National University of Singapore. E.L.V.N.’s and G.W.Y.’s interest(s) have been reviewed and approved by the University of California, San Diego in accordance with its conflict of interest policies. C.B.B. is a scientific advisory board member and equity option holder of Arrakis Therapeutics Inc. The authors declare no other competing financial interests.

Figures

Fig. 1
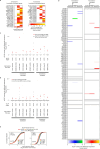
Fig. 1. Overview of experiments and data types.
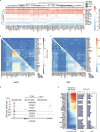
a, The five assays performed to characterize RBPs. b, Three hundred and fifty-six RBPs profiled by at least one ENCODE experiment (orange or red) with localization by immunofluorescence (green), essential genes from CRISPR screening (maroon), manually annotated RBP functions (blue or purple), and annotated protein domains (pink; RRM, KH, zinc finger, RNA helicase, RNase, double-stranded RNA binding (dsRBD), and pumilio/FBF domain (PUM-HD)). Histograms for each category are shown at bottom. c, Combinatorial expression and splicing regulation of PTBP3. Tracks indicate eCLIP and RNA-seq read density (reads per million). Tracks are shown for replicate 1; eCLIP and KD–RNA-seq were performed in biological duplicate with similar results. Bottom, alternatively spliced exon 2, with lines indicating junction-spanning reads and indicated per cent spliced in (ψ). Boxes indicate reproducible (by IDR) PTBP1 peaks, with red boxes indicating RBNS motifs for the PTB family member PTBP3 located within (or up to 50 bases upstream of) peaks.
Fig. 2
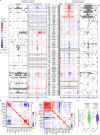
Fig. 2. Integrated analysis of RBP–target association networks.
a, Stacked bars indicate significant eCLIP peaks (fold enrichment ≥8, P ≤ 0.001, and biologically reproducible by IDR) for 223 eCLIP experiments. Number of peaks is shown on a logarithmic scale; bar heights are pseudo-coloured according to the linear fraction of peaks overlapping the indicated regions of pre-RNA, mRNA, and non-coding RNAs. Data sets were hierarchically clustered to identify six clusters based on similar region profiles (Extended Data Fig. 3a). b, Seventeen clusters and one outlier of RBPs based on t-distributed stochastic neighbour-embedding (t-SNE) clustering (performed in MATLAB with algorithm = exact, distance = correlation, and perplexity = 10) of unique genomic and multicopy element signal for 223 eCLIP experiments. c, For RBPs in clusters in b, heatmap indicates the average relative information for each listed RNA region or element. d, Each point indicates the fold enrichment in eCLIP of RBFOX2 in K562 cells (RBFOX2K562) for a reproducible RBFOX2 eCLIP peak in HepG2 cells (RBFOX2HepG2), with underlaid black histogram, separated by the difference in expression of the bound gene between K562 and HepG2 cells. Red lines indicate mean; two-sided Kolmogorov–Smirnov test. e, For each RBP profiled in both K562 and HepG2 cells (n = 73), points indicate the fraction of peaks in the first cell type associated with a given gene class that are (blue) at least fourfold enriched, or (red) not enriched (fold enrichment ≤1) in the second cell type. Boxes indicate quartiles, green lines show mean.
Fig. 3
Fig. 3. Sequence-specific binding in vivo is determined predominantly by intrinsic RNA affinity of RBPs.
a, Left, top sequence motif of RBNS- and eCLIP-enriched 5mers ordered by decreasing correlation RBNS and eCLIP enrichments. Filled circles indicate significant RBNS and eCLIP motif overlap (hypergeometric P < 0.05). Left heatmap, Spearman correlation between RBNS and eCLIP enrichments for all 5mers. Centre heatmap, enrichment of the top RBNS 5mer in eCLIP peaks (ReCLIP) within different genomic regions. Right heatmap, proportion of eCLIP peaks attributed to each of the ten highest-affinity RBNS 5mers, as well as RBNS 5mers 11–24 combined. Grey line indicates the number of top RBNS 5mers required to explain more than 50% of eCLIP peaks for each RBP (maximum, 24 5mers). b, Comparison of PCBP2 in vivo versus in vitro 5mer enrichments, with 5mers containing CCCC and GGGG highlighted. Significance determined by one-sided Wilcoxon rank-sum test and indicated if P < 0.05.  The x- and y-axes are plotted on an arcsinh scale. Similar results were obtained when analysing 6mers. c, Comparison of splicing changes upon RBP knockdown for RBP-repressed cassette exons (skipped exons, SE) with exon peaks with RBNS motif (n = 368) or without RBNS (n = 1,758), upstream intron peaks with RBNS (n = 223) or without RBNS (n = 2,195), and downstream intron peaks with RBNS (n = 250) or without RBNS (n = 953). Boxes, 25th to 75th percentiles; notch, median; line, outliers. Significance determined by one-sided Wilcoxon rank-sum test and indicated if P < 0.05.
Fig. 4
Fig. 4. Association between RBP binding and RNA expression upon knockdown.
a, Heatmap indicates significance of overlap between genes with regions that were significantly enriched (P ≤ 10−5 and ≥4-fold enriched in eCLIP versus input) and genes that were significantly (top) increased or (bottom) decreased (P < 0.05 and false discovery rate (FDR) <0.05) in RBP knockdown RNA-seq experiments. Significance determined by two-sided Fisher’s exact test or Yates’ χ2 approximation where appropriate; *P < 0.05, **P < 10−5 after Bonferroni correction. Shown are all overlaps meeting a P < 0.05 threshold; see Extended Data Fig. 5b for all comparisons. b, c, Lines indicate cumulative distribution plots of gene expression fold-change (knockdown versus control) for indicated categories of eCLIP enrichment of DDX6 in HepG2 cells (b), and IGF2BP3 in HepG2 cells (c). **P < 10−5, *P < 0.05; two-sided Kolmogorov–Smirnov test.
Fig. 5
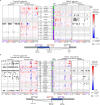
Fig. 5. Integration of eCLIP and RNA-seq identifies splicing regulatory patterns.
a, Normalized splicing maps of RBFOX2 and PTBP1 for skipped exons that were excluded (blue) or included (red) upon knockdown, relative to a set of ‘native’ skipped exons (nSEs) for which the inclusion rate was between 0.05 and 0.95 in controls. Lines indicate average eCLIP read density in IP versus input for indicated exon categories. Shaded area indicates 0.5th and 99.5th percentiles observed from 1,000 random samplings of native events. b, Heatmap indicates the difference between nSE-normalized eCLIP read density at skipped exons that were included (left) or excluded (right) upon RBP knockdown for all profiled HNRNP and SR proteins (see Extended Data Fig. 6a for all RBPs). c, Lines indicate the average number of RBPs with eCLIP peaks at skipped (green) versus constitutive (grey) exons and flanking introns. Spliceosome machinery RBPs were excluded from this analysis. d, Heatmap indicates normalized eCLIP signal at RBFOX2 knockdown-excluded exons in HepG2 cells relative to nSEs for RBFOX2 (top) and all other RBPs within the same binding class and cell type (bottom). See Extended Data Fig. 8c for all labels. e, Lines indicate normalized signal tracks for eCLIP replicates of RBFOX2 and QKI in downstream proximal introns. Black line, mean of 37 non-RBFOX2 data sets in the same binding class; grey, 10th to 90th percentiles.
Fig. 6
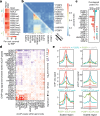
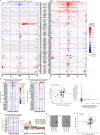
Fig. 6. Chromatin association of RBPs and overlap with RNA binding.
a, Overlap between RBP ChIP–seq and DNase I hypersensitive sites and various histone marks in HepG2 and K562 cells. Labels indicate marks associated with regulatory regions (RE), promoters (TSS), enhancers (E), transcribed regions (T) and repressive regions (R). b, Heatmap indicates the Jaccard indexes between ChIP–seq peaks of different RBPs at promoter regions (bottom left) or non-promoter regions (top right) for all HepG2 ChIP–seq data sets. See Extended Data Fig. 9b for all labels and Extended Data Fig. 9c for K562 cells. c, Percentage of RBP eCLIP peaks overlapped by ChIP–seq peaks (red) and percentage of RBP ChIP–seq peaks overlapped by eCLIP peaks (green) for the same RBP. RBPs are sorted by decreasing level of overlapped ChIP–seq peaks. d, Clustering of overlapping chromatin- and RNA-binding activities of different RBPs at non-promoter regions in HepG2. Colour indicates the degree of ChIP enrichment at eCLIP peaks relative to surrounding regions. Significant enrichments (P ≤ 0.001 by two-sided Wilcoxon rank-sum test with no multiple comparison correction) are indicated by filled circles. e, Cross-RBP comparison of chromatin and RNA-binding activities in HepG2 cells. Left, ChIP–seq density of indicated RBPs around HNRNPK, PCBP2 or PCBP1 eCLIP peaks. Right, eCLIP average read density of indicated RBPs around HNRNPK, PCBP2 or PCBP1 eCLIP peaks.
Fig. 7
Fig. 7. Subcellular localization of RBPs and links to transcriptome binding and regulation.
a, Examples of RBPs (green) co-localized with nine investigated markers (red). RBPs were imaged at five or more sites per co-labelling marker with twelve co-labelled markers in total, and representative images are shown. b, For localization patterns with known localized RNA classes, heatmap indicates significance (from one-sided Wilcoxon rank-sum test) comparing eCLIP relative information for the indicated RNA class (y-axis) for RBPs with versus without the indicated localization (x-axis). c, Bars indicate eCLIP relative information content (IP versus input) for mitochondria H-strand (grey) or L-strand (red). RBPs with mitochondrial localization in HepG2 cells are indicated in red. Inset shows immunofluorescence imaging for DHX30 (representative of ten sites imaged). d, Genome browser tracks indicate eCLIP relative information content along the mitochondrial genome (top) or a roughly 300-nt region for indicated RBPs (bottom). Inset shows RNA secondary structure prediction (RNAfold) for the indicated region. Tracks are shown for replicate 1; eCLIP and KD–RNA-seq were performed in biological duplicate with similar results.
Extended Data Fig. 1
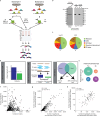
Extended Data Fig. 1. Experimental quality assessment of eCLIP assays.
a, Model of ENCODE eCLIP experiments. Inputs were taken by sampling 2% of one of the two biosamples before IP. b, Example IP–western image for DCP1B IP success in K562 cells during initial IP tests performed without enzymatic steps (left) and IP failure in K562 cells during eCLIP experiments (right). This experiment was performed once. c, Pie charts indicate the number of eCLIP experiments that fell into the following categories: failure to successfully immunoprecipitate during eCLIP (IP failure), failure to yield amplifiable library in fewer than 20 PCR cycles (experiment abandoned), experiments that yielded immunoprecipitated library and were sequenced but failed quality assessment (QC failed), successful experiments that did not meet ENCODE standards but contained reproducible signal and have been released on the GEO, and successful experiments that met ENCODE standards and are available at the ENCODE Data Coordination Center (released). d, Schematic of eCLIP data quality standards. See Supplementary Text and Supplementary Fig. 11 for additional details. e, Confusion matrix of final classification scheme versus manual quality assessment. f, The number of CLIP per-identified clusters (x-axis) versus the number of significantly enriched peaks (y-axis) (fold enrichment ≥ 8 and P ≤ 0.001 from two-sided Fisher’s exact Test (or Yates’s χ2 test where appropriate) with no hypothesis testing correction (Methods)) identified for each of 446 eCLIP experimental replicates. g, The number of significantly enriched peaks (fold enrichment ≥ 8 and P ≤ 0.001 from two-sided Fisher’s exact rest (or Yates’ χ2 test where appropriate) with no hypothesis testing correction (Methods)) identified in each of replicate 1 and replicate 2 versus the number of reproducible peaks identified from IDR analysis for 223 eCLIP experiments. Pearson correlation and significance were determined in MATLAB. h, The number of significant and reproducible peaks identified in K562 cells (x-axis) versus HepG2 cells (y-axis) as in g, for all 73 RBPs with eCLIP in both cell types. Pearson correlation and significance were determined in MATLAB.
Extended Data Fig. 2
Extended Data Fig. 2. Integrated analysis of 223 eCLIP data sets identifies RBP clusters on the basis of binding patterns.
a, The effect of cluster number on hierarchical clustering on the Euclidean distance between RBPs for the fraction of peaks overlapping each of the RNA region types as shown in Fig. 2a. For each number of clusters k between 2 and 35, the sum of squared error was calculated between the number of peaks annotated for each region versus the mean of all RBPs in that RBP’s cluster and summed across all RBPs. An inflection point was identified at k = 6 (indicated). b, Model of eCLIP analysis pipeline for quantification of eCLIP signal at RNA families with multiple transcript or pseudogene copies. c, Stacked bars indicate the number of reads from replicate 1 of all 223 eCLIP experiments, separated by whether they map uniquely to the genome (red), uniquely to the genome but within a repetitive element identified by RepeatMasker (purple), or to repetitive element families (grey). Data sets are sorted by the fraction of unique genomic reads. df, Each eCLIP data set is displayed as a point based on t-SNE clustering (Fig. 2b), with colour indicating whether the data set passed peak-based or family-mapping based quality assessment (d), the relative information at coding sequence (CDS) (e), or relative information at the 45S ribosomal RNA precursor (f). g, Means of 100 random orderings of each data type for the number of genes that were differentially expressed for all 472 KD–RNA-seq data sets (requiring FDR < 0.05 and P < 0.05 from DEseq analysis; Methods) (green), bound in 223 eCLIP data sets (overlapped by a IDR-reproducible peak with P ≤ 10−3 and fold enrichment ≥ 8 in IP versus input; Methods) (blue), or both bound and differentially expressed (considering 203 pairings of eCLIP and KD–RNA-seq for an RBP in the same cell type) (orange). The set of genes considered was all 57,645 genes in GENCODE v19; see Supplementary Fig. 13a, b for analyses of expressed genes only. Grey dotted line indicates the total number of expressed genes, defined as TPM > 1 in either K562 or HepG2 cells. Shaded regions indicate 10th to 90th percentiles. h, Means of 100 random orderings of data sets for the number of differential splicing events for all 472 RBP KD–RNA-seq experiments (including skipped exons, alternative 5′ and 3′ splice sites, retained introns, and mutually exclusive exons; requiring FDR < 0.05, P < 0.05, and |ΔΨ| > 0.05) (red), and exons both bound by an RBP and differentially spliced upon RBP knockdown (considering 203 pairings of eCLIP and KD–RNA-seq for an RBP in the same cell type) (blue), with binding defined as a peak located anywhere between the upstream intron 5′ splice site and the downstream intron 3′ splice site. Shaded regions indicate 10th to 90th percentiles. i, Cumulative fraction of bases within peaks for 100 random orderings of the 223 eCLIP data sets, separated by transcript regions as indicated. Shaded region indicates 10th to 90th percentiles. See Supplementary Text and Supplementary Fig. 13c, d for additional analyses of all versus expressed genes only. j, Fraction of overlapping peaks identified from our standard eCLIP processing pipeline between K562 and HepG2 cells for RBPs profiled (blue or red) in both cell types, or (black) between one RBP in K562 cells and a second in HepG2 cells, for sets of genes separated by their relative expression change between K562 and HepG2 cells as follows: unchanged (fold-difference ≤ 1.2), weakly (1.2 < fold-difference ≤ 2), moderately (2 < fold-difference ≤ 5) or strongly (fold-difference > 5) differential, or cell type-specific genes (TPM < 0.1 in one cell type and TPM ≥ 1 in the other). Red line indicates mean. k, Each point represents one eCLIP data set compared with the same RBP profiled in the second cell type (73 total). For the set of peaks from the first cell type that are not enriched (fold enrichment < 1) in the second cell type, red points indicate the fraction that occur in genes with the indicated expression difference between HepG2 and K562 cells. Blue points similarly indicate the gene distribution of peaks that were fourfold enriched in the opposite cell type. Boxes, quartiles; green line, median.
Extended Data Fig. 3
Extended Data Fig. 3. Enrichment of in vitro motifs in eCLIP peaks for different RNA types and comparison with in vivo eCLIP-derived motifs.
a, b, The average enrichment (geometric mean) of the top ten RBNS 5mers for a given RBP in the peaks of an eCLIP experiment compared to shuffled eCLIP peaks, among all RBPs predominantly bound to 3′ UTR + CDS (a) or introns (b) by eCLIP. RBPs arranged by RBNS motif similarity along the y-axis, with corresponding RBPs between RBNS and eCLIP boxed along the diagonals. c, RBP order and RBNS and eCLIP motifs as in Fig. 3a. Right, ratio of the percentage of eCLIP peaks attributable to the top ten RBNS 5mers for each RBP compared to the percentage of eCLIP peaks attributable to the same ten 5mers, averaged over all other eCLIP experiments in the same RNA type class (from a and b). For 18 out of 21 RBPs, the RBNS motifs explain more (R > 1) of the corresponding eCLIP peaks than eCLIP peaks of proteins binding similar transcript regions (SRSF9 and RBM22, shown in grey, were excluded because there were insufficient numbers of RBPs in their type class to perform this analysis). d, The proportion of the top ten RBNS 5mers that fall within an eCLIP peak, separated by transcript region. RBPs arranged from top to bottom according to the proportion that fall within an eCLIP peak over all transcript regions (all motif occurrences in expressed transcripts). e, Top motifs derived from all eCLIP peaks as well as eCLIP peaks within intronic, CDS, and 3′UTR regions. Motifs were derived only if there were at least 5,000 peaks or 5% of total peaks in that region, averaged over the 2 eCLIP replicates. Blue boxes indicate that eCLIP was not performed in that cell line. Filled circles indicate significant overlap (P < 0.05 by one-sided hypergeometric test) between RBNS and eCLIP motifs. f, The top eCLIP motifs that do not match RBNS for the corresponding RBP (if any). The eCLIP motif was considered as matching RBNS if any of its constituent 5mers were among the RBNS Z ≥ 3 5mers (always using at least 10 RBNS 5mers if there were fewer than 10 with Z ≥ 3). Blue boxes indicate that eCLIP was not performed in that cell line. Below right, percentage of eCLIP experiments aggregated over all RBPs or cell types in each category of agreement with RBNS. Horizontal line indicates a significant difference in the proportion of a particular eCLIP–RBNS agreement category between eCLIP analysis of all peaks versus eCLIP analysis of intron, CDS, or 3′UTR peaks (P < 0.05 by one-sided Fisher’s exact test).
Extended Data Fig. 4
Extended Data Fig. 4. Splicing regulatory activity of RBNS+ and RBNS− eCLIP peaks.
a, Density of 5mers in skipped exons and their flanking intronic up/downstream 100 nt in 24 changed versus control skipped exons upon PCBP2 knockdown in HepG2 cells. The ratio of changed and control frequency was computed for each 5mer with the ratio plotted as density on the y-axis, and 5mers were separated by C-rich (contain 4–5 Cs), G-rich (contain 4–5 Gs), or ‘other’. Significance determined by one-sided Kolmogorov–Smirnov test. Box, 25th to 75th percentiles; notch, median. b, Percentage of eCLIP peaks that contain a C- or G-rich motif (5mer with 4 or 5 of the respective base). PCBP2 eCLIP in HepG2 cells is noted (eCLIP with the third highest proportion of peaks with C-rich motifs; median for peaks containing G-rich motifs). Box, 25th to 75th percentiles; notch, median. c, Bottom left, distribution of change ΔΨ upon knockdown in each of the six eCLIP+ peak region–skipped exon splicing change types compared to that of eCLIP− skipped exons for KHSRP in HepG2 cells (significant if P < 0.05 by one-sided Wilcoxon rank-sum test). Right, regions of significance for eCLIP+ versus eCLIP− skipped exons for each eCLIP experiment and proportion of skipped exons in each of the six eCLIP+ types for each eCLIP experiment. d, Same set of RBPs and corresponding eCLIP+ peak region–skipped exon splicing change types as in Fig. 3c, but separating eCLIP peaks on whether they contain the top ‘eCLIP-only’ 5mer (based on the motifs from Extended Data Fig. 3f) instead of the top RBNS 5mer. Box, 25th to 75th percentiles; notch, median; line, outliers. Significance was determined by one-sided Wilcoxon rank-sum test and indicated if P < 0.05. e, As in Fig. 3c, but shown for RBP-activated skipped exons (decreased inclusion upon RBP knockdown). Box, 25th to 75th percentiles; notch, median; line, outliers. Significance was determined by one-sided Wilcoxon rank-sum test and indicated if P < 0.05.
Extended Data Fig. 5
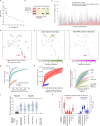
Extended Data Fig. 5. Association between RBP binding and RNA expression changes upon RBP knockdown.
a, Heatmap indicates significance of overlap between genes with regions that were significantly enriched (P ≤ 10−5 and ≥fourfold enriched in eCLIP versus input) and genes that were significantly (top) increased or (bottom) decreased (P < 0.05 and false discovery rate (FDR)  < 0.05) in RBP knockdown RNA-seq experiments using DESeq analysis with no G/C content normalization (see Supplementary Methods and Supplementary Fig.  2). Significance determined by two-sided Fisher’s exact test or Yates’ χ2 approximation where appropriate; *P < 0.05, **P < 10−5 after Bonferroni correction. Shown are all overlaps meeting a P < 0.05 threshold. b, Colour indicates the significance of overlap between genes that were differentially expressed upon knockdown of an RBP and target genes with significant enrichment for 5′UTR, CDS, or 3′UTR regions in eCLIP of the same RBP in the same cell type. Shown are all 203 pairings of KD–RNA-seq and eCLIP performed in the same cell type. Hatched boxes indicate comparisons with fewer than ten genes altered in RNA-seq. The background gene set for each comparison was chosen by taking genes with at least ten reads in one of IP or input, and where at least ten reads would be expected in the comparison data set given the total number of usable reads. Significance was determined by two-sided Fisher’s exact test (or Yates’s χ2 test where appropriate) with no hypothesis testing correction (Methods). c, d, Red points indicate significance of overlap between eCLIP and KD–RNA-seq for the 13 significant overlaps (multiple hypothesis-corrected P ≤ 0.05), showing only the most significantly enriched region from b. Black points indicate knockdown RNA-seq data sets compared against enrichments for the same transcript region for eCLIP data sets for RBPs within the same binding type class (c) (as identified in Fig. 2a), or all eCLIP data sets in the same cell type (d). e, Cumulative distribution plots of gene expression fold-change for UPF1 knockdown in HepG2 (left) and FMR1 knockdown in K562 (right) for indicated categories of eCLIP enrichment. *P < 0.05, **P < 10−5; two-sided Kolmogorov–Smirnov test.
Extended Data Fig. 6
Extended Data Fig. 6. Integration of eCLIP and KD–RNA-seq to identify splicing regulatory patterns.
a, Inner heatmap indicates the difference between normalized eCLIP read density at skipped exons that were excluded (left) or included (right) upon RBP knockdown, versus nSEs (as described in Supplementary Fig. 14). Out of 203 pairings of eCLIP and KD–RNA-seq in the same cell type (139 RBPs total), 92 pairings (72 RBPs) with at least 100 significantly included or excluded events are shown. Outer heatmap indicates positions at which the signal exceeds the 0.5–99.5% confidence interval obtained by 1,000 random samplings of the same number of events from the native skipped exon control set without multiple hypothesis testing correction. The number of RBP knockdown-altered skipped exons for each comparison is indicated. Data sets were hierarchically clustered at the RBP level, and data sets with fewer than 100 events are indicated by hatching. b, c, Heatmap indicates correlation (Pearson R) between splicing maps for knockdown-excluded (b) or knockdown-included (c) exons for RBPs profiled in both K562 and HepG2 cells, hierarchically clustered at the RBP level. d, Plot represents the distribution of Pearson correlations between splicing maps as shown in b, c, separated by whether the comparison is between the same RBP (n = 18 knockdown-included and 16 knockdown-excluded) or different RBPs (n = 612 knockdown-included and 480 knockdown-excluded comparisons, respectively) profiled in two cell types. Different RBPs are shown as smoothed histogram using a Normal kernel, and red line indicates mean. Significance was determined by two-sided Kolmogorov–Smirnov test.
Extended Data Fig. 7
Extended Data Fig. 7. RNA maps for alternative 5′ and 3′ splice sites.
a, b, Inner heatmaps indicate enrichment at RBP-responsive alternative 5′ splice site (a) and alternative 3′ splice site (b) events relative to native alternative 5′ splice site events for all RBPs with eCLIP and KD–RNA-seq data that showed a minimum of 50 significantly changing events upon knockdown. The region shown extends 50 nt into exons and 300 nt into introns. Outer heatmaps indicate positions at which the signal exceeds the 0.5–99.5% confidence interval obtained by 1,000 random samplings of the same number of events from the native alternative 5′ or 3′ splice site control sets, respectively, without multiple hypothesis correction.
Extended Data Fig. 8
Extended Data Fig. 8. Cross-RBP splicing maps.
a, Similar to Extended Data Fig. 6a, knockdown-altered skipped exons were identified for each RNA-seq experiment. However, for this analysis, normalized eCLIP read density at skipped exons that were excluded (left) or included (right) upon RBP knockdown versus nSEs was calculated separately for all RBPs within the same RBP class (identified in Fig. 2a). The heatmap then indicates the difference between the normalized eCLIP signal for the shRNA-targeted RBP and the mean of the normalized eCLIP signal for all other RBPs within that class. Shown are all 92 pairings of RBPs with eCLIP and KD–RNA-seq data and at least 100 included or excluded altered events, with hatching indicating data sets with fewer than 100 significantly altered events. b, Heatmap indicates normalized eCLIP signal at 492 HNRNPC knockdown-induced exons in HepG2 cells relative to nSEs for HNRNPC (top) and all other RBPs within the same binding class and cell type (bottom). c, As in b, for 138 RBFOX2 knockdown-excluded exons in HepG2 cells (as shown in Fig. 5d, but including all labels). d, Points indicate average change in ΔΨ in two replicates of RBFOX2 knockdown (x-axis) and QKI knockdown (y-axis) in HepG2 cells. Shown are 93 exons that were significantly altered (P < 0.05, FDR < 0.1, and |ΔΨ| > 0.05) from rMATS analysis of either RBFOX2 or QKI, and had at least 30 inclusion or exclusion reads in both replicates and average |ΔΨ| > 0.05 for both RBFOX2 and QKI knockdown. Significance was determined from correlation in MATLAB. e, For each of 138 RBFOX2 knockdown-excluded skipped exons in HepG2 cells, points indicate normalized RBFOX2 eCLIP enrichment at the +60 nt position of the downstream intron (x-axis) versus normalized QKI eCLIP enrichment at the +150 nt position of the downstream intron (y-axis). f, As in b, for 160 TIA1 knockdown-included exons in HepG2 cells. Right, black indicates mean of 15 non-TIA1 data sets in the same binding class, with the 10th–90th percentiles indicated in grey. g, Western blot for (left) TIAL1 and (right) TIA1 of IP performed with IgG, TIA1 (RN014P, MBLI), and TIAL1 (RN059PW, MBNL) primary antibodies. This experiment was performed once. h, As in d, for TIA1 and TIAL1 at 107 TIA1 knockdown-included exons in HepG2 cells.
Extended Data Fig. 9
Extended Data Fig. 9. Comparison between RBP DNA and RNA association.
a, Relative enrichment of overlap between RBP ChIP–seq peaks and peaks for indicated histone modifications, column-normalized by ‘scale’ in the R heatmap function. b, c, Jaccard indexes between ChIP–seq peaks of different RBPs at promoter regions (bottom left) or non-promoter regions (top right) are displayed as heatmaps for HepG2 (b) and K562 cells (c). d, A representative genomic region showing eCLIP and ChIP–seq signal for HNRNPK, PCBP2 and PCBP1 proteins in HepG2 cells. One replicate is shown; similar results were observed in a second biological replicate. e, Left, heatmap indicates the fraction of genes (extended 500 nt upstream of the TSS and 500 nt downstream of the TTS) overlapped by a ChIP–seq peak for each RBP for the set of genes in seven bins of increasing gene expression from RNA-seq (x-axis) in HepG2 cells. Middle, right, bars indicate the mean odds ratio for overlap between RBP ChIP–seq peak presence and differentially expressed genes (middle) or significant alternative splicing changes (right) upon knockdown of the same RBP relative to 100 random samplings of genes with similar expression levels. *P < 0.05 as determined by 100 random samplings of genes with similar expression levels, with no adjustment for multiple hypotheses.
Extended Data Fig. 10
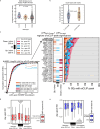
Extended Data Fig. 10. eCLIP binding patterns in subcellular space.
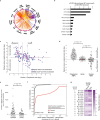
a, Circos plot with lines indicating co-observed localization patterns (red, within cytoplasm; purple, within nucleus; orange, between cytoplasm and nucleus). b, Fold enrichment for the 45S ribosomal RNA precursor observed for eight RBPs with eCLIP data, nucleolar localization observed in immunofluorescence imaging, and no human RNA processing function identified in literature searches. c, Points indicate nuclear versus cytoplasmic ratio from immunofluorescence imaging (x-axis) versus ratio of spliced versus unspliced exon junction reads (y-axis), normalized to paired input. RBPs profiled by eCLIP and immunofluorescence in HepG2 cells are indicated in blue, and RBPs profiled by eCLIP in K562 cells (in purple) were paired with immunofluorescence experiments performed in Hela cells. eCLIP data shown are from replicate 1. d, As in c, with RBPs separated into nuclear (nuclear:cytoplasmic ratio ≥ 2; n = 48) and cytoplasmic (nuclear:cytoplasmic ratio ≤ 0.5; n = 31) RBPs along with inputs (n = 160). Significance was determined by two-sided Kolmogorov–Smirnov test. Red line indicates mean, and violin plot indicates density of data sets (with kernel smoothing). eCLIP data shown are from replicate 1. e, Points indicate the number of differential splicing events observed upon knockdown of each RBP, separated by the presence or absence of localization in nuclear speckles (left, n = 56) or nuclear but not nuclear speckles (right, n = 41). Significance was determined by two-sided Kolmogorov–Smirnov test. f, Cumulative distribution curves indicate total relative information content for the mitochondrial genome for RBPs with mitochondrial localization by immunofluorescence (red, n = 13) and all other RBPs (grey, n = 78). Significance was determined by two-sided Kolmogorov–Smirnov test. g, Heatmap indicates DHX30 eCLIP enrichment across all exons for all mitochondrial protein-coding and rRNA transcripts.*Significant eCLIP signal (fold enrichment ≥ 4 and P ≤ 0.00001 in IP versus input determined by two-sided Fisher’s exact test (or Yates’s χ2 test where appropriate) with no hypothesis testing correction; Methods). eCLIP data are shown for replicate 1; a second replicate showed similar enrichment patterns.

References

    1. Gerstberger, S., Hafner, M. & Tuschl, T. A census of human RNA-binding proteins. Nat. Rev. Genet. 15, 829–845 (2014). - PMC - PubMed
    1. Licatalosi, D. D. et al. HITS-CLIP yields genome-wide insights into brain alternative RNA processing. Nature456, 464–469 (2008). - PMC - PubMed
    1. Lukong, K. E., Chang, K. W., Khandjian, E. W. & Richard, S. RNA-binding proteins in human genetic disease. Trends Genet. 24, 416–425 (2008). - PubMed
    1. Sonenberg, N., Morgan, M. A., Testa, D., Colonno, R. J. & Shatkin, A. J. Interaction of a limited set of proteins with different mRNAs and protection of 5′-caps against pyrophosphatase digestion in initiation complexes. Nucleic Acids Res. 7, 15–29 (1979). - PMC - PubMed
    1. Baltz, A. G. et al. The mRNA-bound proteome and its global occupancy profile on protein-coding transcripts. Mol. Cell46, 674–690 (2012). - PubMed

Publication types

MeSH terms