. 2020 Jul;583(7818):699-710.
doi: 10.1038/s41586-020-2493-4. Epub 2020 Jul 29.

Expanded encyclopaedias of DNA elements in the human and mouse genomes

ENCODE Project ConsortiumJill E Moore #  1 Michael J Purcaro #  1 Henry E Pratt #  1 Charles B Epstein #  2 Noam Shoresh #  2 Jessika Adrian #  3 Trupti Kawli #  3 Carrie A Davis #  4 Alexander Dobin #  4 Rajinder Kaul #  5   6 Jessica Halow #  5 Eric L Van Nostrand #  7 Peter Freese #  8 David U Gorkin #  9   10 Yin Shen #  10   11 Yupeng He #  12 Mark Mackiewicz #  13 Florencia Pauli-Behn #  13 Brian A Williams  14 Ali Mortazavi  15 Cheryl A Keller  16 Xiao-Ou Zhang  1 Shaimae I Elhajjajy  1 Jack Huey  1 Diane E Dickel  17 Valentina Snetkova  17 Xintao Wei  18 Xiaofeng Wang  19   20   21 Juan Carlos Rivera-Mulia  22   23 Joel Rozowsky  24 Jing Zhang  24 Surya B Chhetri  13   25 Jialing Zhang  26 Alec Victorsen  27 Kevin P White  28 Axel Visel  17   29   30 Gene W Yeo  7 Christopher B Burge  31 Eric Lécuyer  19   20   21 David M Gilbert  22 Job Dekker  32 John Rinn  33 Eric M Mendenhall  13   25 Joseph R Ecker  12   34 Manolis Kellis  2   35 Robert J Klein  36 William S Noble  37 Anshul Kundaje  3 Roderic Guigó  38 Peggy J Farnham  39 J Michael Cherry  40 Richard M Myers  41 Bing Ren  42   43 Brenton R Graveley  44 Mark B Gerstein  45 Len A Pennacchio  46   47   48 Michael P Snyder  49   50 Bradley E Bernstein  51 Barbara Wold  52 Ross C Hardison  53 Thomas R Gingeras  54 John A Stamatoyannopoulos  55   56   57 Zhiping Weng  58   59   60
Collaborators, Affiliations

Expanded encyclopaedias of DNA elements in the human and mouse genomes

ENCODE Project Consortium et al. Nature. 2020 Jul.

Erratum in

  • Author Correction: Expanded encyclopaedias of DNA elements in the human and mouse genomes.
    ENCODE Project Consortium; Moore JE, Purcaro MJ, Pratt HE, Epstein CB, Shoresh N, Adrian J, Kawli T, Davis CA, Dobin A, Kaul R, Halow J, Van Nostrand EL, Freese P, Gorkin DU, Shen Y, He Y, Mackiewicz M, Pauli-Behn F, Williams BA, Mortazavi A, Keller CA, Zhang XO, Elhajjajy SI, Huey J, Dickel DE, Snetkova V, Wei X, Wang X, Rivera-Mulia JC, Rozowsky J, Zhang J, Chhetri SB, Zhang J, Victorsen A, White KP, Visel A, Yeo GW, Burge CB, Lécuyer E, Gilbert DM, Dekker J, Rinn J, Mendenhall EM, Ecker JR, Kellis M, Klein RJ, Noble WS, Kundaje A, Guigó R, Farnham PJ, Cherry JM, Myers RM, Ren B, Graveley BR, Gerstein MB, Pennacchio LA, Snyder MP, Bernstein BE, Wold B, Hardison RC, Gingeras TR, Stamatoyannopoulos JA, Weng Z. ENCODE Project Consortium, et al. Nature. 2022 May;605(7909):E3. doi: 10.1038/s41586-021-04226-3. Nature. 2022. PMID: 35474001 Free PMC article. No abstract available.

Abstract

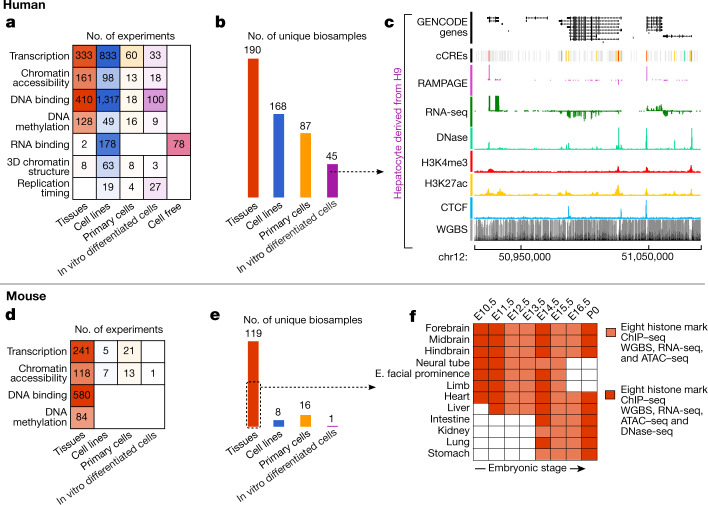
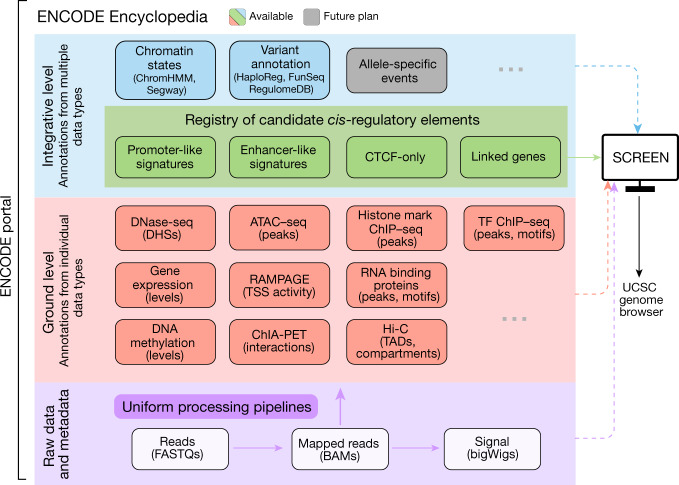
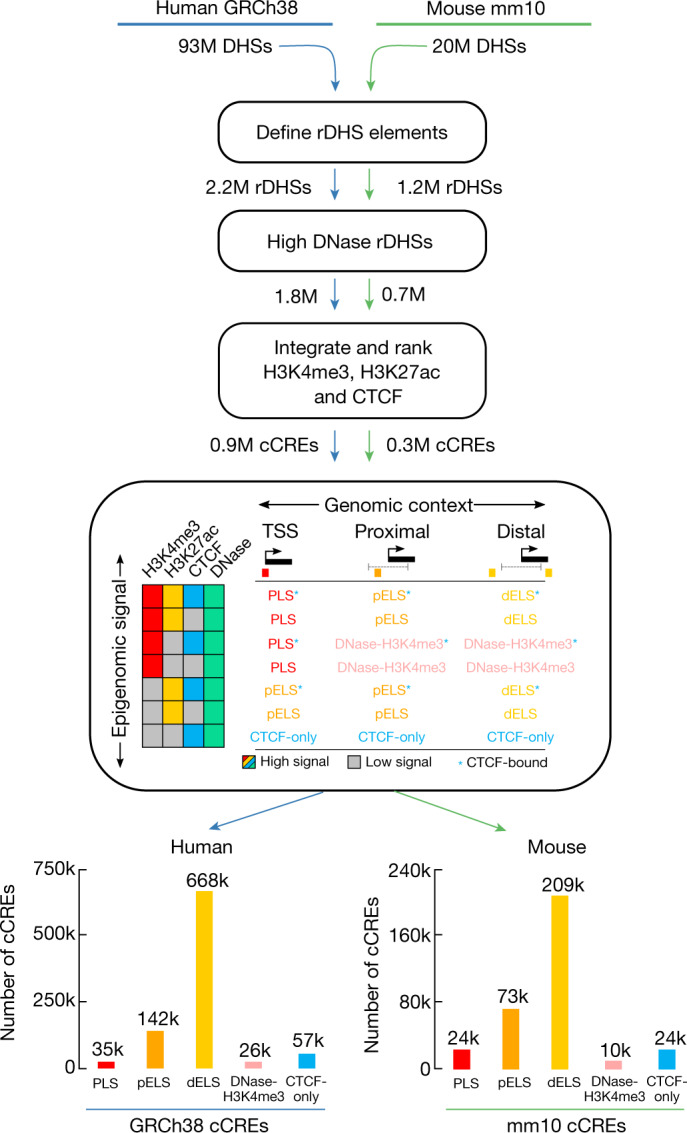
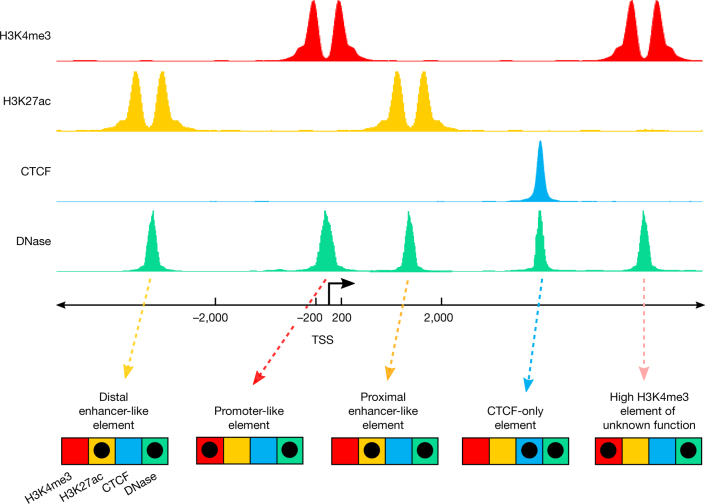
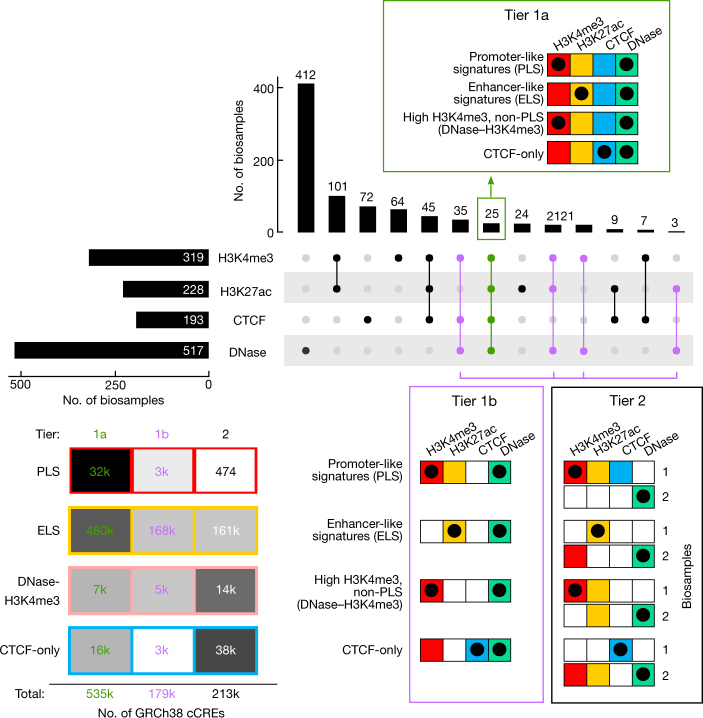
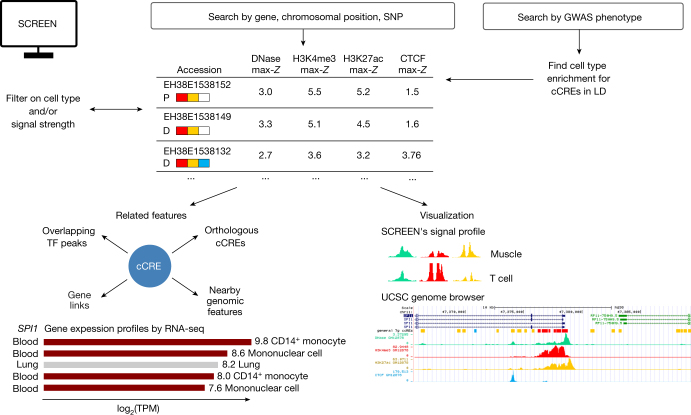
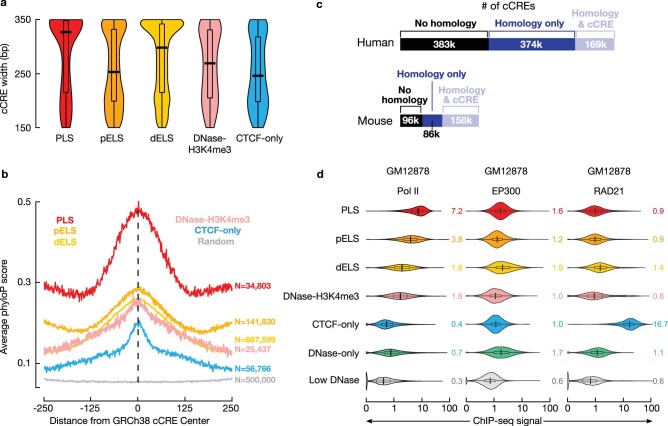
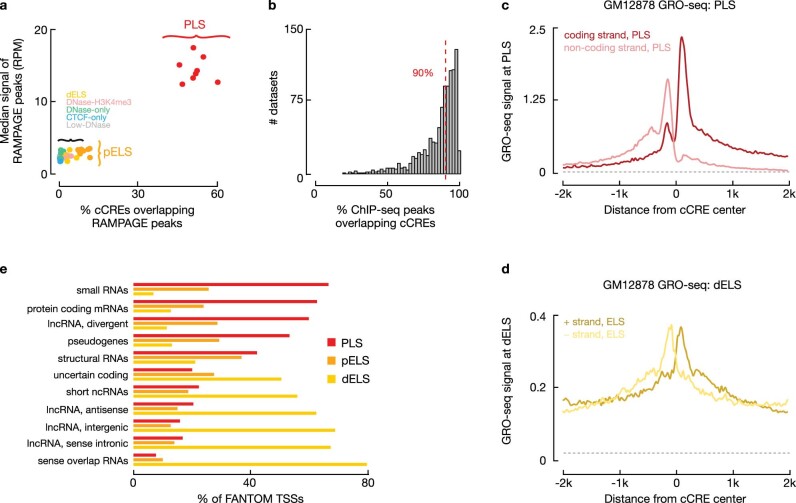
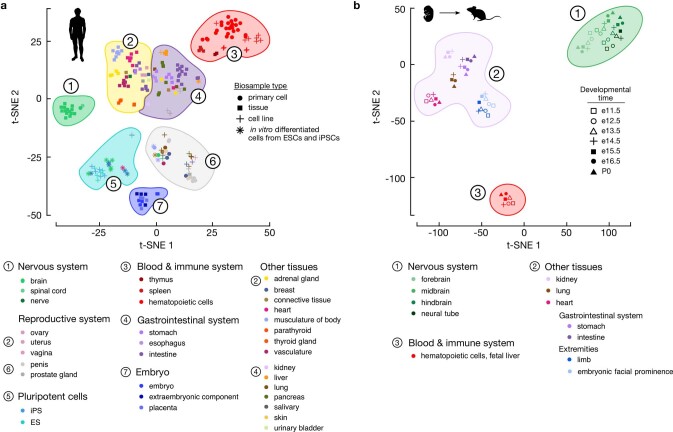
The human and mouse genomes contain instructions that specify RNAs and proteins and govern the timing, magnitude, and cellular context of their production. To better delineate these elements, phase III of the Encyclopedia of DNA Elements (ENCODE) Project has expanded analysis of the cell and tissue repertoires of RNA transcription, chromatin structure and modification, DNA methylation, chromatin looping, and occupancy by transcription factors and RNA-binding proteins. Here we summarize these efforts, which have produced 5,992 new experimental datasets, including systematic determinations across mouse fetal development. All data are available through the ENCODE data portal (https://www.encodeproject.org), including phase II ENCODE1 and Roadmap Epigenomics2 data. We have developed a registry of 926,535 human and 339,815 mouse candidate cis-regulatory elements, covering 7.9 and 3.4% of their respective genomes, by integrating selected datatypes associated with gene regulation, and constructed a web-based server (SCREEN; http://screen.encodeproject.org) to provide flexible, user-defined access to this resource. Collectively, the ENCODE data and registry provide an expansive resource for the scientific community to build a better understanding of the organization and function of the human and mouse genomes.


Conflict of interest statement

B.E.B. declares outside interests in Fulcrum Therapeutics, 1CellBio, HiFiBio, Arsenal Biosciences, Cell Signaling Technologies, BioMillenia, and Nohla Therapeutics. P. Flicek is a member of the Scientific Advisory Boards of Fabric Genomics, Inc. and Eagle Genomics, Ltd. M.P.S. is cofounder of Personalis, SensOmics, Mirvie, Qbio, January, Filtircine, and Genome Heart. He serves on the scientific advisory board of these companies and Genapsys and Jupiter. Z. Weng is a cofounder of Rgenta Therapeutics and she serves on its scientific advisory board. G.W.Y. is co-founder, member of the Board of Directors, on the SAB, equity holder, and paid consultant for Locana and Eclipse BioInnovations, and a visiting professor at the National University of Singapore. G.W.Y.’s interests have been reviewed and approved by the University of California, San Diego in accordance with its conflict of interest policies. E.L.V.N. is co-founder, member of the Board of Directors, on the SAB, equity holder, and paid consultant for Eclipse BioInnovations. E.L.V.N.’s interests have been reviewed and approved by the University of California, San Diego in accordance with its conflict of interest policies. B.R. is a co-founder and member of SAB of Arima Genomics, Inc. The authors declare no other competing financial interests.

Figures

Fig. 1
Fig. 1. ENCODE phase III data production.
Human (ac) and mouse (df) experiments performed during ENCODE phase III with data released on the ENCODE Portal, sorted by type of assay (a, d) or type of biosample (b, e). c, An illustrative human locus shows signals from several data types. f, The mouse fetal developmental matrix shows the tissues and stages at which epigenetic features and transcriptomes were assayed.
Fig. 2
Fig. 2. Overview of the ENCODE Encyclopedia with a registry of candidate cis-regulatory elements.
The ENCODE Encyclopedia consists of ground-level and integrative-level annotations that use data processed by the uniform processing pipelines. SCREEN integrates all levels of annotations and raw data and allows users to visualize them in the UCSC genome browser.
Fig. 3
Fig. 3. Selection and classification of cCREs to build the registry of candidate cis-regulatory elements.
We began by filtering and clustering DNase peaks to create representative DHSs (rDHSs). We then selected those rDHSs with high DNase signal (maximal Z-score or max-Z across all biosamples with data; see Methods) and high signal for at least one other assay (H3K4me3, H3K27ac or CTCF) to be cCREs. In total, we defined 926,535 cCREs in human and 339,815 cCREs in mouse. On the basis of combinations of signal and genomic context, we classified cCREs into one of these groups: PLS, pELS, dELS, DNase–H3K4me3, or CTCF-only, and their counts are indicated (k, thousand; M, million). Human and mouse silhouettes were adapted under Public Domain Mark 1.0 and Public Domain Dedication 1.0 licenses, respectively.
None
Box 1 Fig. 1 | Classification of cCREs by epigenetic signatures and proximity to TSS.
The pertinent ChIP–seq data for each classification assignment is depicted as idealized signal tracks above the genomic-location scale focused on a transcription start site (TSS) of a GENCODE-annotated gene. A diagram depicting feature ascertainment (coloured boxes) and high signals (black dots) is shown below the scale.
None
Box 1 Fig. 2 | Profiles of feature ascertainment across biosamples and confidence tiers for cCREs.
Top, upset plot showing the numbers of biosamples with the set of feature determinations indicated below the plot. Group and tier assignments are shown by matrices of feature determination and an indication of whether a high signal was observed, using conventions defined in Box 1 Fig. 1. The matrix for tier 1a is within the upset plot, and those for tiers 1b and 2 are below the plot. Assessment of tier 2 requires examination of data for two biosamples, indicated to the right of the matrices. The heatmap in the lower left shows the numbers of cCREs in each group and tier.
Fig. 4
Fig. 4. Experimental testing of cCRE activity in transgenic mouse assays and by comparison with public MPRA and SuRE data.
a, The rates at which the 151 predicted enhancers (each centred on a cCRE-dELS) showed activity in transient transgenic mouse assays, stratified by their prediction ranks in each tissue. The lower, darker bars indicate that activity was detected in the predicted tissue, and the upper, lighter bars indicate that activity was detected in other tissues but not the predicted tissue. b, Four predicted enhancers that were shown to be active by transgenic mouse assay. Predicted enhancers (tested regions shown in dashed horizontal lines between vertical lines) and nearby cCREs (yellow, green, and grey boxes indicate cCRE-dELSs, DNase-only cCREs, and low-DNase cCREs, respectively, in the corresponding tissues) are depicted alongside DNase signal (green) and H3K27ac signal (yellow) in forebrain (Fb), midbrain (Mb), hindbrain (Hb), limb (Lm), and heart (Ht). Stained embryo images reveal the tissues in which each predicted enhancer tested as active. The two predicted hindbrain enhancers were active in additional brain regions (mm1444 in hindbrain and midbrain; mm1489 in hindbrain, midbrain, and neural tube). H3K27ac signal profiles across tissues accurately predicted additional observed activity in related tissues. Overall positive testing rates: mm1502, 3/3 embryos; mm1444, 7/9; mm1492, 5/5; mm1489, 5/5. c, Percentages of regions that tested positive or negative for enhancer activity by MPRA in lymphoblastoid cell lines (MPRA-positive, filled bars; MPRA-negative, white bars). The bars from top to bottom indicate all tested regions, only those tested regions overlapping cell type-agnostic cCREs, and only those tested regions overlapping cCREs identified in GM12878 cells, partitioned by cCRE group. d, Percentages of genomic positions tested by the Survey of Regulatory Elements (SuRE) assay for promoter activity in K562 cells (SuRE-positive, filled bars; SuRE-negative, white bars). The bars from top to bottom indicate all genomic positions (SuRE is a genome-wide assay), positions that overlap cell type-agnostic cCREs, and positions that overlap cCREs identified in K562 cells, partitioned by cCRE group.
None
Box 2 Fig. 1 |
The SCREEN resource provides multiple applications with which to interrogate cCREs, gene expression patterns, and GWAS variants.
Extended Data Fig. 1
Extended Data Fig. 1. Classification of human cCREs is largely consistent across biosamples.
a, b, For the 25 human (a) and 15 mouse (b) biosamples that were covered by all four core assays, we analysed how cCRE classification could differ between biosamples. For each cell-type-agnostic group of cCREs, the bars indicate their group classification in specific biosamples, coloured by group as indicated. Black indicates a switch in the grouping, for example, from cell type-agnostic PLS to cell type-specific pELS or CTCF-only. c, d, Two example switches of cCRE grouping between different biosamples. c, EH38E2652345 is a cCRE-dELS that has high DNase, H3K4me3, and H3K27ac signals in bipolar spindle neurons. By contrast, in cell types at earlier stages of neuronal differentiation, such as embryonic stem cells, iPSCs, and neural progenitor cells, this cCRE only has high DNase and H3K4me3 signals, suggesting that in these cell types the cCRE may be a poised enhancer. d, EH38E2459760 is a cCRE-dELS that has high DNase, H3K27ac, and CTCF signals in H1-hESCs and iPSCs. However, in further differentiated cell types such as neural progenitors and bipolar spindle neurons, the H3K27ac signal decreases while the CTCF signal remains, and accordingly, EH38E2459760 is classified as a CTCF-only cCRE. In c and d, cCRE colours correspond to group classification defined in a and b. Grey cCREs have low DNase signals.
Extended Data Fig. 2
Extended Data Fig. 2. General properties of cCREs.
a, Distributions of GRCh38 cCRE width in base pairs stratified by group classification. b, Average phyloP score in the ± 250 bp from the centre of each cCRE stratified by cell type-agnostic cCRE group: PLS (red), pELS (orange), dELS (yellow), DNase-H3K4me3 (pink), and CTCF-only (blue). In grey are 500,000 300-bp control regions randomly selected from mappable regions of the human genome. c, Fractions of human and mouse cCREs with homology in the other species. In black (no homology) are cCREs that do not map to the other genome. In dark blue (homology only) are cCREs that map to the other genome but do not overlap a cCRE in that genome. In light blue (homology & cCRE) are cCREs that map to cCREs in the other genome, which then reciprocally map back to the original genome. d, Transcription factor ChIP–seq signals support the group classification of cCREs. Violin plots show the average Pol II, EP300, and RAD21 ChIP–seq signals for cCREs belonging to each cCRE group, along with values indicating median signal levels. All ChIP–seq data and cCREs are in GM12878 cells. Colours of violins indicate cCRE groups (PLS, red, N = 17,119; pELS, orange, N = 29,435; dELS, yellow, N = 28,594; DNase-H3K4me3, pink, N = 7,298; CTCF-only, blue, N = 11,355; DNase-only, green, N = 9,394; low-DNase, grey, N = 823,340). Boxplots inside violins display median and first and third quartiles.
Extended Data Fig. 3
Extended Data Fig. 3. Summary of transcription and transcription factor binding at cCREs.
a, Scatterplot depicting percent overlap of various groups of cCREs with RAMPAGE peaks in eight biosamples with matching data vs. the median expression level (in RPM) of the overlapping RAMPAGE peaks. b, The vast majority of high-quality ChIP–seq peaks of chromatin-associated proteins (mostly transcription factors) overlap cell type-agnostic cCREs. The median overlap is 90% across all ChIP–seq experiments. c, d, GRO-seq signal in GM12878 averaged over all cCRE-PLSs (c, in red) and cCRE-dELSs (d, in yellow) in a ± 2 kb window around cCRE centres. The GRO-seq signals around cCRE-PLSs were grouped by the orientation of their associated genes. The GRO-seq signals around cCRE-dELSs were grouped by genomic strands. Genomic background signal, computed as described in Supplementary Methods, is shown by the grey dashed lines and was approximately 0.02 for both strands in GM12878. e, Percentages of the transcription start sites of FANTOM CAGE-associated transcripts in the eleven FANTOM-defined categories that overlap cCRE-PLSs (red), cCRE-pELSs (orange), or cCRE-dELSs (yellow). The TSSs of the majority of coding-associated transcripts (protein-coding mRNA and divergent lncRNAs) overlapped a cCRE-PLS, while the TSSs of the majority of eRNA-like noncoding RNAs (short ncRNAs, antisense lncRNAs, intergenic lncRNAs, sense intronic lncRNAs, and sense overlap RNAs) overlapped a cCRE-dELS.
Extended Data Fig. 4
Extended Data Fig. 4. t-SNE analysis of human and mouse biosamples based on the H3K27ac signals at their cCREs.
To investigate the relationship among biosamples and their tissues or cell types of origin, we performed t-SNE based on the H3K27ac signal at the cCRE-dELSs (human: 667,599 and mouse: 209,041) across all biosamples (human: 228 and mouse: 66). a, Human biosamples formed seven main clusters as determined by K-means clustering. Cluster 1 comprises adult brain tissues and embryonic neurospheres. Cluster 2 comprises tissues from the adrenal gland, heart, leg muscle, and muscular samples of the gastrointestinal (GI) system. Cluster 3 comprises haematopoietic cells and immune tissues including the spleen and thymus. Cluster 4 comprises tissue but those without strong muscle components such as kidney, liver, and mucosa of the gastrointestinal system. Cluster 5 comprises embryonic stem cells, induced pluripotent stem cells and in vitro differentiated cells from these pluripotent cell types. This cluster also includes two outliers, A673 and SK-N-MC cell lines. Cluster 6 comprises a mixture of cell lines and primary cells. Cluster 7 comprises tissues from embryonic structures such as the placenta and chorion. b, The mouse developmental tissue samples formed three large clusters: brain, liver (hepatic plus fetal haematopoietic systems), and other tissues, with related tissues cluster together, and several tissues (for example, the four brain regions, face, and limb) display a time-course dependent arrangement of the samples.

References

    1. ENCODE Project Consortium. An integrated encyclopedia of DNA elements in the human genome. Nature489, 57–74 (2012). - PMC - PubMed
    1. Roadmap Epigenomics Consortium et al. Integrative analysis of 111 reference human epigenomes. Nature518, 317–330 (2015). - PMC - PubMed
    1. ENCODE Project Consortium. The ENCODE (ENCyclopedia Of DNA Elements) Project. Science306, 636–640 (2004). - PubMed
    1. The ENCODE Project Consortium. Identification and analysis of functional elements in 1% of the human genome by the ENCODE pilot project. Nature447, 799–816 (2007). - PMC - PubMed
    1. ENCODE Project Consortium. A user’s guide to the encyclopedia of DNA elements (ENCODE). PLoS Biol. 9, e1001046 (2011). - PMC - PubMed

Publication types

MeSH terms

Grants and funding