. 2020 Jun 23:18:202-214.
doi: 10.1016/j.omto.2020.06.018. eCollection 2020 Sep 25.

Route of 41BB/41BBL Costimulation Determines Effector Function of B7-H3-CAR.CD28ζ T Cells

Affiliations

Route of 41BB/41BBL Costimulation Determines Effector Function of B7-H3-CAR.CD28ζ T Cells

Phuong Nguyen et al. Mol Ther Oncolytics. .

Abstract

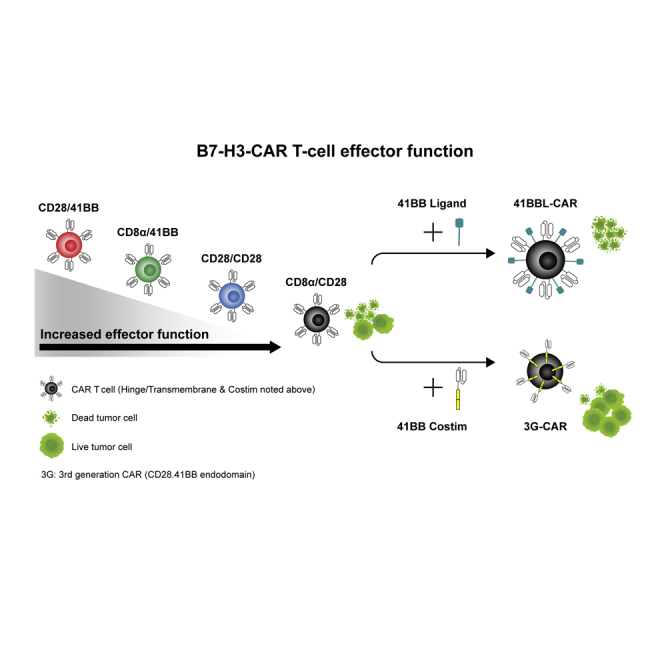
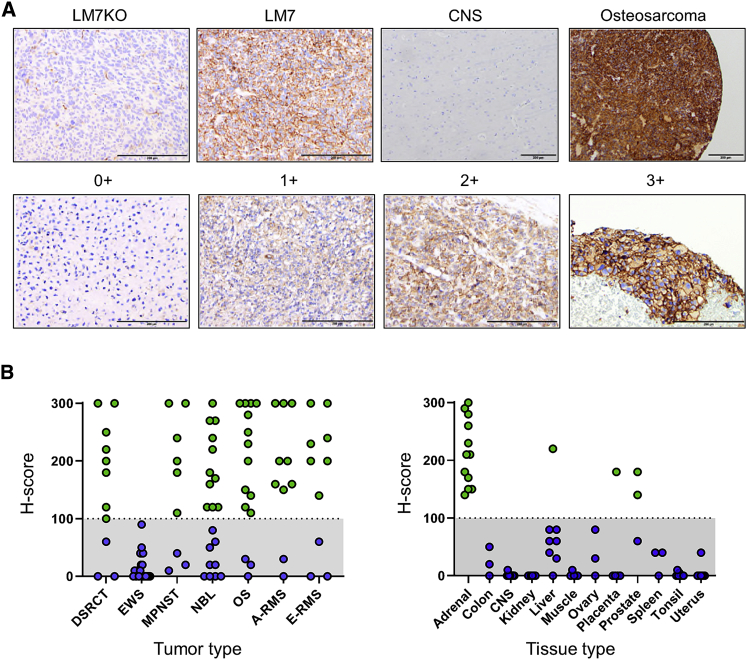
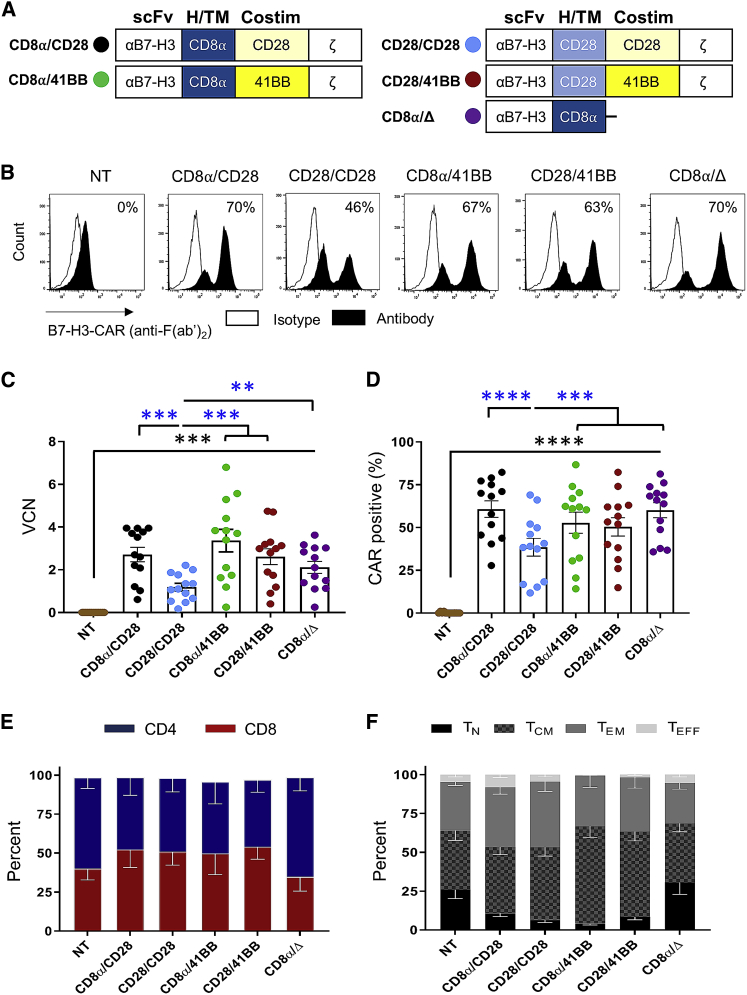
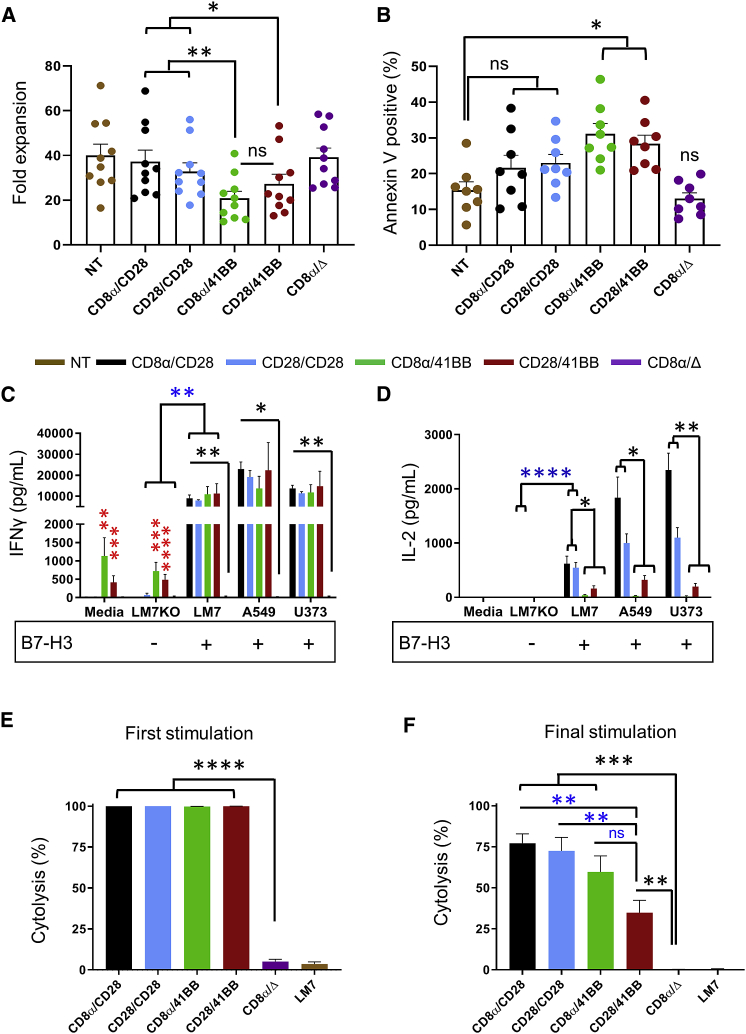
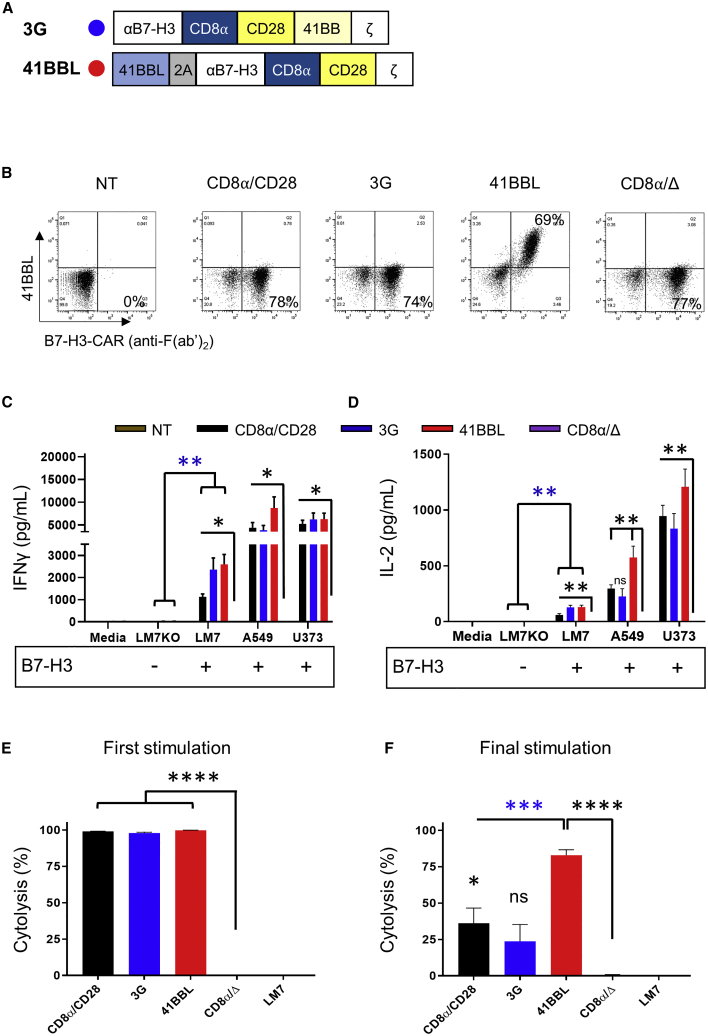
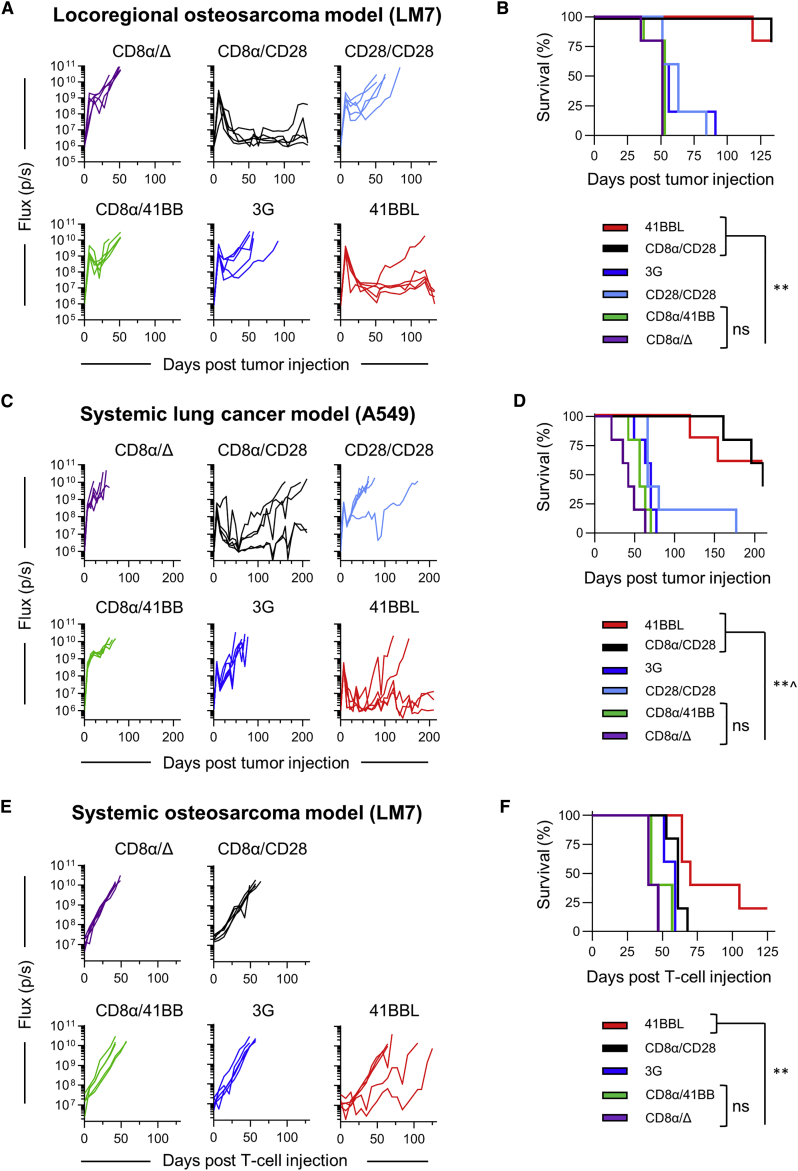
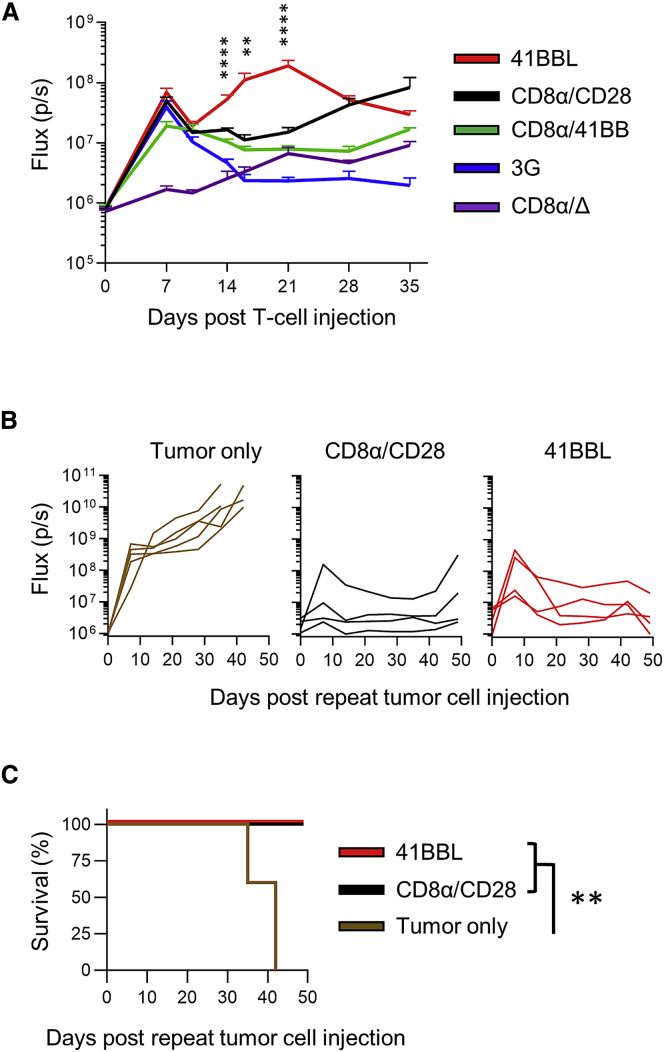
B7-H3 is actively being explored as an immunotherapy target for pediatric patients with solid tumors using monoclonal antibodies or T cells expressing chimeric antigen receptors (CARs). B7-H3-CARs containing a 41BB costimulatory domain are currently favored by several groups based on preclinical studies. In this study, we initially performed a detailed analysis of T cells expressing B7-H3-CARs with different hinge/transmembrane (CD8α versus CD28) and CD28 or 41BB costimulatory domains (CD8α/CD28, CD8α/41BB, CD28/CD28, CD28/41BB). Only subtle differences in effector function were observed between CAR T cell populations in vitro. However, CD8α/CD28-CAR T cells consistently outperformed other CAR T cell populations in three animal models, resulting in a significant survival advantage. We next explored whether adding 41BB signaling to CD8α/CD28-CAR T cells would further enhance effector function. Surprisingly, incorporating 41BB signaling into the CAR endodomain had detrimental effects, while expressing 41BBL on the surface of CD8α/CD28-CAR T cells enhanced their ability to kill tumor cells in repeat stimulation assays. Furthermore, 41BBL expression enhanced CD8α/CD28-CAR T cell expansion in vivo and improved antitumor activity in one of four evaluated models. Thus, our study highlights the intricate interplay between CAR hinge/transmembrane and costimulatory domains. Based on our study, we selected CD8α/CD28-CAR T cells expressing 41BBL for early phase clinical testing.

Keywords: B7-H3; CAR; CD276; Chimeric antigen receptor; T cell; pediatric; solid tumor.


Figures

None
Graphical abstract
Figure 1
Figure 1
IHC for B7-H3 on Pediatric Solid Tumors and Normal Adult Tissues Pediatric solid tumors and normal tissues were evaluated for B7-H3 expression by IHC. (A) Representative images for LM7KO (B7-H3−/−) and LM7 (B7-H3+/+) tumors, CNS tissue, and osteosarcoma. Staining intensity: 0+, no staining; 1+, weak positive; 2+, moderate positive; 3+, strong positive. Scale bars represent 200 μm. (B) H-scores for pediatric solid tumors (left panel) and normal tissues (right panel).
Figure 2
Figure 2
Transduction and Phenotypes of 2G B7-H3-CAR T Cells Activated T cells were transduced with LV particles encoding 2G B7-H3-CARs or a control CAR (CD8α/Δ). Vector copy number (VCN) was determined by digital droplet PCR. CAR surface expression was measured by flow cytometry. (A) Schematic representation of 2G CAR LVs. The color in the circle is used throughout to identify constructs. (B) Representative flow plots of non-transduced (NT) and transduced T cells. (C and D) VCN (C) and CAR (D) surface expression (N = 13; one-way ANOVA; black asterisks, comparison to NT T cells; blue asterisks, comparison between 2G CARs). (E and F) CD4/CD8 ratios (E) and memory phenotypes (F) (N = 5). Data, mean ± SEM. ∗∗p < 0.01, ∗∗∗p < 0.001, ∗∗∗∗p < 0.0001.
Figure 3
Figure 3
2G B7-H3-CAR T Cell Expansion, Basal Apoptosis, Cytokine Secretion, and Repeat Killing Capacity 2G B7-H3-CAR T cells were evaluated for in vitro expansion and effector function. (A) Expansion of NT and CAR T cells (N = 10). (B) Basal apoptosis of NT and CAR T cells. (C and D) IFNγ (C) and IL-2 (D) production after coculture with B7-H3-positive (LM7, A549, U373) or B7-H3-negative (LM7KO) tumor cells, or media alone. Media were collected after 24 h and cytokines were determined by ELISA (N = 4 in duplicate; blue asterisks, LM7KO versus LM7 for functional CARs; black asterisks, CD8α/Δ versus functional CARs; red asterisks, CD8α/41BB-CAR or CD28/41BB-CAR versus CD8α/Δ-CAR in media alone or coculture with LM7KO). (E and F) Repeat impedance-based cytotoxicity assay (xCELLigence) using LM7 cells as targets and CAR T cells as effectors (N = 5 in triplicate). (E and F) First (E) and final (F) stimulation (black asterisks, CD8α/Δ-CAR versus functional CARs; blue asterisks or ns, CD28/41BB-CAR versus other functional CARs). One-way ANOVA was used for all analyses except for blue asterisks in (C) and (D) (two-way ANOVA). Data, mean ± SEM. ∗p < 0.05, ∗∗p < 0.01, ∗∗∗p < 0.001, ∗∗∗∗p < 0.0001. ns, not significant.
Figure 4
Figure 4
Comparison of 2G-, 3G-, and 41BBL-CAR T Cell Effector Function In Vitro (A) Schematic representation of the B7-H3-CAR with a CD8α/CD28 backbone combined with a 41BB endodomain (3G) or surface 41BB ligand (41BBL). (B) Representative flow plots of NT and transduced T cells. (C and D) IFNγ (C) and IL-2 (D) production after coculture with B7-H3-positive (LM7, A549, U373) or B7-H3-negative (LM7KO) tumor cells, or media alone. Media were collected after 24 h and cytokines were determined by ELISA (N = 4 in duplicate; blue asterisks, LM7KO versus LM7 for functional CARs; black asterisks and ns, CD8α/Δ-CAR versus functional CARs). (E and F) Repeat impedance-based cytotoxicity assay (xCELLigence) using LM7 cells as targets and CAR T cells as effectors (N = 4 in triplicate). First (E) and final (F) stimulation (black asterisks and ns, CD8α/Δ-CAR versus functional CARs; blue asterisks, 41BBL-CAR versus other functional CARs). One-way ANOVA was used for all analyses except for blue asterisks in (C) and (D) (two-way ANOVA). Data, mean ± SEM. ∗p < 0.05, ∗∗p < 0.01, ∗∗∗p < 0.001, ∗∗∗∗p < 0.0001. ns, non-significant.
Figure 5
Figure 5
CD8α/CD28- and 41BBL-CAR T Cells Have Superior Antitumor Activity In Vivo (A and B) Mice were injected with 1 × 106 LM7.ffLuc (OS) cells i.p. on day 0, followed by 1 × 105 CAR or control (CD8α/Δ) T cells i.p. on day 7. Bioluminescent signal (flux = photons/s) over time (A) and Kaplan-Meier survival curve (B) are shown. (C and D) NSG mice were injected i.v. with 2 × 106 A549.ffLuc (lung cancer) on day 0, followed by 3 × 106 CAR or control T cells on day 7. Bioluminescent signal over time (C) and Kaplan-Meier survival curve (D) are shown. (E and F) Mice were injected with 2 × 106 LM7.ffLuc cells i.v. on day −28, followed by injection of 1 × 106 CAR or control T cells i.v. 28 days later (day 0). Bioluminescent signal over time (E) and Kaplan-Meier survival curve for injected mice (F) are shown. The log-rank (Mantel-Cox) test was used to determine statistical significance between survival curves for all experiments. N = 5 mice per group. ˆp = 0.0214 for 41BBL versus CD28/CD28, ∗∗p < 0.01. ns, not significant.
Figure 6
Figure 6
CAR T Cell Persistence and Repeat Tumor Challenge In Vivo (A) NSG mice were injected with 2 × 106 A549 cells i.v. on day −7, followed by 1 × 106 ffLuc-expressing CAR or control (CD8α/Δ) T cells i.v. 7 days later (day 0). The graph depicts the T cell bioluminescent signal (flux = photons/s) over time (N = 5 per group; one-way ANOVA at indicated time points; mean ± SEM). (B and C) Mice treated with CD8α/CD28- or 41BBL-CAR T cells survived long-term tumor-free in the locoregional LM7 model and were re-challenged (N = 4 per group) with a second i.p. dose of 1 × 106 LM7.ffLuc tumor cells 133 days after the initial tumor injection. Five mice without prior tumor or T cell injection received the same i.p. dose of LM7 cells as controls (tumor only). (B) Bioluminescent signal over time. (C) Kaplan-Meier survival curve after repeat tumor challenge. Survival data were analyzed using the log-rank (Mantel-Cox) test. ∗∗p < 0.01, ∗∗∗∗p < 0.0001.

References

    1. Ward E., DeSantis C., Robbins A., Kohler B., Jemal A. Childhood and adolescent cancer statistics, 2014. CA Cancer J. Clin. 2014;64:83–103. - PubMed
    1. Spraker-Perlman H.L., Barkauskas D.A., Krailo M.D., Meyers P.A., Schwartz C.L., Doski J., Gorlick R., Janeway K.A., Isakoff M.S. Factors influencing survival after recurrence in osteosarcoma: a report from the Children’s Oncology Group. Pediatr. Blood Cancer. 2019;66:e27444. - PMC - PubMed
    1. Lagmay J.P., Krailo M.D., Dang H., Kim A., Hawkins D.S., Beaty O., 3rd, Widemann B.C., Zwerdling T., Bomgaars L., Langevin A.M. Outcome of patients with recurrent osteosarcoma enrolled in seven phase II trials through Children’s Cancer Group, Pediatric Oncology Group, and Children’s Oncology Group: learning from the past to move forward. J. Clin. Oncol. 2016;34:3031–3038. - PMC - PubMed
    1. Stahl M., Ranft A., Paulussen M., Bölling T., Vieth V., Bielack S., Görtitz I., Braun-Munzinger G., Hardes J., Jürgens H., Dirksen U. Risk of recurrence and survival after relapse in patients with Ewing sarcoma. Pediatr. Blood Cancer. 2011;57:549–553. - PubMed
    1. Pappo A.S., Anderson J.R., Crist W.M., Wharam M.D., Breitfeld P.P., Hawkins D., Raney R.B., Womer R.B., Parham D.M., Qualman S.J., Grier H.E. Survival after relapse in children and adolescents with rhabdomyosarcoma: a report from the Intergroup Rhabdomyosarcoma Study Group. J. Clin. Oncol. 1999;17:3487–3493. - PubMed