. 2020 Oct;63(10):2205-2217.
doi: 10.1007/s00125-020-05230-4. Epub 2020 Jul 30.

Dimethyl-2-oxoglutarate improves redox balance and mitochondrial function in muscle pericytes of individuals with diabetes mellitus

Affiliations

Dimethyl-2-oxoglutarate improves redox balance and mitochondrial function in muscle pericytes of individuals with diabetes mellitus

Ashton Faulkner et al. Diabetologia. 2020 Oct.

Abstract

Aims/hypothesis: Treatment of vascular complications of diabetes remains inadequate. We reported that muscle pericytes (MPs) from limb muscles of vascular patients with diabetes mellitus display elevated levels of oxidative stress causing a dysfunctional phenotype. Here, we investigated whether treatment with dimethyl-2-oxoglutarate (DM-2OG), a tricarboxylic acid cycle metabolite with antioxidant properties, can restore a healthy metabolic and functional phenotype.

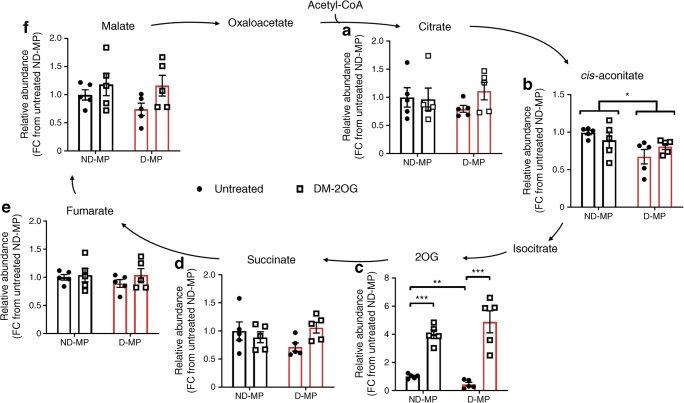
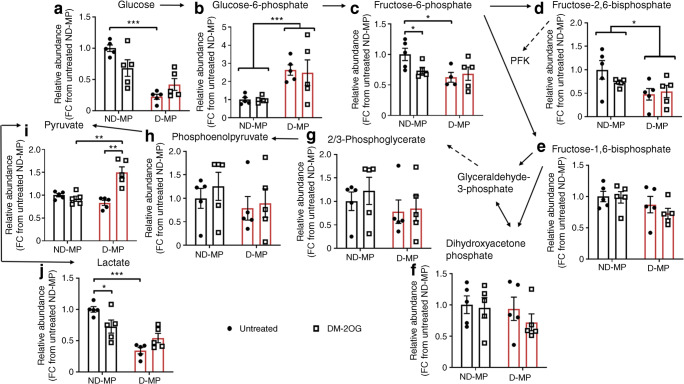
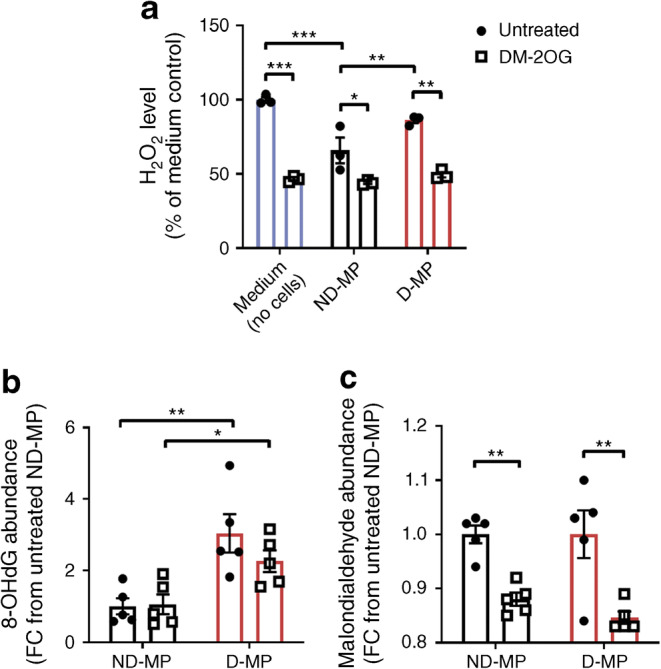
Methods: MPs were isolated from limb muscles of diabetes patients with vascular disease (D-MPs) and from non-diabetic control participants (ND-MPs). Metabolic status was assessed in untreated and DM-2OG-treated (1 mmol/l) cells using an extracellular flux analyser and anion-exchange chromatography-mass spectrometry (IC-MS/MS). Redox status was measured using commercial kits and IC-MS/MS, with antioxidant and metabolic enzyme expression assessed by quantitative RT-PCR and western blotting. Myogenic differentiation and proliferation and pericyte-endothelial interaction were assessed as functional readouts.

Results: D-MPs showed mitochondrial dysfunction, suppressed glycolytic activity and reduced reactive oxygen species-buffering capacity, but no suppression of antioxidant systems when compared with ND-MP controls. DM-2OG supplementation improved redox balance and mitochondrial function, without affecting glycolysis or antioxidant systems. Nonetheless, this was not enough for treated D-MPs to regain the level of proliferation and myogenic differentiation of ND-MPs. Interestingly, DM-2OG exerted a positive effect on pericyte-endothelial cell interaction in the co-culture angiogenesis assay, independent of the diabetic status.

Conclusions/interpretation: These novel findings support the concept of using DM-2OG supplementation to improve pericyte redox balance and mitochondrial function, while concurrently allowing for enhanced pericyte-endothelial crosstalk. Such effects may help to prevent or slow down vasculopathy in skeletal muscles of people with diabetes. Graphical abstract.

Keywords: 2-Oxoglutarate; Diabetes mellitus; Mitochondria; Pericytes; Redox; Vascular protection.


Figures

None
Graphical abstract
Fig. 1
Fig. 1
(a) Representative images of MitoTracker-stained cells showing that gross mitochondrial morphology is not different between ND- and D-MPs; scale bar, 20 μm. (b) Basal OCR is not different between untreated ND- and D-MPs but is significantly reduced in D-MPs supplemented with DM-2OG (1 mmol/l; 16 h). (c) Maximal OCR and (d) spare capacity OCR are lower in D-MPs with no effect of DM-2OG supplementation. (e) ATP-coupling efficiency is significantly lower in D-MPs and is partially improved following DM-2OG supplementation. (f) Mitochondrial proton leak is significantly higher in D-MPs and is restored towards the level of ND-MPs following supplementation with DM-2OG. (g) No change in relative mitochondrial DNA content was observed between ND- and D-MPs with or without DM-2OG treatment. Data are means (± SEM) of n = 3–4 for ND-MP and n = 3 for D-MP; *p < 0.05 as determined by two-way ANOVA followed by Tukey’s post-comparison test. Numbers above bars in (c, d) indicate p values. FC, fold change
Fig. 2
Fig. 2
ND- and D-MPs have similar levels of citrate (a), succinate (d), fumarate (e) and malate (f). D-MPs have significantly reduced levels of endogenous cis-aconitate (b) and 2OG (c) compared with ND-MPs. Supplementation with exogenous DM-2OG (1 mmol/l; 16 h) significantly increased the intracellular abundance of 2OG in both ND- and D-MPs without affecting other TCA cycle intermediates. Data represent means (± SEM) of n = 5; *p < 0.05, **p < 0.01, ***p < 0.001 as determined by two-way ANOVA followed by Student’s t test. FC, fold change
Fig. 3
Fig. 3
(a) ND- and D-MPs have greater levels of GLUT1 compared with GLUT4 at the mRNA level. (b) D-MPs have a significantly reduced level of GLUT1 mRNA expression compared with ND-MPs. Supplementation with DM-2OG (1 mmol/l; 16 h) significantly increases GLUT1 mRNA expression in D-MPs with no effect on ND-MPs. (c) LDHA mRNA expression is not significantly different between ND- and D-MPs with or without DM-20G supplementation. (d) Representative western blots showing GLUT1, LDHA and β-actin loading control (see ESM Fig. 7 for original unedited blots) and associated densitometry analysis showing that D-MPs have a significantly reduced expression of GLUT1 and LDHA protein compared with ND-MPs, with no significant effect of DM-2OG supplementation. Data are means (± SEM) of n = 3–4; *p < 0.05, **p < 0.01, ***p < 0.001 as determined by two-way ANOVA followed by Bonferroni’s post-comparison test. FC, fold change
Fig. 4
Fig. 4
Relative abundance of some glycolysis intermediates (aj) is significantly altered in D-MPs compared with ND-MPs, indicating reduced glycolytic activity. DM-2OG supplementation (1 mmol/l; 16 h) significantly reduces the abundance of fructose-6-phosphate (c) and lactate (j) in ND-MPs but increases pyruvate abundance (i) in D-MPs. Data represent means (± SEM) of n = 5; *p < 0.05, **p < 0.01, ***p < 0.001 as determined by two-way ANOVA followed by Student’s t test. FC, fold change; PFK, phosphofructokinase
Fig. 5
Fig. 5
(a) D-MPs have reduced H2O2 buffering activity compared with ND-MPs. Supplementation with DM-2OG (1 mmol/l; 16 h) significantly reduces medium H2O2 level under all experimental conditions. Data represent mean (± SEM) percentage of H2O2 level from untreated medium control; n = 3; *p < 0.05, **p < 0.01, ***p < 0.001 as determined by two-way ANOVA followed by Bonferroni’s post-comparison test. (b) D-MPs have significantly greater levels of 8-OHdG, a marker of oxidative DNA damage, with levels unaffected by DM-2OG supplementation. (c) DM-2OG supplementation significantly reduces the relative abundance of malondialdehyde, a marker of lipid peroxidation, in both ND- and D-MPs. For (b, c) data represent means (± SEM) of n = 5; *p < 0.05, **p < 0.01 as determined by two-way ANOVA followed by Student’s t test. FC, fold change
Fig. 6
Fig. 6
(a) CAT and (b) HMOX1 mRNA expression do not differ between ND- and D-MPs or following supplementation with DM-2OG (1 mmol/l; 16 h). Data represent means (± SEM) from n = 3. (c) Representative western blot and associated densitometry analysis showing that HO-1 protein, but not catalase, is significantly increased in D-MPs with no effect of DM-2OG supplementation. Data represent means (± SEM) from n = 4 for ND-MP and n = 3 for D-MP; *p < 0.05 as determined by two-way ANOVA followed by Bonferroni’s post-comparison test. See ESM Fig. 7 for original unedited blots. (d) GCLC mRNA expression is significantly higher in D-MPs, with no effect of DM-2OG supplementation. Data represent means (± SEM) from n = 4; *p < 0.05 as determined by two-way ANOVA followed by Bonferroni’s post-comparison test. (e) IC-MS/MS (n = 5) and (f) GSH-Glo assay (n = 3) analysis showing that total GSH is significantly higher in D-MPs, with no effect of DM-2OG supplementation. (g) The GSH/GSSG ratio (n = 3) is not significantly different between ND- and D-MPs or following supplementation with DM-2OG. For (eg) data represent means (± SEM); *p < 0.05, **p < 0.01 as determined by two-way ANOVA. FC, fold change
Fig. 7
Fig. 7
(a) D-MPs show significantly reduced proliferation over 72 h compared with ND-MPs. Supplementation with DM-2OG (1 mmol/l; 72 h) significantly reduces proliferation of ND- but not D-MPs. Data represent means (± SEM) fold-change in BrdU incorporation from n = 3; *p < 0.05 as determined by two-way ANOVA followed by Tukey’s post-comparison test. (b) Analysis and (c) representative immunofluorescence images (scale bar, 50 μm) showing that D-MPs have reduced propensity to differentiate down the myogenic lineage compared with ND-MPs at 7 days, with no effect of DM-2OG supplementation. Data represent means (± SEM) percentage of nuclei associated with positive MyHC staining (green) from n = 2; ***p < 0.001 as determined by two-way ANOVA followed by Bonferroni’s post-comparison test. FC, fold change
Fig. 8
Fig. 8
No significant difference was observed between wells containing ND- or D-MPs with regard to the mean number of branches (a) or mean branch diameter (b) formed by HUVECs in the 3D angiogenesis assay. (c) Quantification and (d) representative immunofluorescence images (scale bar, 50 μm) showing that the mean distance between pericytes (red; DiI) and HUVEC branches (green; PECAM) is significantly greater in wells containing D-MPs compared with ND-MPs and is significantly reduced when supplemented with DM-2OG (1 mmol/l; 7 days). Data represent means (± SEM) from n = 3; *p < 0.05, **p < 0.01 as determined by two-way ANOVA followed by Bonferroni’s post-comparison test

References

    1. Saeedi P, Petersohn I, Salpea P, et al. Global and regional diabetes prevalence estimates for 2019 and projections for 2030 and 2045: Results from the International Diabetes Federation Diabetes Atlas, 9th edition. Diabetes Res Clin Pract. 2019;157:107843. doi: 10.1016/j.diabres.2019.107843. - DOI - PubMed
    1. Fowkes FGR, Rudan D, Rudan I, et al. Comparison of global estimates of prevalence and risk factors for peripheral artery disease in 2000 and 2010: a systematic review and analysis. Lancet. 2013;382(9901):1329–1340. doi: 10.1016/S0140-6736(13)61249-0. - DOI - PubMed
    1. Spreen MI, Gremmels H, Teraa M, et al. Diabetes is associated with decreased limb survival in patients with critical limb ischemia: pooled data from two randomized controlled trials. Diabetes Care. 2016;39(11):2058–2064. doi: 10.2337/dc16-0850. - DOI - PubMed
    1. Cappellari O, Cossu G. Pericytes in development and pathology of skeletal muscle. Circ Res. 2013;113(3):341–347. doi: 10.1161/CIRCRESAHA.113.300203. - DOI - PubMed
    1. Birbrair A, Zhang T, Wang Z-M, Messi ML, Mintz A, Delbono O. Pericytes: multitasking cells in the regeneration of injured, diseased, and aged skeletal muscle. Front Aging Neurosci. 2014;6:245. doi: 10.3389/fnagi.2014.00245. - DOI - PMC - PubMed

Publication types

MeSH terms