. 2020 Nov;11(11):809-824.
doi: 10.1007/s13238-020-00740-8. Epub 2020 Jul 29.

Generation of a Hutchinson-Gilford progeria syndrome monkey model by base editing

Affiliations

Generation of a Hutchinson-Gilford progeria syndrome monkey model by base editing

Fang Wang et al. Protein Cell. 2020 Nov.

Abstract

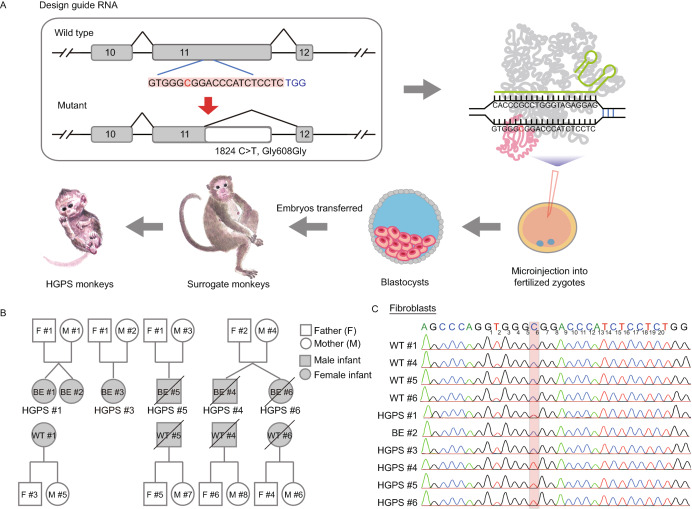
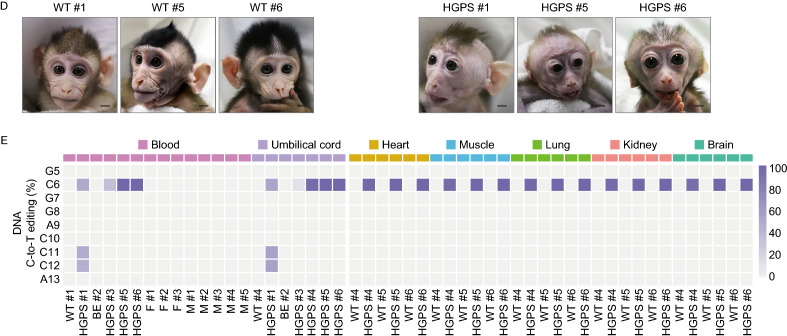
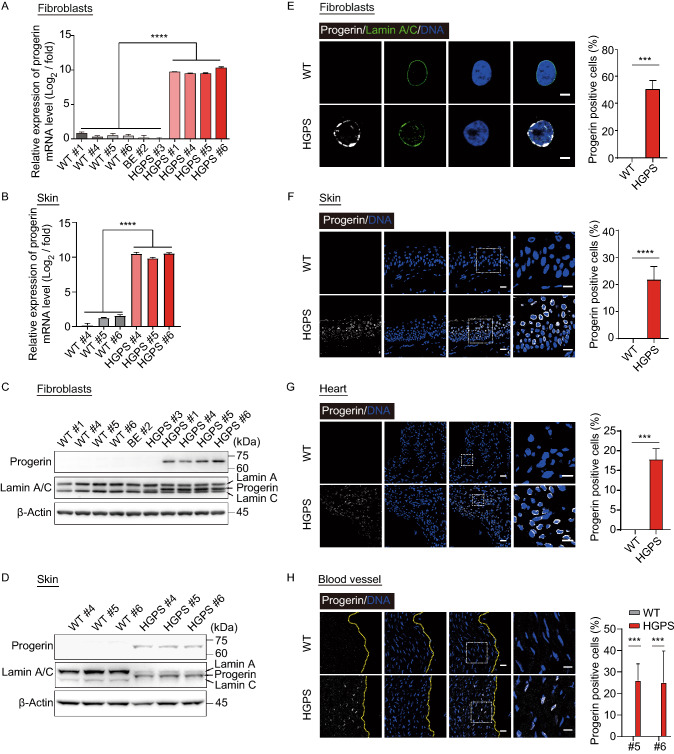
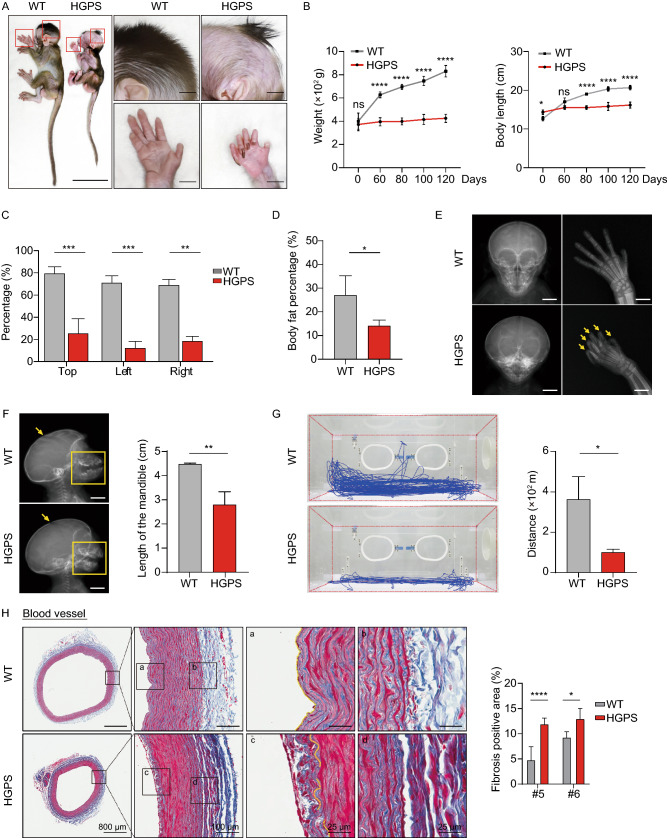
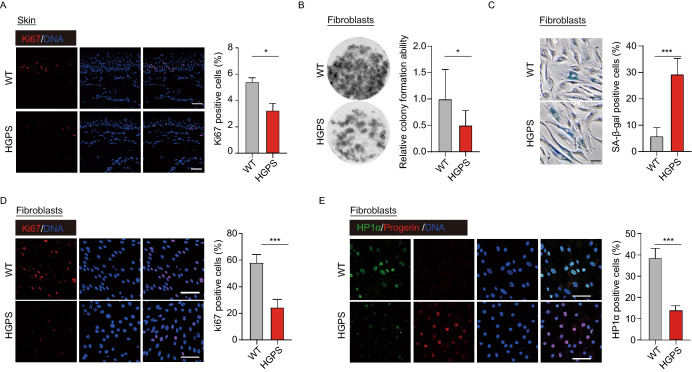
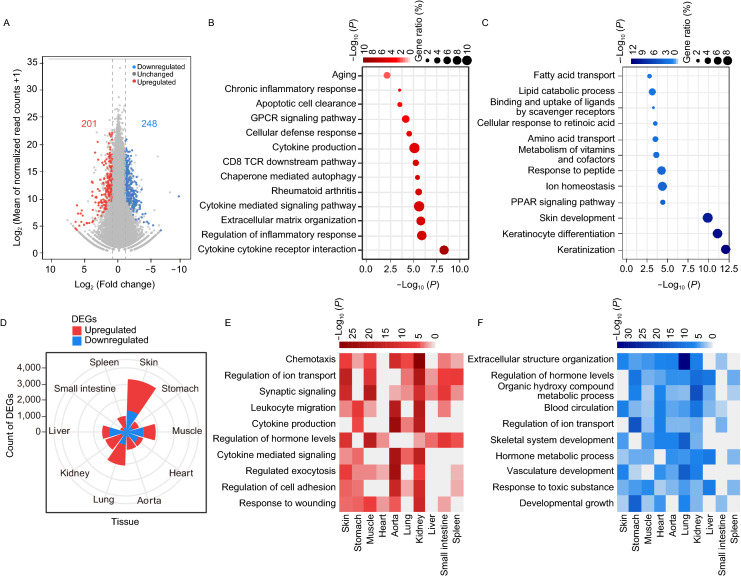
Many human genetic diseases, including Hutchinson-Gilford progeria syndrome (HGPS), are caused by single point mutations. HGPS is a rare disorder that causes premature aging and is usually caused by a de novo point mutation in the LMNA gene. Base editors (BEs) composed of a cytidine deaminase fused to CRISPR/Cas9 nickase are highly efficient at inducing C to T base conversions in a programmable manner and can be used to generate animal disease models with single amino-acid substitutions. Here, we generated the first HGPS monkey model by delivering a BE mRNA and guide RNA (gRNA) targeting the LMNA gene via microinjection into monkey zygotes. Five out of six newborn monkeys carried the mutation specifically at the target site. HGPS monkeys expressed the toxic form of lamin A, progerin, and recapitulated the typical HGPS phenotypes including growth retardation, bone alterations, and vascular abnormalities. Thus, this monkey model genetically and clinically mimics HGPS in humans, demonstrating that the BE system can efficiently and accurately generate patient-specific disease models in non-human primates.

Keywords: HGPS; base editing; non-human primate.


Figures

Figure 1
Figure 1
Generation of HGPS monkeys. (A) The schematic showed the process of generating HGPS monkeys. (B) Family tree of all monkeys used in this study. Black slash indicated that the monkey was dead (HGPS #4 died before the caesarean operation. HGPS #5 and HGPS #6 died when they were five months old.). (C) Sequencing of the sgRNA-targeted regions in the LMNA gene of fibroblasts from WT monkeys and HGPS monkeys. (D) Photographs of WT monkeys and HGPS monkeys when they were 3-months old. Scale bar, 0.83 cm. (E) Heat maps showed on-target editing efficiencies in various tissues of each monkey
Figure 1
Figure 1
Generation of HGPS monkeys. (A) The schematic showed the process of generating HGPS monkeys. (B) Family tree of all monkeys used in this study. Black slash indicated that the monkey was dead (HGPS #4 died before the caesarean operation. HGPS #5 and HGPS #6 died when they were five months old.). (C) Sequencing of the sgRNA-targeted regions in the LMNA gene of fibroblasts from WT monkeys and HGPS monkeys. (D) Photographs of WT monkeys and HGPS monkeys when they were 3-months old. Scale bar, 0.83 cm. (E) Heat maps showed on-target editing efficiencies in various tissues of each monkey
Figure 2
Figure 2
Expression of progerin in fibroblasts and skin of HGPS monkeys. (A and B) Quantitative analysis of progerin mRNA expression in the fibroblasts (A) and skin (B) of WT and HGPS by qPCR. The data from the HGPS monkeys were normalized to the corresponding data obtained from the WT monkeys. Data shown as mean ± SD, n = 4 wells per condition, ****P < 0.0001 (t-test). (C and D) Western blots showed the expression of progerin in the fibroblasts (C) and skin (D) of HGPS monkeys. For uncropped gels, refer to Source Data. (E–H) Immunofluorescence staining showed the expression of the progerin in the fibroblasts (E), skin (F), heart (G), and aorta (H) of HGPS monkeys. Right panels: the percentages of progerin positive cells. Scale bar, 25 μm, (zoom: 10 μm). Data are mean ± SD. n = 3 monkeys (WT #4, #5, #6 versus HGPS #4, #5, #6) for (E–G) and n = 2 monkeys (WT #5, #6 versus HGPS #5, #6) for (H). ***P < 0.001, ****P < 0.0001 (t-test for E, F, G and one-way ANOVA for H)
Figure 3
Figure 3
HGPS monkeys exhibited clinical features of HGPS children. (A) Representative photographs showing the appearance of WT monkey (WT #6) and HGPS monkey (HGPS #6) at 87 days of age. The typical phenotypes of growth retardation, bone abnormalities, and hair loss were overserved in HGPS monkeys. Scale bar: left panel, 9 cm; right panels, 4.5 cm. (B) Body weight and length of WT and HGPS monkeys after birth. Data are displayed as mean ± SD, n = 3 (WT #1, #5, #6 versus HGPS #1, #5, #6), nsP > 0.5, *P < 0.5, ****P < 0.0001 (two-way ANOVA). (C) Quantitative analysis of hair loss in WT monkeys and HGPS monkeys at 100 days of age. The percentage of the area with hair was calculated in the top, left, and right side of the monkey head. Data were presented as mean ± SD, n = 3 (WT #1, #5, #6 versus HGPS #1, #5, #6), **P < 0.01, ****P < 0.0001 (one-way ANOVA). (D) Body fat percentage of HGPS monkeys and WT monkeys measured by dual-energy X-ray absorptiometry (DXA). Data were presented as mean ± SD, n = 3 or 5 (5 WT monkeys versus HGPS #1, #5, #6), *P < 0.5 (two-tailed Student’s t-test). (E) The radiographs of the skull anteroposterior of a WT monkey (WT #6) and a HGPS monkey (HGPS #6). Showing disproportionate large calvarium and contractures finger bone (indicated by yellow arrows) in the HGPS monkey. (F) The smaller mandible (yellow box) and open anterior fontanel (yellow arrow) of the HGPS monkey revealed by skull radiography. Data (right) were presented as mean ± SD, n = 3 (WT #1, #5, #6 versus HGPS #1, #5, #6), **P < 0.01 (t-test). (G) Decreased range of motion in HGPS monkeys determined by the motion tracking. Data are presented as mean ± SD, n = 3 (WT #1, #5, #6 versus HGPS #1, #5, #6), *P < 0.05 (t-test). (H) Masson’s trichrome staining of the aorta showing early features of atherosclerosis (c) and vascular fibrosis (d) in HGPS monkeys. Scale bar, 800 μm, 100 μm, 25 μm, 25 μm. n = 2 slices per monkeys (WT #5, #6 versus HGPS #5, #6). Data are mean ± SD, ****P < 0.0001 (one-way ANOVA)
Figure 4
Figure 4
LMNAG608G resulted the decrease of cell proliferation ability. (A) Immunofluorescence staining of Ki67 demonstrated reduced proliferation of HGPS monkeys’ skin cells. Scale bar, 25 μm. n = 4 (WT #1, #4, #5, #6 versus HGPS #1, #4, #5, #6). Data are mean ± sd., *P < 0.05 (t-test). (B) The clonal images showed reduced expansion ability of the HGPS monkeys’ fibroblasts (n = 4 monkeys WT #1, #4, #5, #6 versus HGPS #1, #4, #5, #6). Data are mean ± SD, *P < 0.05 (t-test). (C) Immunofluorescence staining of SA-β-gal demonstrated increased senescence of HGPS monkeys’ fibroblasts. Scale bar, 50 μm. n = 4 (WT #1, #4, #5, #6 versus HGPS #1, #4, #5, #6). Data are mean ± SD, ***P < 0.001 (t-test). (D) Immunofluorescence staining of Ki67 demonstrated a decrease in proliferation of HGPS monkeys’ fibroblasts. Scale bar, 75 μm. n = 4 (WT #1, #4, #5, #6 versus HGPS #1, #4, #5, #6). Data are mean ± SD, ***P < 0.001 (t-test). (E) HP1α’s immunofluorescence staining of fibroblasts demonstrated heterochromatin loss in HGPS monkeys. Scale bar, 75 μm. n = 4 (WT #1, #4, #5, #6 versus HGPS #1, #4, #5, #6). Data are mean ± SD, ***P < 0.001 (t-test)
Figure 5
Figure 5
Transcriptome features in HGPS monkeys. (A) Scatter plot showed the DEGs between the skin samples of WT (WT#1, WT#5 and WT#6) and HGPS (HGPS #1, HGPS #5 and HGPS #6) monkeys. The number in red showed the count of upregulated DEGs [log2 (Fold change) > 1, adjusted-P < 0.05]; the number in blue shows the count of downregulated DEGs [log2 (Fold change) < −1, adjusted-P < 0.05]. (B and C) Dot plot showed the enriched GO-terms or pathways for upregulated (B) and downregulated (C) genes in skin samples of HGPS (HGPS #1, #5 and #6) compared to WT (WT #1, #5 and #6) monkeys. The color key from white to red (B) and white to blue (C) indicates low to high enrichment level [-log10 (P-value)] for each GO-term or pathway. The circle size indicates to the ratio of genes enriched in the GO-term or pathway. (D) Wind-rose plot showed the numbers of DEGs between WT (WT #5 and WT #6) and HGPS (HGPS #5 and HGPS #6) monkeys in various tissues. Red represents the count of upregulated genes and blue represents the count of downregulated genes between WT monkeys and HGPS monkeys. (E and F) Heat maps showed the enriched GO-terms or pathways for upregulated (E) and downregulated (F) in tissues of the HGPS #5 and HGPS #6 monkeys compared with the matched WT #5 and WT #6 monkeys. The color keys from white to red (E) and white to blue (F) indicate low to high enrichment level [−log10(P-value)] for each GO-term or pathway

References

    1. Aktas S, Kiyak M, Ozdil K, Kurtca I, Kibar S, Ahbab S, Karadeniz Y, Saler T. Gastrointestinal tract hemorrhage due to angiodysplasia in hutchinson gilfort Progeria syndrome. J Med Cases. 2013;4(8):576–578.
    1. Anders S, Pyl PT, Huber W. HTSeq–a Python framework to work with high-throughput sequencing data. Bioinformatics. 2015;31:166–169. - PMC - PubMed
    1. Bae S, Park J, Kim JS. Cas-OFFinder: a fast and versatile algorithm that searches for potential off-target sites of Cas9 RNA-guided endonucleases. Bioinformatics. 2014;30:1473–1475. - PMC - PubMed
    1. Capell BC, Collins FS. Human laminopathies: nuclei gone genetically awry. Nat Rev Genet. 2006;7:940–952. - PubMed
    1. Chan AWS. Progress and prospects for genetic modification of nonhuman primate models in biomedical research. ILAR J. 2013;54:211–223. - PMC - PubMed

Publication types