Randomized Controlled Trial
. 2020 Sep;19(9):e13199.
doi: 10.1111/acel.13199. Epub 2020 Jul 30.

The phytochemical epigallocatechin gallate prolongs the lifespan by improving lipid metabolism, reducing inflammation and oxidative stress in high-fat diet-fed obese rats

Affiliations
Randomized Controlled Trial

The phytochemical epigallocatechin gallate prolongs the lifespan by improving lipid metabolism, reducing inflammation and oxidative stress in high-fat diet-fed obese rats

Hang Yuan et al. Aging Cell. 2020 Sep.

Abstract

We have recently reported that epigallocatechin gallate (EGCG) could extend lifespan in healthy rats. This study aimed to investigate the effects and mechanisms of a high dose of EGCG in extending the lifespan of obese rats. Ninety adult male Wistar rats were randomly divided into the control (NC), high-fat (HF) and EGCG groups. Serum glucose and lipids, inflammation and oxidative stress were dynamically determined from adulthood to death, and the transcriptome and proteome of the liver were also examined. The median lifespans of the NC, HF and EGCG groups were 693, 599 and 683 days, respectively, and EGCG delayed death by 84 days in obese rats. EGCG improved serum glucose and lipids and reduced inflammation and oxidative stress associated with aging in obese rats induced by a high-fat diet. EGCG also significantly decreased the levels of total free fatty acids (FFAs), SFAs and the n-6/n-3 ratio but significantly increased the n-3 FFAs related to longevity. The joint study of the transcriptome and proteome in liver found that EGCG exerted its effects mainly by regulating the suppression of hydrogen peroxide and oxygen species metabolism, suppression of oxidative stress, activation of fatty acid transport and oxidation and cholesterol metabolism. EGCG significantly increased the protein expression of FOXO1, Sirt1, CAT, FABP1, GSTA2, ACSL1 and CPT2 but significantly decreased NF-κB, ACC1 and FAS protein levels in the livers of rats. All the results indicate that EGCG extends lifespan by improving FFA metabolism and reducing the levels of inflammatory and oxidative stress in obese rats.

Keywords: EGCG; free fatty acid; high-fat dietary; lifespan; proteomics; transcriptome.


Conflict of interest statement

The authors declare that there is no conflict of interest.

Figures
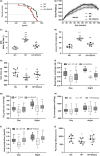
Figure 1
Figure 1
Effects of EGCG on lifespan, body weight, body fat rate, visceral fat content, lean mass and energy metabolism in obese rats. Ninety adult male Wistar rats were randomly divided into the normal control (n = 30), high‐fat diet (n = 30) and EGCG treatment groups (50 mg/kg/d, n = 30). The experiment lasted for 100 weeks. (a) Kaplan–Meier (log‐rank) survival curves (p = 0.043). (b) Body weight. (c) Body fat rate (n = 7). (d) Visceral fat content (n = 7). (e) Lean mass (n = 7). (f) Respiratory exchange rate (n = 7). (g) Carbon dioxide production (n = 7). (h) Oxygen consumption (n = 7). (i) Heat production (n = 7). (j) Running distances (n = 7). Data are presented as the means ± SD, * p < 0.05 or **p < 0.01 compared with NC; ## p < 0.01 compared with HF
Figure 2
Figure 2
Epigallocatechin gallate prolongs the healthspan and lifespan of obese rats. (a) Food intake. (b) Water intake. (c) The variation in body type and visceral organ damage (100 weeks, n = 7). (d‐f) Pathological sections of liver and kidney, the hepatic HAI score and the renal tubular injury scores (100 weeks, n = 7). **p < 0.01 compared with NC; ## p < 0.01 compared with HF
Figure 3
Figure 3
Epigallocatechin gallate reduced serum glucose, serum lipids, inflammation and oxidative stress and improved the function of the liver and kidney. (a) Serum glucose (GLU). (b) Serum insulin. (c) Serum total cholesterol (TC). (d) Serum triglycerides (TG). (e) Serum high‐density lipoprotein cholesterol (HDL‐C). (f) Serum low‐density lipoprotein cholesterol (LDL‐C). All values are the means ± SD, n = 7 for 100 weeks and n = 10 for other weeks.* p < 0.05 or **p < 0.01 compared with NC; # p < 0.05 or ## p < 0.01 compared with HF
Figure 4
Figure 4
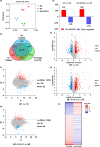
Effects of EGCG on the liver transcriptome and proteome using mRNA sequencing and iTraq proteomic methods. (a) PCA for gene quantification data derived from RNA sequencing. (b) Venn diagram analysis for co‐expressed genes. (c) MA plot analysis for differentially expressed genes; we marked the points with p < 0.05 and log2 FC of transcripts >1 or <−1 in the HF group vs NC. (d) MA plot analysis for differentially expressed genes in the EGCG group vs HF. (e) The protein expression changes based on a P < 0.05. (f) Volcano plot analysis for differentially expressed proteins depicting the points with p < 0.05, and the greater the fold change is, the farther away from the vertical centreline in the HF group vs NC. (g) Volcano plot analysis for differentially expressed proteins in the EGCG group vs HF. (h) Heap map for classification of the differentially expressed proteins. n = 3 for each group and aged 100 weeks, and all red dots represent upregulated, blue dots represent downregulated, and grey dots represent no obvious changes in the figures
Figure 5
Figure 5
Correlation analysis of the transcriptome and proteome. (a) Counts of co‐expressed genes and proteins. The blue represents only genes, the pink represents only the proteome, and the overlap represents the co‐expressed genes and proteins. (b) Analysis of co‐expressed genes and proteins. Different colours represent different meanings, such as grey (fold change ≤1.5 for both mRNA and protein), yellow (fold change ≥1.5 for both mRNA and protein), green (fold change ≥1.5 for mRNA but ≤1.5 for protein) and blue (fold change ≤1.5 for mRNA but ≥1.5 for protein). Red genes represents those with a consistent direction but variable magnitude of change (≥1.5‐fold) between the regions at the protein and RNA level, while purple genes disagree in the direction of change between the mRNA and protein. (c) Different genes or proteins are coloured based on their fold changes of mRNA and protein in the HF group vs NC. (d) Different genes or proteins are coloured based on their fold changes of mRNA and protein in the EGCG group vs HF. n = 3 for each group and aged 100 weeks
Figure 6
Figure 6
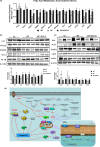
Further verification of the changes in the transcriptome and proteome. (a) The mRNA levels of Fasn, ACSL1, FABP1 CPT2, CAT and GSTA2 were measured in the liver by quantitative real‐time RT‐PCR. (b) The protein expression levels of CAT, GSTA2, FOXO1, SIRT1, NF‐κB, FAS, ACC1, FABP1, CPT2 and ACSL1 were measured in the liver by Western blot methods. A representative loading control is shown for each case (n = 3). (c) Molecular pathway analysis of EGCG extends the lifespan in obese rats. Data were presented as the ratios of target protein to β‐actin. All values are the means ±SD. * p < 0.05 or **p < 0.01 compared with NC; # p < 0.05 or ## p < 0.01 compared with HF

References

    1. Aihie Sayer, A. , Dunn, R. , Langley‐Evans, S. , & Cooper, C. (2001). Prenatal exposure to a maternal low protein diet shortens life span in rats. Gerontology, 47(1), 9–14. 10.1159/000052764 - DOI - PubMed
    1. Arab, L. , Khan, F. , & Lam, H. (2013). Tea consumption and cardiovascular disease risk. The American Journal of Clinical Nutrition, 98(6), 1651S–1659S. 10.3945/ajcn.113.059345 - DOI - PubMed
    1. Ashida, H. , Furuyashiki, T. , Nagayasu, H. , Bessho, H. , Sakakibara, H. , Hashimoto, T. , & Kanazawa, K. (2004). Anti‐obesity actions of green tea: possible involvements in modulation of the glucose uptake system and suppression of the adipogenesis‐related transcription factors. BioFactors, 22, 135–140. 10.1002/biof.5520220126 - DOI - PubMed
    1. Bernardes de Jesus, B. , Vera, E. , Schneeberger, K. , Tejera, A. M. , Ayuso, E. , Bosch, F. , & Blasco, M. A. (2012). Telomerase gene therapy in adult and old mice delays aging and increases longevity without increasing cancer. EMBO Molecular Medicine., 4(8), 691–704. 10.1002/emmm.201200245 - DOI - PMC - PubMed
    1. Bose, M. , Lambert, J. D. , Ju, J. , Reuhl, K. R. , Shapses, S. A. , & Yang, C. S. (2008). The major green tea polyphenol, (‐)‐epigallocatechin‐3‐gallate, inhibits obesity, metabolic syndrome, and fatty liver disease in high‐fat‐fed mice. The Journal of Nutrition, 138(9), 1677–1683. 10.1093/jn/138.9.1677 - DOI - PMC - PubMed

Publication types