Multicenter Study
. 2021 Jan;298(1):E18-E28.
doi: 10.1148/radiol.2020202439. Epub 2020 Jul 30.

Automated Assessment of COVID-19 Reporting and Data System and Chest CT Severity Scores in Patients Suspected of Having COVID-19 Using Artificial Intelligence

Affiliations
Multicenter Study

Automated Assessment of COVID-19 Reporting and Data System and Chest CT Severity Scores in Patients Suspected of Having COVID-19 Using Artificial Intelligence

Nikolas Lessmann et al. Radiology. 2021 Jan.

Abstract

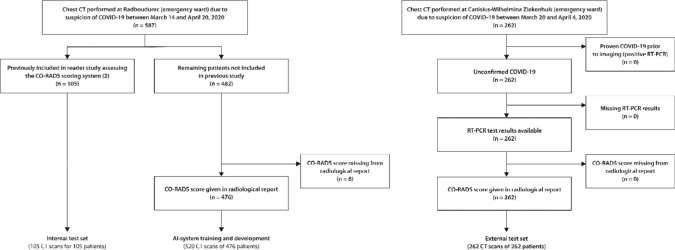
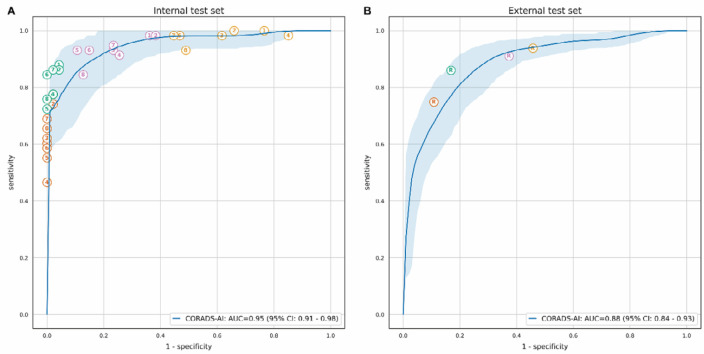
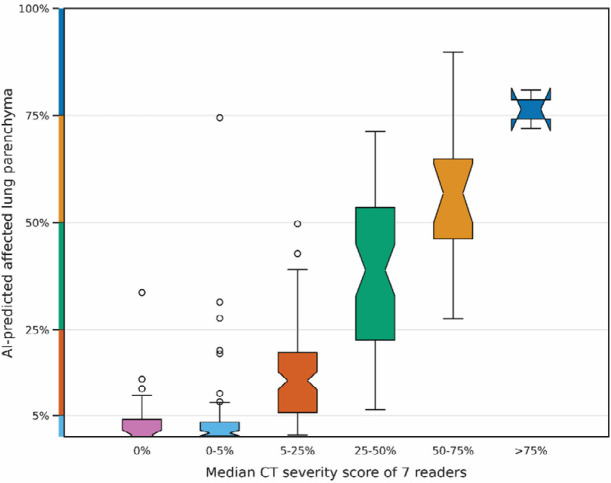
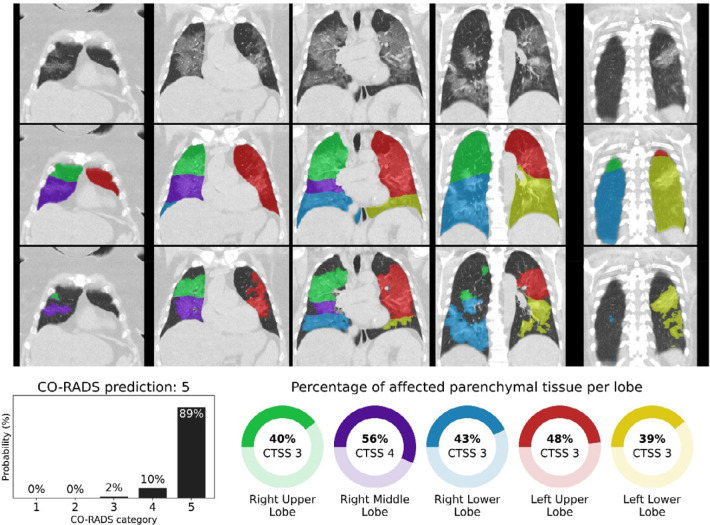
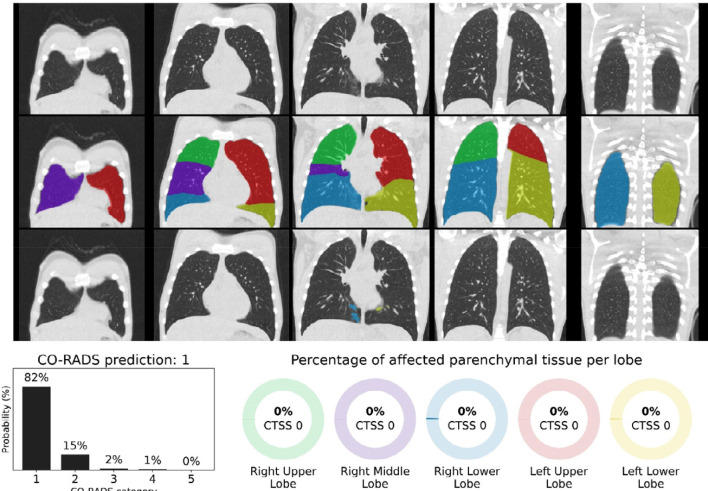
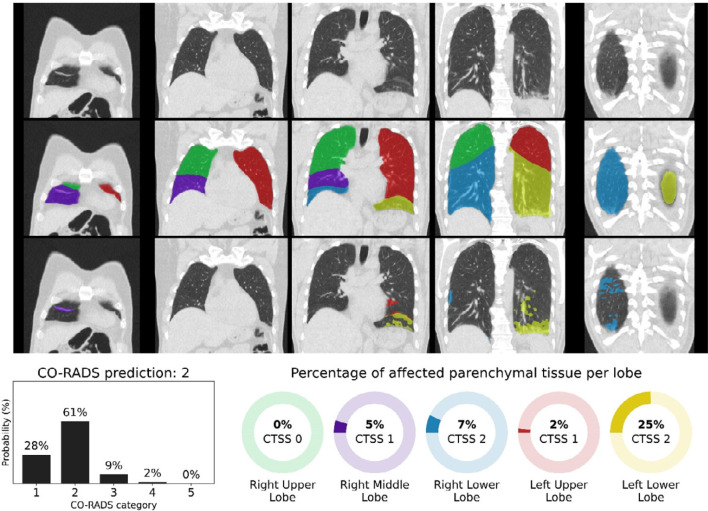
Background The coronavirus disease 2019 (COVID-19) pandemic has spread across the globe with alarming speed, morbidity, and mortality. Immediate triage of patients with chest infections suspected to be caused by COVID-19 using chest CT may be of assistance when results from definitive viral testing are delayed. Purpose To develop and validate an artificial intelligence (AI) system to score the likelihood and extent of pulmonary COVID-19 on chest CT scans using the COVID-19 Reporting and Data System (CO-RADS) and CT severity scoring systems. Materials and Methods The CO-RADS AI system consists of three deep-learning algorithms that automatically segment the five pulmonary lobes, assign a CO-RADS score for the suspicion of COVID-19, and assign a CT severity score for the degree of parenchymal involvement per lobe. This study retrospectively included patients who underwent a nonenhanced chest CT examination because of clinical suspicion of COVID-19 at two medical centers. The system was trained, validated, and tested with data from one of the centers. Data from the second center served as an external test set. Diagnostic performance and agreement with scores assigned by eight independent observers were measured using receiver operating characteristic analysis, linearly weighted κ values, and classification accuracy. Results A total of 105 patients (mean age, 62 years ± 16 [standard deviation]; 61 men) and 262 patients (mean age, 64 years ± 16; 154 men) were evaluated in the internal and external test sets, respectively. The system discriminated between patients with COVID-19 and those without COVID-19, with areas under the receiver operating characteristic curve of 0.95 (95% CI: 0.91, 0.98) and 0.88 (95% CI: 0.84, 0.93), for the internal and external test sets, respectively. Agreement with the eight human observers was moderate to substantial, with mean linearly weighted κ values of 0.60 ± 0.01 for CO-RADS scores and 0.54 ± 0.01 for CT severity scores. Conclusion With high diagnostic performance, the CO-RADS AI system correctly identified patients with COVID-19 using chest CT scans and assigned standardized CO-RADS and CT severity scores that demonstrated good agreement with findings from eight independent observers and generalized well to external data. © RSNA, 2020 Supplemental material is available for this article.


Figures

Flowchart for patient inclusion in the training and test sets. Note that n refers to the number of patients. The number of CT images is higher in the training set since several patients received multiple chest CT scans within the inclusion period. However, in the test sets, only the earliest available scan of each patient was used.
Figure 1.
Flowchart for patient inclusion in the training and test sets. Note that n refers to the number of patients. The number of CT images is higher in the training set since several patients received multiple chest CT scans within the inclusion period. However, in the test sets, only the earliest available scan of each patient was used.
ROC curves for automatically predicted CO-RADS 5 probability vs. COVID-19 diagnosis. The receiver operating characteristic (ROC) curve is based on the probability that the algorithm assigned to CO-RADS 5. The shaded area around the ROC curve reflects the 95% confidence interval. A, The performance of the eight observers is shown as individual points on the graph for the internal test set, and, B, the diagnostic performance of the scores from the radiological reports is shown for the external test set. Different colors indicate different cut-offs, where patients were considered predicted COVID-19 positive if the observer assigned a CO-RADS score of 5 (orange), 4 or 5 (green), 3 to 5 (magenta), or 2 to 5 (yellow). COVID-19 diagnosis meant either a positive RT-PCR test or very high clinical suspicion of COVID-19 despite at least one negative RT-PCR test.
Figure 2.
ROC curves for automatically predicted CO-RADS 5 probability vs. COVID-19 diagnosis. The receiver operating characteristic (ROC) curve is based on the probability that the algorithm assigned to CO-RADS 5. The shaded area around the ROC curve reflects the 95% confidence interval. A, The performance of the eight observers is shown as individual points on the graph for the internal test set, and, B, the diagnostic performance of the scores from the radiological reports is shown for the external test set. Different colors indicate different cut-offs, where patients were considered predicted COVID-19 positive if the observer assigned a CO-RADS score of 5 (orange), 4 or 5 (green), 3 to 5 (magenta), or 2 to 5 (yellow). COVID-19 diagnosis meant either a positive RT-PCR test or very high clinical suspicion of COVID-19 despite at least one negative RT-PCR test.
CT severity score predictions vs. median of observer scores. Shown as box plots are the distribution of the percentage of affected lung parenchyma per lobe according to the automatic lesion (affected volume) and lobe segmentations (total volume) for the internal test set. The notch in each box plot illustrates the 95% confidence interval around the median. The CT severity score cut-offs are marked on the y-axis.
Figure 3.
CT severity score predictions vs. median of observer scores. Shown as box plots are the distribution of the percentage of affected lung parenchyma per lobe according to the automatic lesion (affected volume) and lobe segmentations (total volume) for the internal test set. The notch in each box plot illustrates the 95% confidence interval around the median. The CT severity score cut-offs are marked on the y-axis.
CO-RADS and CT severity score predictions for a COVID-19 positive case with extensive parenchymal involvement. 73-year-old woman with positive RT-PCR test result. Non-contrast CT scan in coronal view (top row), overlaid with the automatic lobe segmentation (middle row) and the detected areas of abnormal parenchymal lung tissue (bottom row). This figure also shows the probabilities that the artificial intelligence model assigned to each CO-RADS category (bottom left), and the computed percentages of affected parenchymal tissue and the corresponding CT Severity Score (CTSS) per lobe per lobe (bottom right). The eight observers scored this case 3x CO-RADS 3, 1x CO-RADS 4 and 4x CO-RADS 5.
Figure 4.
CO-RADS and CT severity score predictions for a COVID-19 positive case with extensive parenchymal involvement. 73-year-old woman with positive RT-PCR test result. Non-contrast CT scan in coronal view (top row), overlaid with the automatic lobe segmentation (middle row) and the detected areas of abnormal parenchymal lung tissue (bottom row). This figure also shows the probabilities that the artificial intelligence model assigned to each CO-RADS category (bottom left), and the computed percentages of affected parenchymal tissue and the corresponding CT Severity Score (CTSS) per lobe per lobe (bottom right). The eight observers scored this case 3x CO-RADS 3, 1x CO-RADS 4 and 4x CO-RADS 5.
CO-RADS and CT severity score predictions for a COVID-19 positive case with little parenchymal involvement. 18-year-old man with positive RT-PCR test result. Non-contrast CT scan in coronal view (top row), overlaid with the automatic lobe segmentation (middle row) and the detected areas of abnormal parenchymal lung tissue (bottom row). This figure also shows the probabilities that the artificial intelligence model assigned to each CO-RADS category (bottom left), and the computed percentages of affected parenchymal tissue and the corresponding CT Severity Score (CTSS) per lobe (bottom right). The eight observers scored this case 2x CO-RADS 1, 5x CO-RADS 2 and 1x CO-RADS 3.
Figure 5.
CO-RADS and CT severity score predictions for a COVID-19 positive case with little parenchymal involvement. 18-year-old man with positive RT-PCR test result. Non-contrast CT scan in coronal view (top row), overlaid with the automatic lobe segmentation (middle row) and the detected areas of abnormal parenchymal lung tissue (bottom row). This figure also shows the probabilities that the artificial intelligence model assigned to each CO-RADS category (bottom left), and the computed percentages of affected parenchymal tissue and the corresponding CT Severity Score (CTSS) per lobe (bottom right). The eight observers scored this case 2x CO-RADS 1, 5x CO-RADS 2 and 1x CO-RADS 3.
CO-RADS and CT severity score predictions for a COVID-19 negative case. 54-year-old man with negative RT-PCR test result. Non-contrast CT scan in coronal view (top row), overlaid with the automatic lobe segmentation (middle row) and the detected areas of abnormal parenchymal lung tissue (bottom row). This figure also shows the probabilities that the artificial intelligence model assigned to each CO-RADS category (bottom left), and the computed percentages of affected parenchymal tissue and the corresponding CT Severity Score (CTSS) per lobe (bottom right). The eight observers scored this case 3x CO-RADS 1, 3x CO-RADS 2, and 2x CO-RADS 3.
Figure 6.
CO-RADS and CT severity score predictions for a COVID-19 negative case. 54-year-old man with negative RT-PCR test result. Non-contrast CT scan in coronal view (top row), overlaid with the automatic lobe segmentation (middle row) and the detected areas of abnormal parenchymal lung tissue (bottom row). This figure also shows the probabilities that the artificial intelligence model assigned to each CO-RADS category (bottom left), and the computed percentages of affected parenchymal tissue and the corresponding CT Severity Score (CTSS) per lobe (bottom right). The eight observers scored this case 3x CO-RADS 1, 3x CO-RADS 2, and 2x CO-RADS 3.

Similar articles

Cited by

References

    1. Yang W, Sirajuddin A, Zhang X, Liu G, Teng Z, Zhao S, Lu M. The role of imaging in 2019 novel coronavirus pneumonia (COVID-19). European Radiology 2020. doi: 10.1007/s00330-020-06827-4 - PMC - PubMed
    1. Prokop M, van Everdingen W, van Rees Vellinga T, Quarles van Ufford J, Stöger L, Beenen L, Geurts B, Gietema H, Krdzalic J, Schaefer-Prokop C, van Ginneken B, Brink M. CO-RADS – A categorical CT assessment scheme for patients with suspected COVID-19: definition and evaluation. Radiology 2020. doi: 10.1148/radiol.2020201473 - PMC - PubMed
    1. Simpson S, Kay FU, Abbara S, Bhalla S, Chung JH, Chung M, Henry TS, Kanne JP, Kligerman S, Ko JP, Litt H. Radiological Society of North America Expert Consensus Statement on Reporting Chest CT Findings Related to COVID-19. Endorsed by the Society of Thoracic Radiology, the American College of Radiology, and RSNA. Radiology: Cardiothoracic Imaging 2020;2(2). doi: 10.1148/ryct.2020200152 - PMC - PubMed
    1. Salehi S, Abedi A, Balakrishnan S, Gholamrezanezhad A. Coronavirus disease 2019 (COVID-19) imaging reporting and data system (COVID-RADS) and common lexicon: a proposal based on the imaging data of 37 studies. European Radiology 2020. doi: 10.1007/s00330-020-06863-0 - PMC - PubMed
    1. Li K, Wu J, Wu F, Guo D, Chen L, Fang Z, Li C. The Clinical and Chest CT Features Associated With Severe and Critical COVID-19 Pneumonia. Invest Radiol 2020;55(6):327-331. doi: 10.1097/RLI.0000000000000672 - PMC - PubMed

Publication types