. 2020 Sep;19(9):e13204.
doi: 10.1111/acel.13204. Epub 2020 Jul 30.

Sirt1 sustains female fertility by slowing age-related decline in oocyte quality required for post-fertilization embryo development

Affiliations

Sirt1 sustains female fertility by slowing age-related decline in oocyte quality required for post-fertilization embryo development

Juvita D Iljas et al. Aging Cell. 2020 Sep.

Abstract

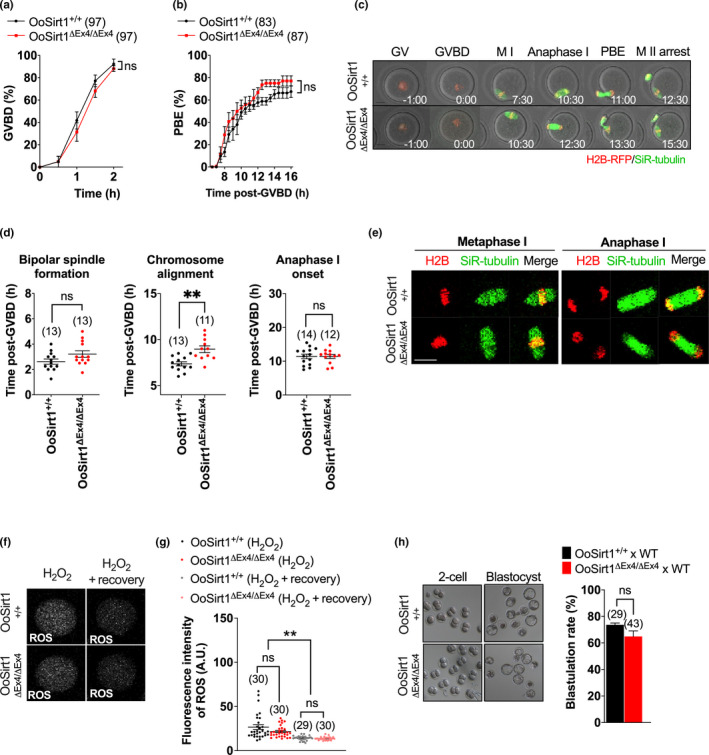
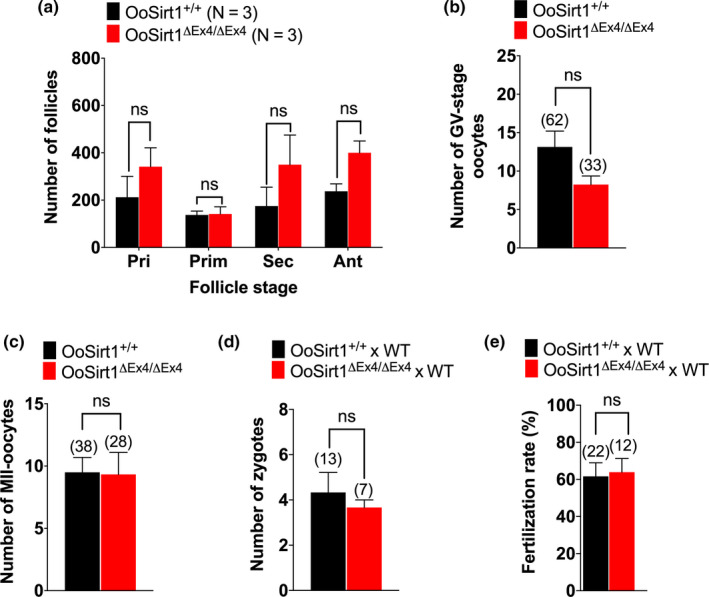
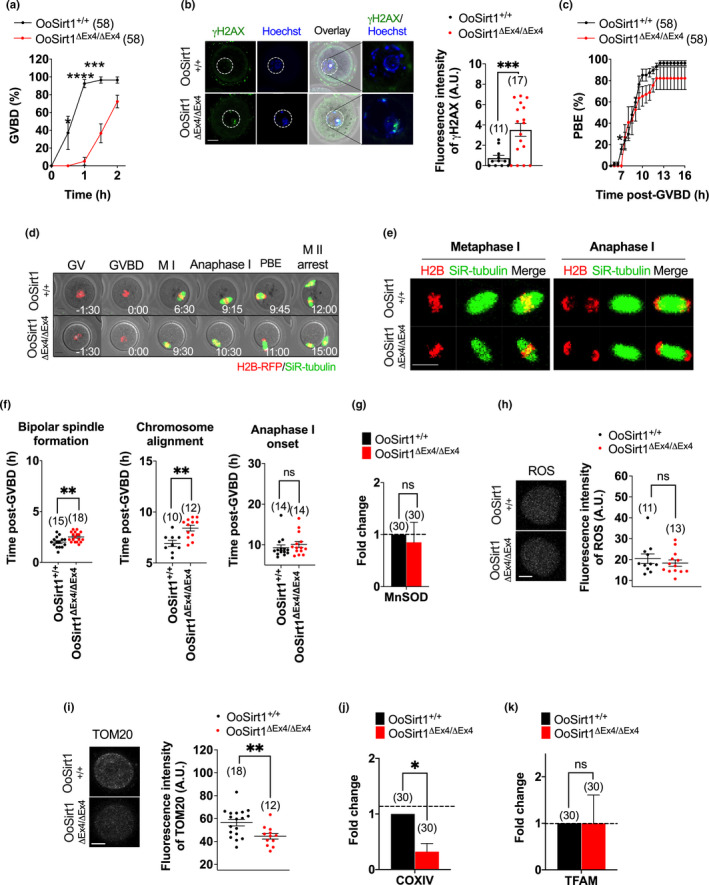
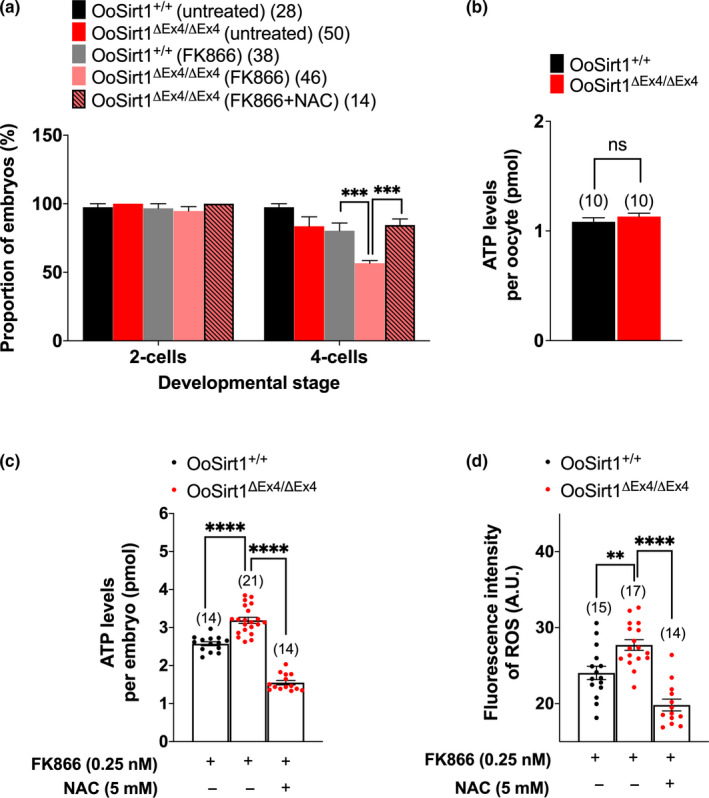
The NAD+ -dependent sirtuin deacetylase, Sirt1, regulates key transcription factors strongly implicated in ageing and lifespan. Due to potential confounding effects secondary to loss of Sirt1 function from the soma in existing whole-animal mutants, the in vivo role of Sirt1 in oocytes (oocyte-Sirt1) for female fertility remains unknown. We deleted Sirt1 specifically in growing oocytes and study how loss of oocyte-Sirt1 affects a comprehensive range of female reproductive parameters including ovarian follicular reservoir, oocyte maturation, oocyte mitochondrial abundance, oxidative stress, fertilization, embryo development and fertility during ageing. Surprisingly, eliminating this key sirtuin from growing oocytes has no effect in young females. During a 10-month-long breeding trial, however, we find that 50% of females lacking oocyte-Sirt1 become prematurely sterile between 9 and 11 months of age when 100% of wild-type females remain fertile. This is not due to an accelerated age-related decline in oocyte numbers in the absence of oocyte-Sirt1 but to reduced oocyte developmental competence or quality. Compromised oocyte quality does not impact in vivo oocyte maturation or fertilization but leads to increased oxidative stress in preimplantation embryos that inhibits cleavage divisions. Our data suggest that defects emerge in aged females lacking oocyte-Sirt1 due to concurrent age-related changes such as reduced NAD+ and sirtuin expression levels, which compromise compensatory mechanisms that can cover for Sirt1 loss in younger oocytes. In contrast to evidence that increasing Sirt1 activity delays ageing, our data provide some of the only in vivo evidence that loss of Sirt1 induces premature ageing.

Keywords: Sirt1; ageing; fertility; mitochondria; oocyte; oxidative stress.


Conflict of interest statement

HAH is a co‐founder, shareholder and advisor of Jumpstart Fertility Inc, which was founded to develop research into NAD+‐dependent pathways involved in female fertility.

Figures

FIGURE 1
FIGURE 1
Mitochondrial abundance, oxidative stress and ATP levels in oocytes and in vivo fertility in young females. (a–e) Oocyte levels of TFAM and MnSOD mRNA (a), TOM20 (b), COXIV mRNA (c), ROS (d) and ATP (e). Panels show images of representative OoSirt1ΔEx4/ΔEx4 and OoSirt1+/+ oocytes stained for TOM20 (b) and ROS (d). Fold changes of mRNA levels (a, c) are shown as 2−∆∆Ct normalized to housekeeping gene βACTIN. (f) Mean litter sizes of OoSirt1+/+ and OoSirt1ΔEx4/ΔEx4 females crossed with WT males. (g) Mean body weights of pups at 4 weeks of age. Oocyte and pup numbers are shown in parentheses. Scale bars = 20 µm. Data are shown as mean ± SEM (b, d, e–g) or as mean ± SD (a, c). Statistical analysis performed using two‐tailed Student's t test. ns denotes p > 0.05
FIGURE 2
FIGURE 2
In vitro maturation, spindle assembly, chromosome alignment and segregation in oocytes and preimplantation development of embryos from young OoSirt1+/+ and OoSirt1ΔEx4/ΔEx4 females. Rates of (a) GVBD and (b) PBE. (c) Shown are panels comprised of selected brightfield and fluorescence frames from representative timelapse series of OoSirt1ΔEx4/ΔEx4 and OoSirt1+/+ oocytes. Time, h:min relative to GVBD. (d) Quantification of timing of bipolar spindle formation, chromosome alignment and anaphase I‐onset. (e) Shown are representative images of live OoSirt1ΔEx4/ΔEx4 and OoSirt1+/+ oocytes during metaphase I and anaphase I. (f) Shown are representative images of ROS fluorescence in oocytes immediately following peroxide treatment and after 90 min of recovery. (g) ROS quantification in peroxide treated OoSirt1ΔEx4/ΔEx4 and OoSirt1+/+ oocytes. (h) Blastulation rates of embryos derived from OoSirt1ΔEx4/ΔEx4 and OoSirt1+/+ females crossed with WT males. Shown are representative brightfield images of 2‐cell and blastocyst stage embryos. Oocyte and embryo numbers are shown in parentheses. Scale bar = 20 µm. Data are shown as mean ± SEM. Statistical analyses performed using two‐way Anova with Sidak's multiple comparisons test (a, b) or two‐tailed Student's t test (d, g, h). p values are represented as **p ≤ 0.01, ns denotes p > 0.05
FIGURE 3
FIGURE 3
Fertility during female ageing. (a) Mean cumulative pup numbers for OoSirt1ΔEx4/ΔEx4 and OoSirt1+/+ females from 2 months to 12 months of age mated with young WT males. (b) Litter sizes of OoSirt1ΔEx4/ΔEx4 and OoSirt1+/+ females ≤7 months and >7 months. (c) Proportion of OoSirt1ΔEx4/ΔEx4 and OoSirt1+/+ females achieving live births (pregnancy rates) after mating with young WT males. Data are shown as mean ± SEM. Statistical analysis performed using two‐tailed Student's t test (b). p values are represented as *p ≤ 0.05, ns denotes p > 0.05. N, numbers of breeding pairs
FIGURE 4
FIGURE 4
Oocyte numbers, in vivo maturation and fertilization in aged females. (a‐c) Quantification of (a) follicle numbers, (b) fully grown GV‐stage oocytes and (c) MII oocytes produced in vivo. (d, e) Numbers of zygotes (d) and fertilization rates (e) of OoSirt1ΔEx4/ΔEx4 and OoSirt1+/+ females crossed with WT males. Data are shown as mean ± SEM. Statistical analyses performed using either two‐way Anova with Sidak's multiple comparisons test (a) or two‐tailed Student's t test (b‐e). ns denotes p > 0.05. Oocyte and zygote numbers are shown in parantheses. N, numbers of mice
FIGURE 5
FIGURE 5
Ageing effects on oocyte quality. (a) GVBD rates. (b) Oocyte γH2AX levels. The white dashed line outlines the GV. (c) PBE rates. (d) Shown are panels comprised of selected brightfield and fluorescence frames from representative timelapse series of oocytes from aged mice. Time, h:min relative to GVBD. (e) Shown are representative images of live oocytes from aged mice during metaphase I and anaphase I. (f) Quantification of timing of bipolar spindle formation, chromosome alignment and anaphase I‐onset. (g–k) Levels of MnSOD mRNA (g), ROS (h), TOM20 (i), COXIV (j) and TFAM mRNA (k). Panels show images of representative oocytes stained for ROS (h) and TOM20 (i). Fold changes of mRNA levels are shown as 2−∆∆Ct normalized to housekeeping gene βACTIN. Scale bars = 20 µm. Data are shown as mean ± SEM (a–c, f, h, i) or shown as mean ± SD (g, j, k). Statistical analyses performed using either two‐way Anova with Sidak's multiple comparisons test (a, c) or two‐tailed Student's t test (b, f–k). p values are represented as *p ≤ 0.05, **p ≤ 0.01, ***p ≤ 0.001, ****p ≤ 0.0001, ns denotes p > 0.05. Oocyte numbers are shown in parentheses
FIGURE 6
FIGURE 6
In vitro preimplantation development, oxidative stress and ATP levels of embryos following NAD+ depletion with FK866. (a) The proportion of zygotes, derived from females crossed with WT males, that reached 2‐cell and 4‐cell stages following treatment with FK866 and N‐acetyl cysteine (NAC). (b) Quantification of ATP levels in oocytes derived from aged females. (c–d) Quantification of ATP (c) and ROS (d) levels in 4‐cell embryos following treatment of zygotes with FK866 and NAC. Data are shown as mean ± SEM. Statistical analyses performed using either one‐way Anova with Tukey's multiple comparisons test (a, c, d) or two‐tailed Student's t test (b). p values are represented as **p ≤ 0.01, ***p ≤ 0.001, ****p ≤ 0.0001. Oocyte and embryo numbers are shown in parentheses

References

    1. Bertoldo, M. J. , Listijono, D. R. , Ho, W.‐H. , Riepsamen, A. H. , Goss, D. M. , Richani, D. , … Wu, L. E. (2020). NAD(+) repletion rescues female fertility during reproductive aging. Cell Reports, 30(6), 1670–1681.e1677. 10.1016/j.celrep.2020.01.058 - DOI - PMC - PubMed
    1. Biel, T. G. , Lee, S. , Flores‐Toro, J. A. , Dean, J. W. , Go, K. L. , Lee, M.‐H. , … Kim, J.‐S. (2016). Sirtuin 1 suppresses mitochondrial dysfunction of ischemic mouse livers in a mitofusin 2‐dependent manner. Cell Death and Differentiation, 23(2), 279–290. 10.1038/cdd.2015.96 - DOI - PMC - PubMed
    1. Brunet, A. , Sweeney, L. B. , Sturgill, J. F. , Chua, K. F. , Greer, P. L. , Lin, Y. , … Greenberg, M. E. (2004). Stress‐dependent regulation of FOXO transcription factors by the SIRT1 deacetylase. Science, 303(5666), 2011–2015. 10.1126/science.1094637 - DOI - PubMed
    1. Cheng, H.‐L. , Mostoslavsky, R. , Saito, S. , Manis, J. P. , Gu, Y. , Patel, P. , … Chua, K. F. (2003). Developmental defects and p53 hyperacetylation in Sir2 homolog (SIRT1)‐deficient mice. Proceedings of the National Academy of Sciences of the United States of America, 100(19), 10794–10799. 10.1073/pnas.1934713100 - DOI - PMC - PubMed
    1. Coussens, M. , Maresh, J. G. , Yanagimachi, R. , Maeda, G. , & Allsopp, R. (2008). Sirt1 deficiency attenuates spermatogenesis and germ cell function. PLoS One, 3(2), e1571 10.1371/journal.pone.0001571 - DOI - PMC - PubMed

Publication types

LinkOut - more resources