. 2020 Nov 2;130(11):5893-5908.
doi: 10.1172/JCI136466.

DCAF1 regulates Treg senescence via the ROS axis during immunological aging

Affiliations

DCAF1 regulates Treg senescence via the ROS axis during immunological aging

Zengli Guo et al. J Clin Invest. .

Abstract

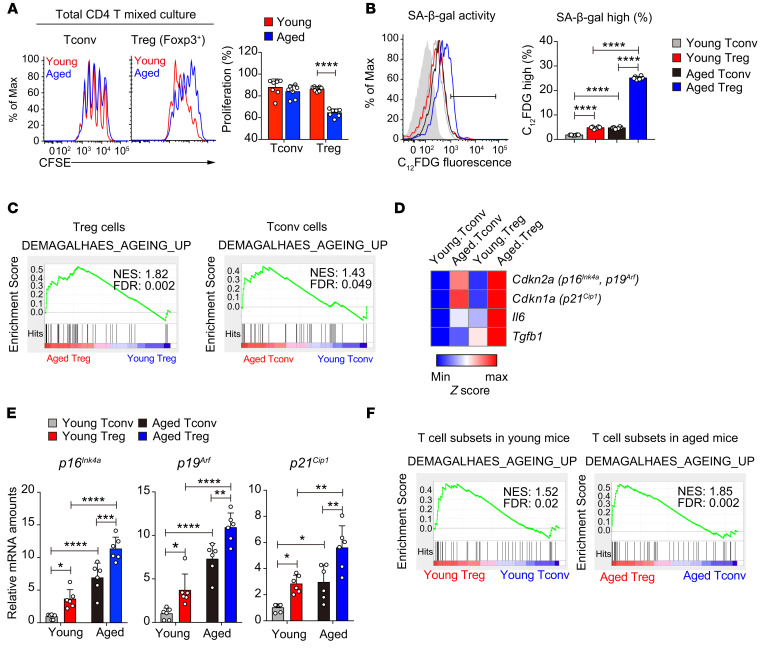
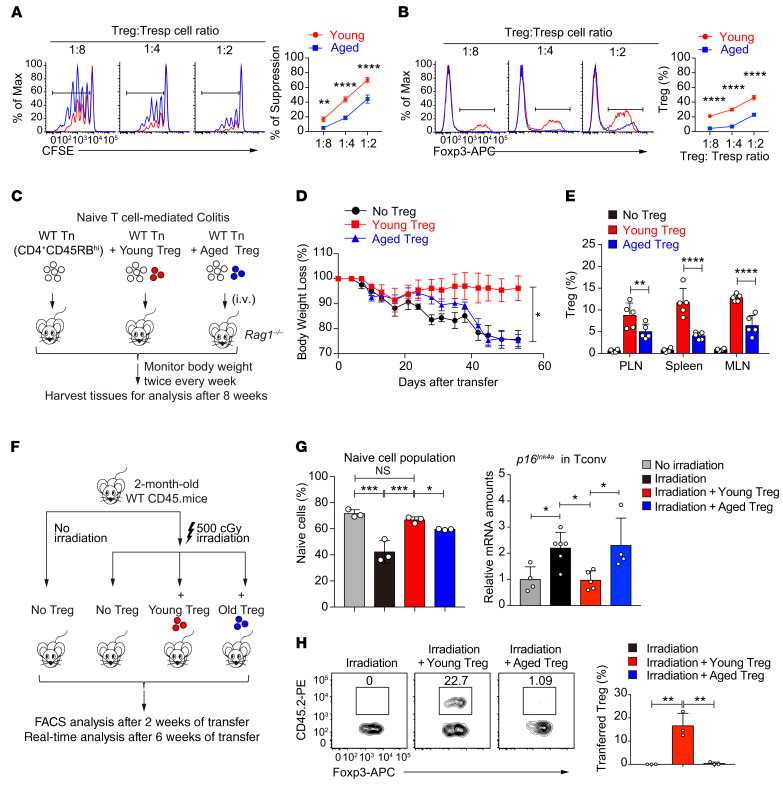
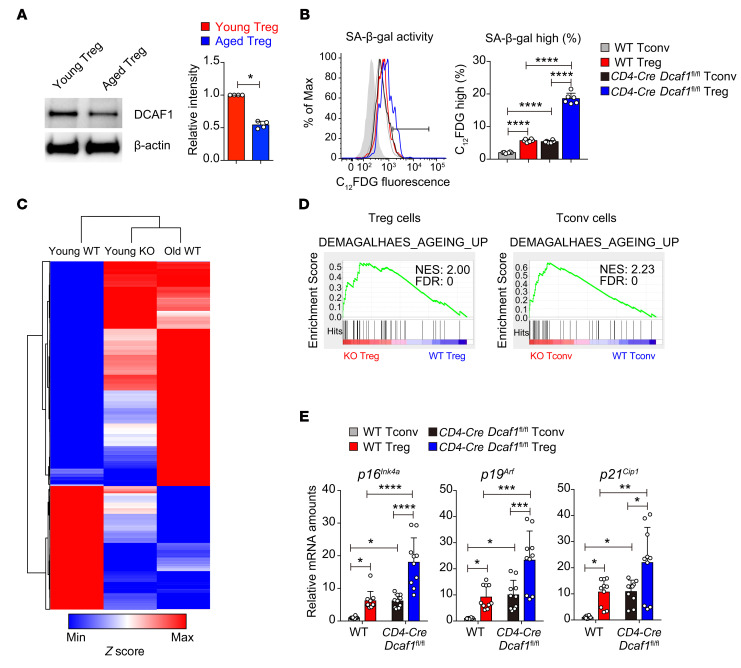
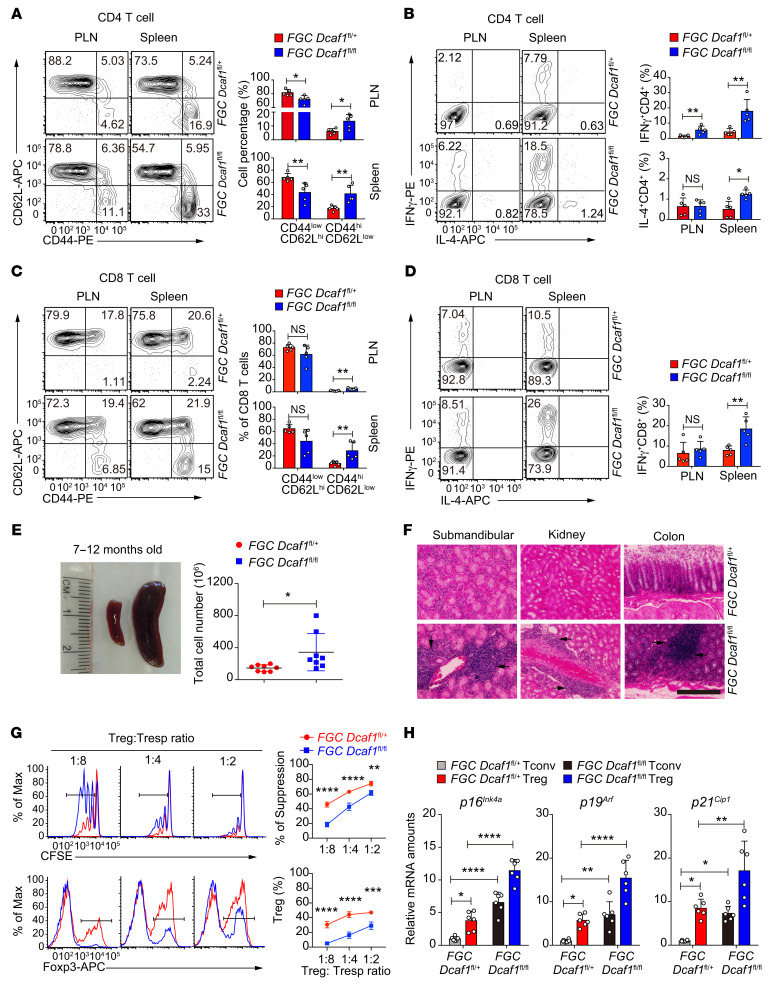
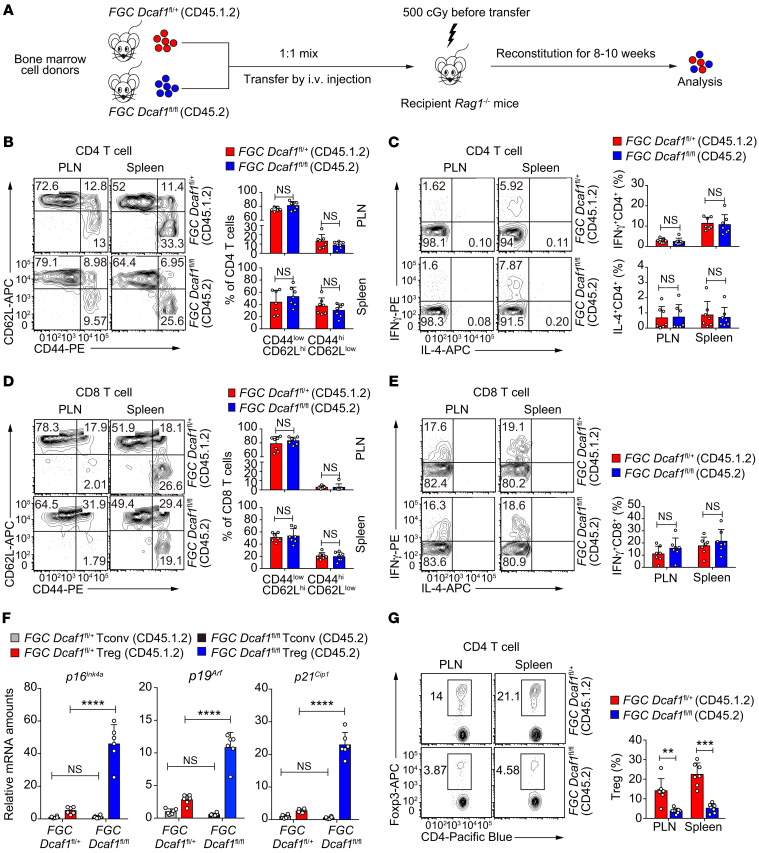
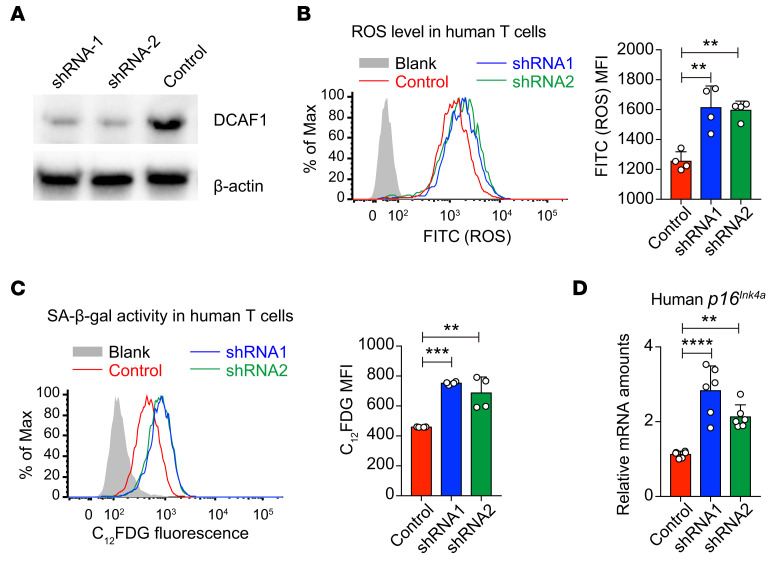
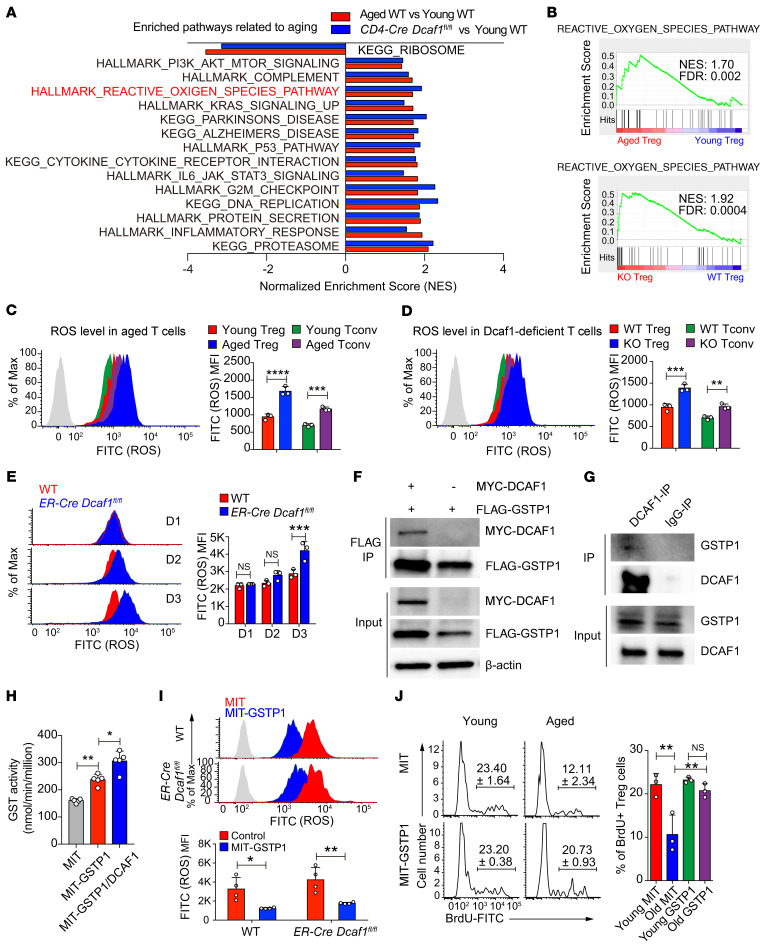
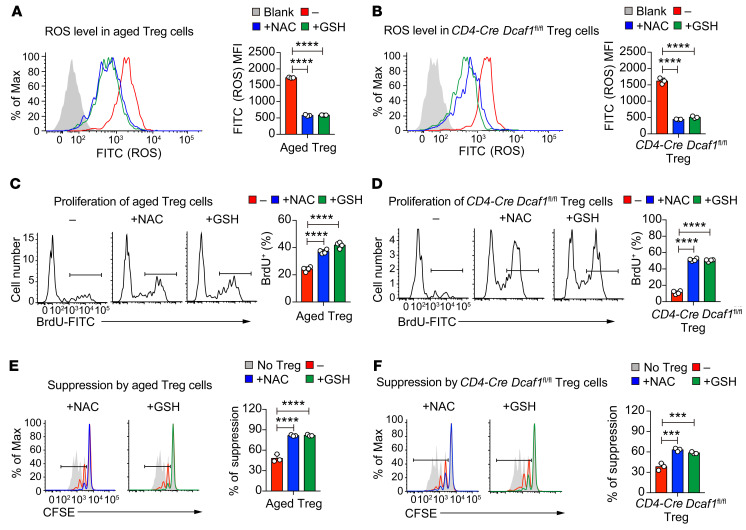
As a hallmark of immunological aging, low-grade, chronic inflammation with accumulation of effector memory T cells contributes to increased susceptibility to many aging-related diseases. While the proinflammatory state of aged T cells indicates a dysregulation of immune homeostasis, whether and how aging drives regulatory T cell (Treg) aging and alters Treg function are not fully understood owing to a lack of specific aging markers. Here, by a combination of cellular, molecular, and bioinformatic approaches, we discovered that Tregs senesce more severely than conventional T (Tconv) cells during aging. We found that Tregs from aged mice were less efficient than young Tregs in suppressing Tconv cell function in an inflammatory bowel disease model and in preventing Tconv cell aging in an irradiation-induced aging model. Furthermore, we revealed that DDB1- and CUL4-associated factor 1 (DCAF1) was downregulated in aged Tregs and was critical to restrain Treg aging via reactive oxygen species (ROS) regulated by glutathione-S-transferase P (GSTP1). Importantly, interfering with GSTP1 and ROS pathways reinvigorated the proliferation and function of aged Tregs. Therefore, our studies uncover an important role of the DCAF1/GSTP1/ROS axis in Treg senescence, which leads to uncontrolled inflammation and immunological aging.

Keywords: Aging; Cellular senescence; Immunology; Inflammatory bowel disease; T cells.


Conflict of interest statement

Conflict of interest: The authors have declared that no conflict of interest exists.

Figures

Figure 1
Figure 1. Preferential Treg aging in young and aged mice.
(A) Proliferation of CD4+Foxp3+ (Treg) and CD4+Foxp3 (Tconv) cells from young and aged (more than 18-month-old) mice 3 days after activation when cultured in the same well, analyzed by CFSE dilution and flow cytometry (n = 7 mice of 3 experiments; representative results are shown; means ± SD, ****P < 0.0001, by 1-way ANOVA followed by Tukey’s multiple-comparisons test). (B) SA-β-gal activity of CD4+CD25+ Tregs and CD4+CD25 Tconv cells in splenocytes from young and aged mice, assessed by flow cytometry with the fluorescent β-gal substrate C12FDG (gray area, no C12FDG; n = 6 mice of 3 experiments; representative flow cytometry results are shown; means ± SD, ****P < 0.0001, by 1-way ANOVA followed by Tukey’s multiple-comparisons test). (C) Elevated aging program in aged Tregs (left panel) and aged Tconv cells (right panel) revealed by GSEA of RNA-Seq data sets. (D and E) Preferential upregulation of senescence signature genes in aged Tregs, revealed by heatmap analysis of RNA-Seq data sets (D) and by quantitative reverse transcriptase PCR (qRT-PCR) analysis of indicated genes (n = 6 mice of 3 experiments; means ± SD, *P < 0.05, **P < 0.01, ***P < 0.001, ****P < 0.0001, by 1-way ANOVA followed by Tukey’s multiple-comparisons test) (E). (F) Preferential upregulation of the aging program in Tregs in both young (left) and aged (right) mice, revealed by GSEA of RNA-Seq data sets.
Figure 2
Figure 2. Deterioration of Treg function in aged mice.
(A and B) Comparison of the suppressive activity of young and aged Tregs by in vitro suppression assays (A); the composition of Foxp3+ Tregs was also assessed by flow cytometry (B) (n = 3 mice of 3 experiments; representative results are shown; means ± SD, **P < 0.01, ****P < 0.0001, by 2-way ANOVA followed by Holm-Šidák multiple-comparisons test). Tresp cell, responder T cell. (C) Schematic diagram of T cell–induced colitis. Rag1–/– recipients received WT naive CD4+CD45RBhi T cells (Tn) alone or in combination with young or aged CD4+CD25+ Tregs. (D) After transfer, the body weight loss was monitored to examine the suppressive ability of young and old Tregs (n = 10 mice per group of 2 experiments; means ± SEM, *P < 0.05 for young Tregs vs. no Tregs, P = 0.3682 for aged Tregs vs. no Tregs, *P < 0.05 for young Tregs vs. aged Tregs, by 2-way-ANOVA followed by Holm-Šidák test). (E) Percentages of Tregs recovered in periphery lymph nodes (PLN), spleens, and mesenteric lymph nodes (MLN) in recipient mice at the end of the experiments (n = 5 mice of 2 experiments; means ± SD, **P < 0.01, ****P < 0.0001, by 2-way ANOVA followed by Holm-Šidák multiple-comparisons test). (F) Schematic diagram of whole-body irradiation–induced senescence. WT CD45.1 mice were sublethally irradiated and transferred with or without young or aged CD4+CD25+ Tregs. (G) The naive T cell population (CD62LhiCD44loCD45.1+) (left) and p16Ink4a mRNA expression (right) of host Tconv cells in the indicated group of mice were analyzed. (H) The percentage of transferred Tregs (CD45.2+) among host Tregs in the recipient mice (CD45.1+) was analyzed by flow cytometry (n = 3–5 mice of 3 experiments; means ± SD, *P < 0.05, **P < 0.01, ***P < 0.001, by 1-way ANOVA followed by Tukey’s multiple-comparisons test).
Figure 3
Figure 3. DCAF1 deletion leads to T cell aging in young mice.
(A) Protein expression of DCAF1 in Tregs isolated from young and aged mice, assessed by immunoblotting. Left: Representative of 3 independent experiments. Right: Statistical summary, means ± SD, *P < 0.05, by Mann-Whitney U test. (B) SA-β-gal activity in CD4+CD25+ Tregs and CD4+CD25 Tconv cells in splenocytes from mice of indicated genotypes, analyzed by flow cytometry with the fluorescent β-gal substrate C12FDG (gray area, no C12FDG; n = 6 mice of 3 experiments; representative results are shown; means ± SD, ****P < 0.0001, by 1-way ANOVA followed by Tukey’s multiple-comparisons test). (C) Heatmap analysis of RNA-Seq data sets to compare top regulated genes in young WT, young Dcaf1-deficient (KO), and aged WT Tregs. The depicted distance was calculated based on Pearson’s correlation. (D) Upregulation of the aging program in Dcaf1-deficient (KO) Tregs (left) and Tconv cells (right), revealed by GSEA of RNA-Seq data sets. (E) Comparison of aging signature gene expression in indicated T cells by qRT-PCR analysis of indicated genes (n = 10 mice of 4 experiments; means ± SD, *P < 0.05, **P < 0.01, ***P < 0.001, ****P < 0.0001, by 1-way ANOVA followed by Tukey’s multiple-comparisons test).
Figure 4
Figure 4. DCAF1 is required to prevent Treg aging and inflammaging.
(A and B) Distribution of naive and effector memory CD4+ T cells (A) and IFN-γ and IL-4 production of CD4+ T cells (B) in peripheral lymph nodes (PLN) and spleens of 2-month-old mice of indicated genotypes, assessed by flow cytometry (n = 5 mice, 5 experiments; representative results shown; means ± SD, *P < 0.05, **P < 0.01, Mann-Whitney U test). (C and D) Distribution of naive and effector memory CD8+ T cells (C) and IFN-γ and IL-4 production of CD8+ T cells (D) in peripheral lymph nodes and spleens of 2-month-old mice of indicated genotypes, assessed by flow cytometry (n = 5 mice, 5 experiments; representative results shown; means ± SD, **P < 0.01, Mann-Whitney U test). (E) Splenomegaly (left) and increased splenocyte counts (right) in 7- to 12-month-old FGC Dcaf1fl/fl mice (n = 8 mice, 8 experiments; representative results shown, means ± SD, *P < 0.05, 2-sided t test). (F) Histology to compare lymphocytic infiltration in the submandibular gland, kidney, and colon in 7- to 12-month-old littermates of indicated genotypes (scale bar: 100 μm; arrows indicate lymphocyte infiltration foci; results are representative of 5 mice). (G) Comparison of the suppressive activity of Tregs of indicated genotype by in vitro suppression assays (top); the composition of Foxp3+ Tregs was also assessed by flow cytometry (bottom) (n = 3 mice, 3 experiments; representative results shown; means ± SD, **P < 0.01, ***P < 0.001, ****P < 0.0001, 2-way ANOVA followed by Holm-Šidák multiple-comparisons test). (H) Comparison of aging signature gene expression in Tregs and Tconv cells from mice of indicated genotypes, assessed by qRT-PCR analysis of indicated genes (n = 6 mice, 6 experiments; means ± SD, *P < 0.05, **P < 0.01, ****P < 0.0001, 1-way ANOVA followed by Tukey’s multiple-comparisons test).
Figure 5
Figure 5. Dcaf1-deficient Tregs co-opt inflammation to promote the aging of Tconv cells.
(A) Schematic diagram of the generation of mixed bone marrow chimeric mice to contain both FGC Dcaf1fl/+ (CD45.1.2) and FGC Dcaf1fl/fl (CD45.2) T cells. (BE) Flow cytometry of CD44/CD62L expression (B) and cytokine production (C) by CD4+ T cells of indicated genotypes, and of CD44/CD62L expression (D) and cytokine production (E) by CD8+ T cells of indicated genotypes, in peripheral lymph nodes (PLN) and spleens of mixed bone marrow chimeric mice generated as described in A (n = 7 mice of 7 experiments; representative results are shown; means ± SD, by Mann-Whitney U test). (F) Comparison of aging signature gene expression in Tregs and Tconv cells of indicated genotypes in mixed bone marrow chimeric mice generated as described in A (n = 6 mice of 3 experiments; means ± SD, ****P < 0.0001, by 1-way ANOVA followed by Tukey’s multiple-comparisons test). (G) Flow cytometry of Tregs of indicated genotypes in peripheral lymph nodes and spleens of mixed bone marrow chimeric mice generated as described in A (n = 7 mice of 7 experiments; representative results are shown; means ± SD, **P < 0.01, ***P < 0.001, by Mann-Whitney U test).
Figure 6
Figure 6. DCAF1 is required to prevent human T cell aging.
(A) The protein expression of DCAF1 and β-actin in human 293T cells transduced with lentivirus expressing 2 shRNAs targeting Dcaf1 and scrambled control for 4 days. The results are representative of 3 independent experiments. (B) Flow cytometry of ROS level in human T cells transduced with lentivirus expressing 2 shRNAs targeting Dcaf1 and scrambled control for 4 days, analyzed by 2′,7′-dichlorofluorescin diacetate (DCFDA) (gray area, no DCFDA; n = 4; representative results of 2 independent experiments are shown; means ± SD, **P < 0.01, by 1-way ANOVA followed by Tukey’s multiple-comparisons test). (C) SA-β-gal activity in human T cells transduced with lentivirus expressing 2 shRNAs targeting Dcaf1 and scrambled control for 6 days, assessed by flow cytometry with the fluorescent β-gal substrate C12FDG (gray area, no C12FDG; n = 4; representative flow cytometry results are shown; means ± SD, **P < 0.01, ***P < 0.001, by 1-way ANOVA followed by Tukey’s multiple-comparisons test). (D) qRT-PCR analysis to determine mRNA expression of p16Ink4a in human T cells transduced with 2 shRNAs targeting Dcaf1 and scrambled control for 6 days (n = 6 from 2 independent experiments; means ± SD, **P < 0.01, ****P < 0.0001, by 1-way ANOVA followed by Tukey’s multiple-comparisons test).
Figure 7
Figure 7. DCAF1 is required to suppress ROS in Tregs.
(A) Pathways commonly enriched in aged and Dcaf1-deficient (CD4-Cre Dcaf1fl/fl) Tregs based on GSEA of RNA-Seq data sets (FDR < 0.05). (B) Enrichment of ROS pathway in aged versus young WT Tregs (top) and Dcaf1-deficient (KO) versus WT Tregs (bottom) by GSEA of RNA-Seq data sets. (CE) Flow cytometry of ROS level in indicated T cell populations from young WT and aged WT mice (C), young Dcaf1-deficient mice (D) and activated WT and ER-Cre Dcaf1fl/fl CD4+ T cells treated with 4-hydroxy-tamoxifen for indicated days (E), analyzed by DCFDA (gray area, no DCFDA; n = 3 mice of 3 experiments; representative results are shown; means ± SD, **P < 0.01, ***P < 0.001, ****P < 0.0001, by 2-way ANOVA followed by Holm-Šidák multiple-comparisons test). (F and G) Interaction of GSTP1 and DCAF1 by coimmunoprecipitation in 293T cells (F) and by endogenous immunoprecipitation using anti-DCAF1 antibody in mouse T cells (G). The results are representative of 3 independent experiments. (H) GST activity in 293T cells after overexpression of GSTP1 and DCAF1 for 4 days; n = 5; means ± SD, *P < 0.05, **P < 0.01, by Mann-Whitney U test. (I) Flow cytometry of ROS level in activated WT and ER-Cre Dcaf1fl/fl CD4+ T cells transduced with MIT (MSCV-IRES-Thy1.1) or MIT-GSTP1 virus in the presence of 4-hydroxy-tamoxifen, analyzed by DCFDA (gray area, no DCFDA; n = 3–4 experiments; means ± SD, *P < 0.01, **P < 0.05, by 2-way ANOVA followed by Holm-Šidák multiple-comparisons test). (J) Proliferation assayed by BrdU incorporation in young and aged Tregs transduced with MIT or MIT-Gstp1 virus (n = 3 experiments; means ± SD, **P < 0.01, by 1-way ANOVA followed by Tukey’s multiple-comparisons test).
Figure 8
Figure 8. ROS is important for Treg aging and functional deterioration.
(A and B) Flow cytometry of ROS levels in aged Tregs (A) and Dcaf1-deficient (CD4-Cre Dcaf1fl/fl) Tregs (B) in the absence (–) or presence (+) of NAC (20 mM) or GSH (10 mM) (blank, no DCFDA; n = 3 mice of 3 experiments; representative results are shown; means ± SD, ****P < 0.0001, by 1-way ANOVA followed by Tukey’s multiple-comparisons test). (C) Proliferation assayed by BrdU incorporation in aged Tregs in the absence (–) or presence (+) of NAC (20 mM) or GSH (10 mM) (n = 4 mice of 4 experiments; representative results are shown; means ± SD, ****P < 0.0001, by 1-way ANOVA followed by Tukey’s multiple-comparisons test). (D) Proliferation assayed by BrdU incorporation in Dcaf1-deficient (CD4-Cre Dcaf1fl/fl) Tregs in the absence (–) or presence (+) of NAC (20 mM) or GSH (10 mM) (n = 4 mice of 4 experiments; representative results are shown; means ± SD, ****P < 0.0001, by 1-way ANOVA followed by Tukey’s multiple-comparisons test). (E) Suppressive activity of aged Tregs without (–) or with (+) pretreatment of NAC (20 mM) or GSH (10 mM), assessed by in vitro suppression assay (n = 3 mice of 3 experiments; representative results are shown; means ± SD, ****P < 0.0001, by 1-way ANOVA followed by Tukey’s multiple-comparisons test). (F) Suppressive activity of Dcaf1-deficient (CD4-Cre Dcaf1fl/fl) Tregs without (–) or with (+) pretreatment of NAC (20 mM) or GSH (10 mM), assessed by in vitro suppression assays (n = 3 mice of 3 experiments; representative results are shown; means ± SD, ***P < 0.001, by 1-way ANOVA followed by Tukey’s multiple-comparisons test).

References

    1. Fulop T, et al. Immunosenescence and inflamm-aging as two sides of the same coin: friends or foes? Front Immunol. 2017;8:1960. - PMC - PubMed
    1. Partridge L, Deelen J, Slagboom PE. Facing up to the global challenges of ageing. Nature. 2018;561(7721):45–56. doi: 10.1038/s41586-018-0457-8. - DOI - PubMed
    1. Franceschi C, Campisi J. Chronic inflammation (inflammaging) and its potential contribution to age-associated diseases. J Gerontol A Biol Sci Med Sci. 2014;69(suppl 1):S4–S9. doi: 10.1093/gerona/glu057. - DOI - PubMed
    1. Kennedy BK, et al. Geroscience: linking aging to chronic disease. Cell. 2014;159(4):709–713. doi: 10.1016/j.cell.2014.10.039. - DOI - PMC - PubMed
    1. Ovadya Y, et al. Impaired immune surveillance accelerates accumulation of senescent cells and aging. Nat Commun. 2018;9(1):5435. doi: 10.1038/s41467-018-07825-3. - DOI - PMC - PubMed

Publication types

MeSH terms

Substances