. 2020 Jul 30;16(7):e1008944.
doi: 10.1371/journal.pgen.1008944. eCollection 2020 Jul.

Introns mediate post-transcriptional enhancement of nuclear gene expression in the green microalga Chlamydomonas reinhardtii

Affiliations

Introns mediate post-transcriptional enhancement of nuclear gene expression in the green microalga Chlamydomonas reinhardtii

Thomas Baier et al. PLoS Genet. .

Abstract

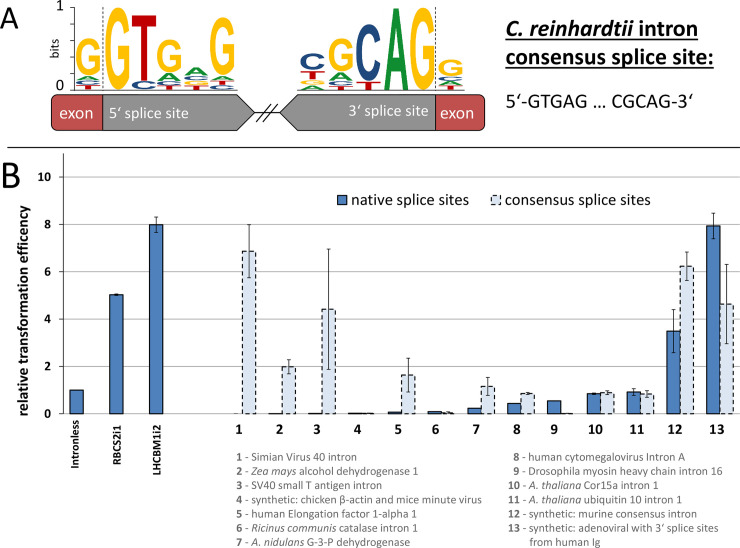
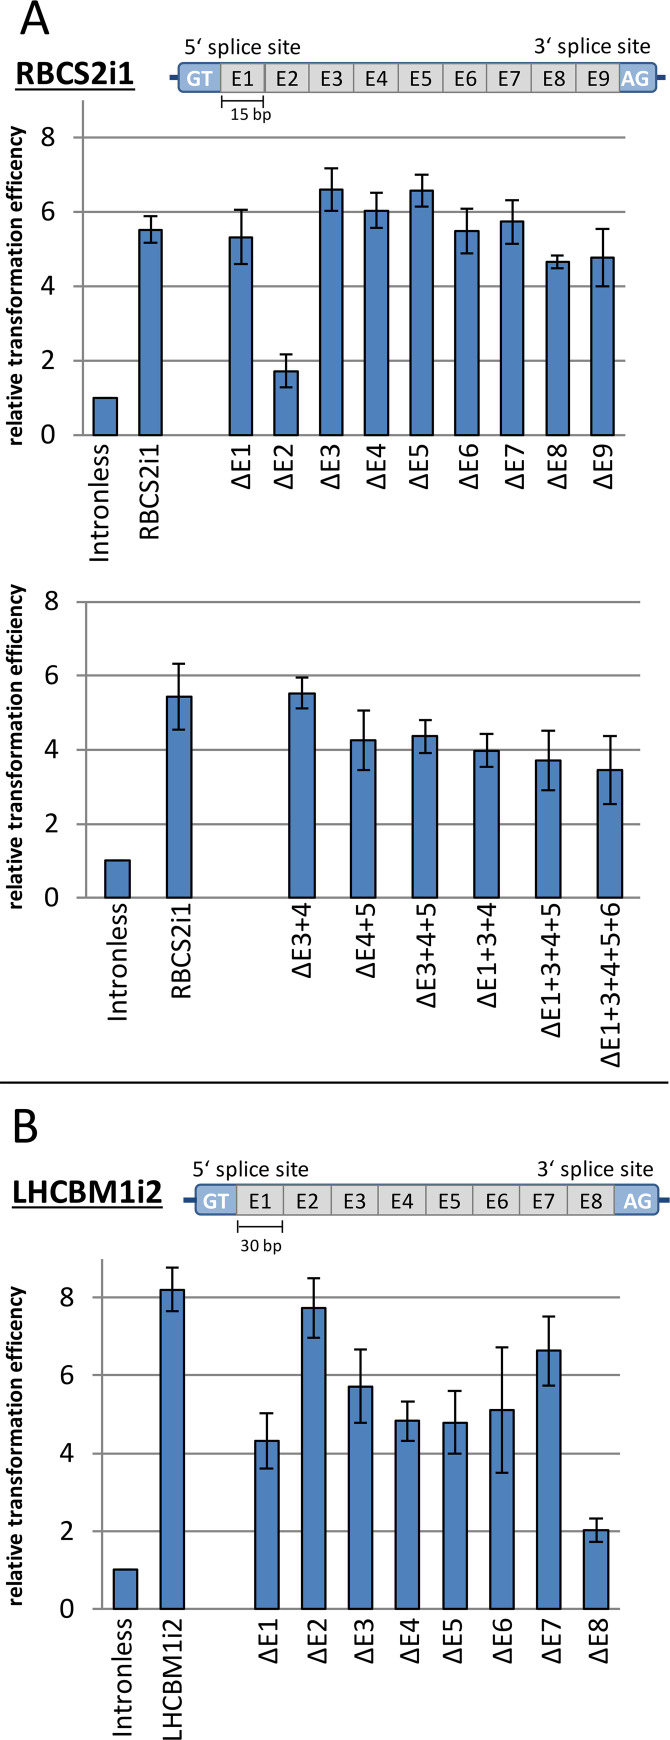
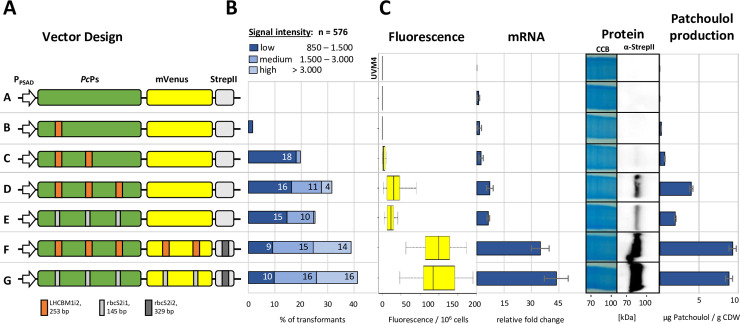
Efficient nuclear transgene expression in the green microalga Chlamydomonas reinhardtii is generally hindered by low transcription rates. Introns can increase transcript abundance by a process called Intron-Mediated Enhancement (IME) in this alga and has been broadly observed in other eukaryotes. However, the mechanisms of IME in microalgae are poorly understood. Here, we identified 33 native introns from highly expressed genes in C. reinhardtii selected from transcriptome studies as well as 13 non-native introns. We investigated their IME capacities and probed the mechanism of action by modification of splice sites, internal sequence motifs, and position within transgenes. Several introns were found to elicit strong IME and found to be broadly applicable in different expression constructs. We determined that IME in C. reinhardtii exclusively occurs from introns within transcribed ORFs regardless of the promoter and is not induced by traditional enhancers of transcription. Our results elucidate some mechanistic details of IME in C. reinhardtii, which are similar to those observed in higher plants yet underly distinctly different induction processes. Our findings narrow the focus of targets responsible for algal IME and provides evidence that introns are underestimated regulators of C. reinhardtii nuclear gene expression.


Conflict of interest statement

The authors have declared that no competing interests exist.

Figures

Fig 1
Fig 1. Relative transformation efficiencies of 33 endogenous introns.
(A) Gene design of a shble antibiotic selection cassette for scarless insertions of endogenous introns into a N-terminal linker sequence containing an appropriate splice site (GG). The intron-mediated expression is reflected by the respective number of regenerated transformant colonies normalized to the intronless control. Exemplary transformation plates are depicted for an intronless and an intron-containing RBCS2i1 construct. (B) The respective sequence identity and relative transformation efficiency of investigated endogenous introns. Gene-clustered expression levels are shown in S7 Fig. Error bars represent standard deviations from the mean of triplicate measurements. Complete intron sequences are given in S1 Data. PPSAD−promoter and 5’UTR of the C. reinhardtii PSAD gene, shble–S. hindustanus phleomycin resistance gene, 3’UTR– 3′ untranslated region of the C. reinhardtii RBCS2 gene.
Fig 2
Fig 2. Relative transformation efficiencies of 13 exogenous introns.
(A) Schematic Weblogo of intron consensus sequences at the 5’ and 3’ internal splice sites of introns from C. reinhardtii. (B) The respective sequence identity and relative transformation efficiency of investigated exogenous introns and the endogenous RBCS2i1 and LHCBM1i2 normalized to the intronless control. Efficiency is shown for introns in their native sequence boundaries (dark blue) and after modification to match the C. reinhardtii consensus sequence (light blue hashed lines). Error bars represent standard deviations from the mean of triplicate measurements. Complete intron sequences are given in S1 Data. PPSAD−promoter and 5’UTR of the C. reinhardtii PSAD gene, shble–S. hindustanus phleomycin resistance gene, 3’UTR– 3′ untranslated region of the C. reinhardtii RBCS2 gene.
Fig 3
Fig 3. Internal deletion study for two stimulating intron sequences.
(A) The RBCS2i1 sequence was subdivided into 15 bp long sequence elements (E1-E9) with 5 bp intron boundaries left un-modified (indicated as GT and AG). The respective relative transformation efficiency after gradual deletion (ΔE1-E9) was compared to the full-length RBCS2i1 and to the intronless shble control. Below the relative transformation efficiencies are shown after deletions of E1-E9 section combinations from the RBCS2i1 sequence. (B) Corresponding deletion study of LHCBM1i2 with 30 bp deletions (ΔE1-E8). Error bars represent standard deviations from the mean of triplicate measurements.
Fig 4
Fig 4. Relative transformation efficiency of the shble construct containing RBCS2i1 and LHCBM1i2 insertions at different positions.
Insertion sites were selected based on the gene design and availability of respective restriction enzyme recognition sites present in the vector system. The insertion positions and the respective distances are indicated in a schematic figure: A—in front of the PSAD promoter (MluI), B—in the 5’UTR (HindIII), C—in the CDS, near the TSS (SmaI), D–in the 3’UTR (XhoI), E–downstream of the construct (KpnI). Error bars represent standard deviations from the mean of triplicate measurements. PPSAD−promoter and 5’UTR of the C. reinhardtii PSAD gene, shble–S. hindustanus phleomycin resistance gene, 3’UTR– 3′ untranslated region of the C. reinhardtii RBCS2 gene.
Fig 5
Fig 5. Effects of intron addition on transgene expression levels of the codon-optimized P. cablin Benth. patchoulol synthase (PcPs) gene.
(A) Vector design of intron-containing construct variants in the modified pOptimized vector (vector A-G, sequence S3 Data). (B) Initial fluorescence screening of 576 isolated transformants. Absolute signals were grouped into three intensity levels: low (850–1500 relative fluorescence units, rfu), medium (1500–3000 rfu) and high (>3000 rfu). Numbers indicate the respective percentage of the initial population. (C) The 20 best transformants from the initial population were isolated and expression was quantified as mean fluorescence per cell, relative mRNA abundance (RTqPCR), protein titer (WB–western blot, α-Strep-tag II with Coomassie Brilliant Blue (CBB) as loading control) and patchoulol production (GC-MS). Cultivations were conducted in microtiter plates and transformants were pooled according to their respective cell densities prior to analysis. Samples of strain UVM4 served as the respective parental control. Error bars represent standard deviations from the mean of triplicate measurements of pooled 20 transformants. PPSAD−promoter and 5’UTR of the C. reinhardtii PSAD gene, mVenus–yellow fluorescent protein variant, StrepII–Strep-tag II epitope.

References

    1. Vannini A, Cramer P. Conservation between the RNA Polymerase I, II, and III Transcription Initiation Machineries. Mol Cell. 2012;45: 439–446. 10.1016/j.molcel.2012.01.023 - DOI - PubMed
    1. Hobert O. Gene Regulation by Transcription Factors and MicroRNAs. Science (80-). 2008;319: 1785–1786. 10.1126/science.1151651 - DOI - PubMed
    1. Chen K, Rajewsky N. The evolution of gene regulation by transcription factors and microRNAs. Nat Rev Genet. 2007;8: 93–103. 10.1038/nrg1990 - DOI - PubMed
    1. Bonasio R, Shiekhattar R. Regulation of Transcription by Long Noncoding RNAs. Annu Rev Genet. 2014;48: 433–455. 10.1146/annurev-genet-120213-092323 - DOI - PMC - PubMed
    1. Hunter T, Karin M. The regulation of transcription by phosphorylation. Cell. 1992;70: 375–387. 10.1016/0092-8674(92)90162-6 - DOI - PubMed

Publication types

MeSH terms