. 2020 Aug 20;182(4):1009-1026.e29.
doi: 10.1016/j.cell.2020.07.001. Epub 2020 Jul 29.

An Activity-Guided Map of Electrophile-Cysteine Interactions in Primary Human T Cells

Affiliations

An Activity-Guided Map of Electrophile-Cysteine Interactions in Primary Human T Cells

Ekaterina V Vinogradova et al. Cell. .

Abstract

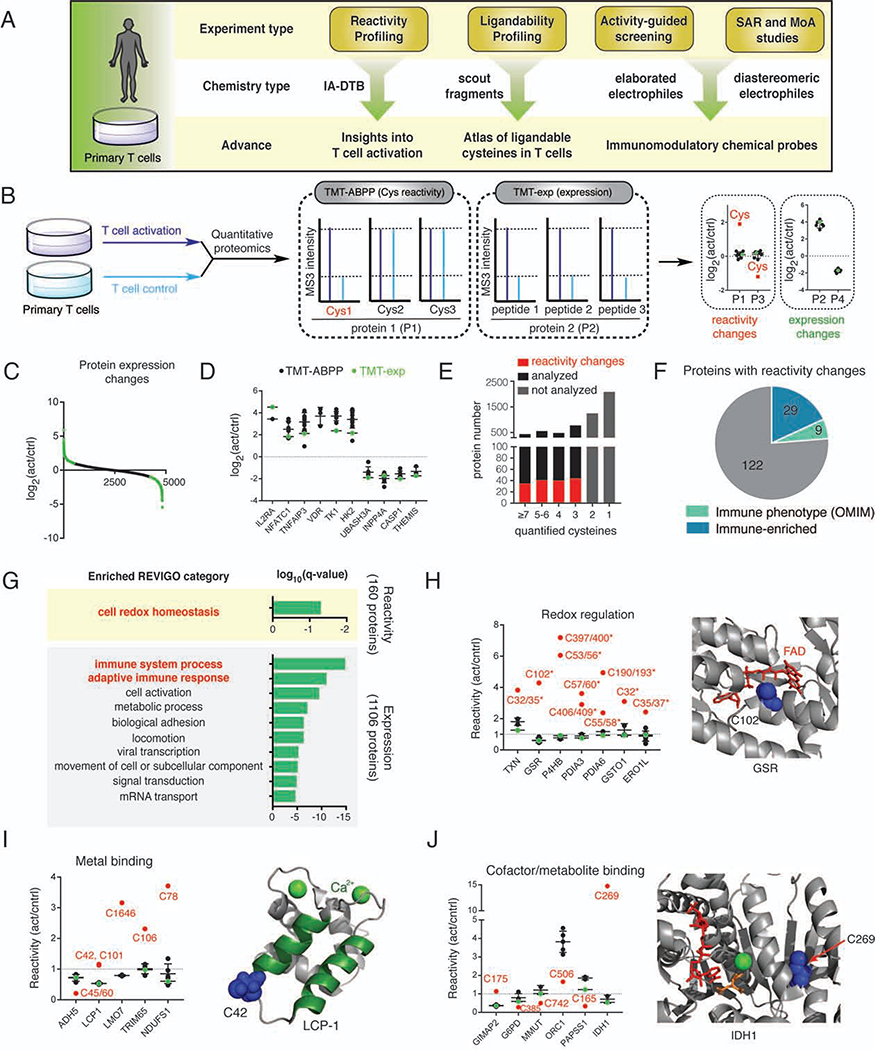
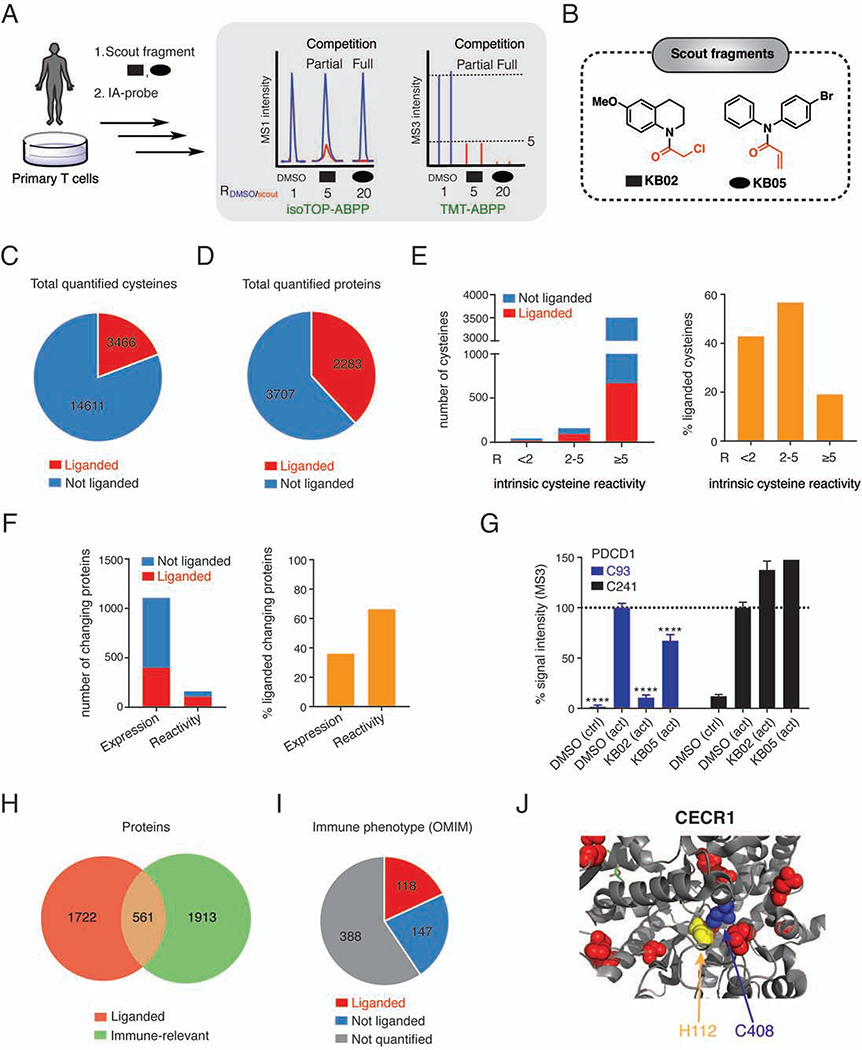
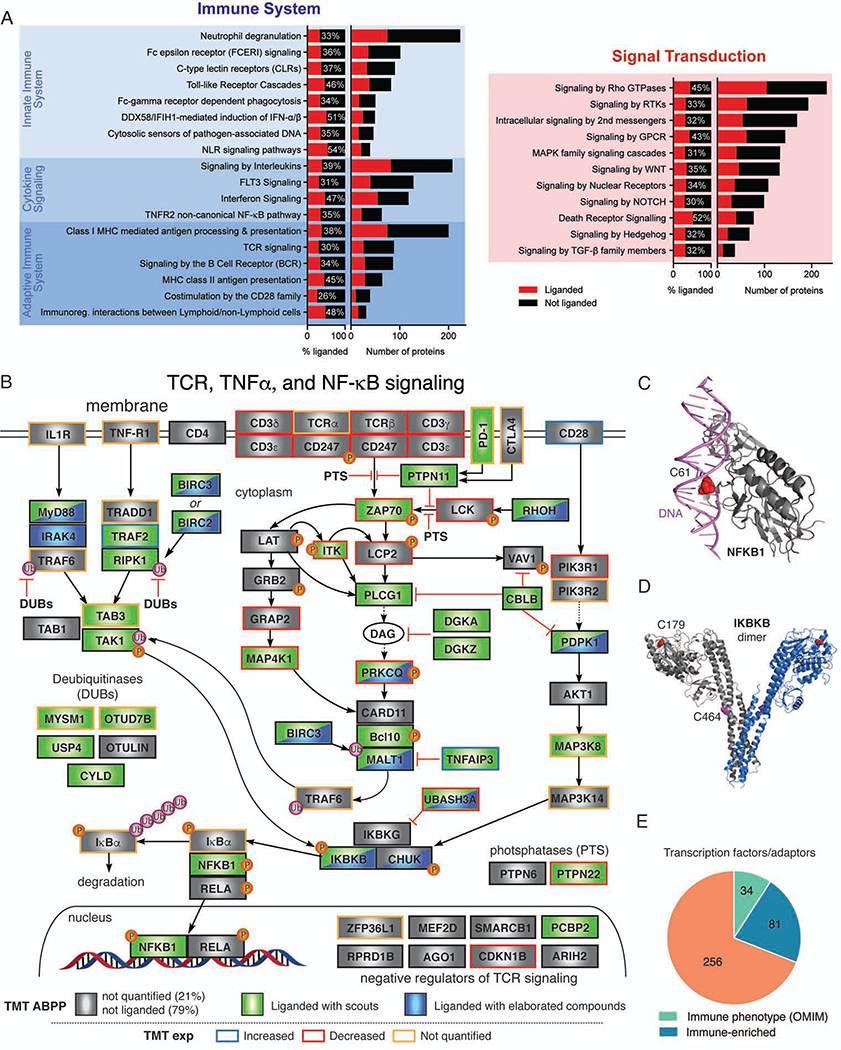
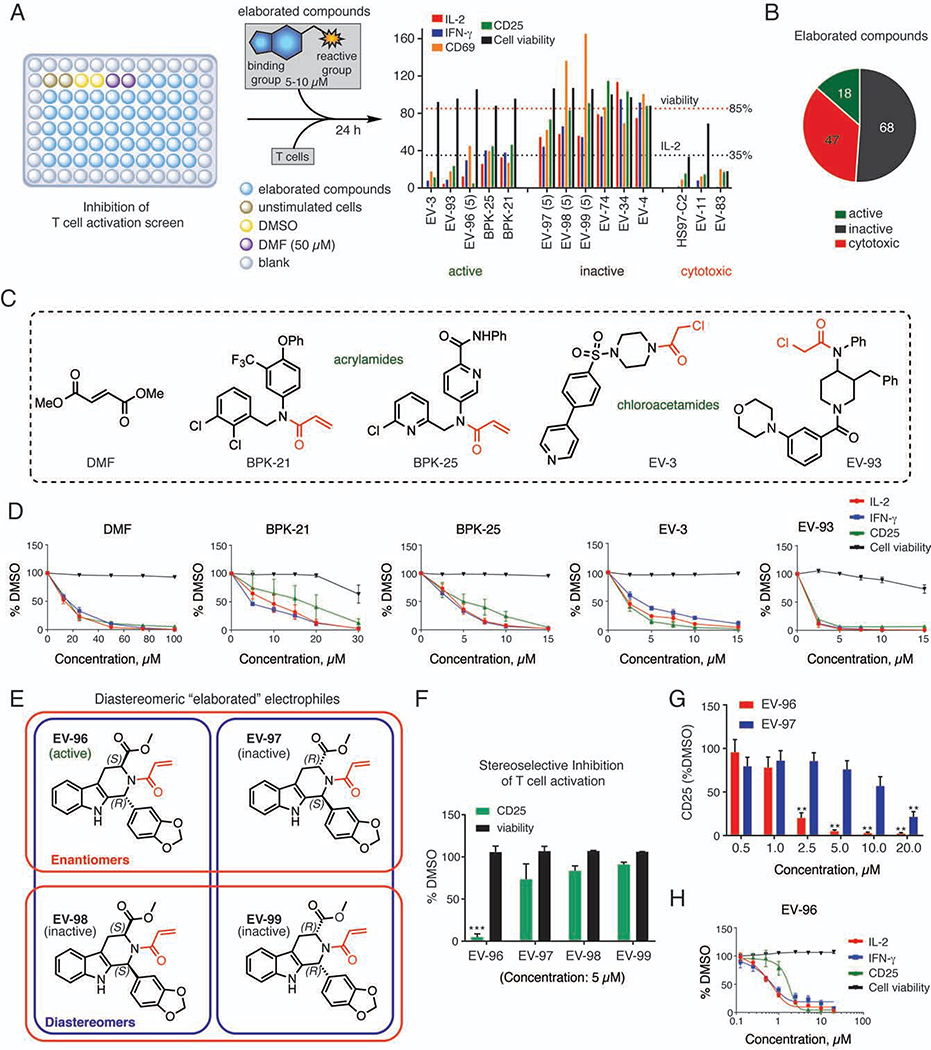
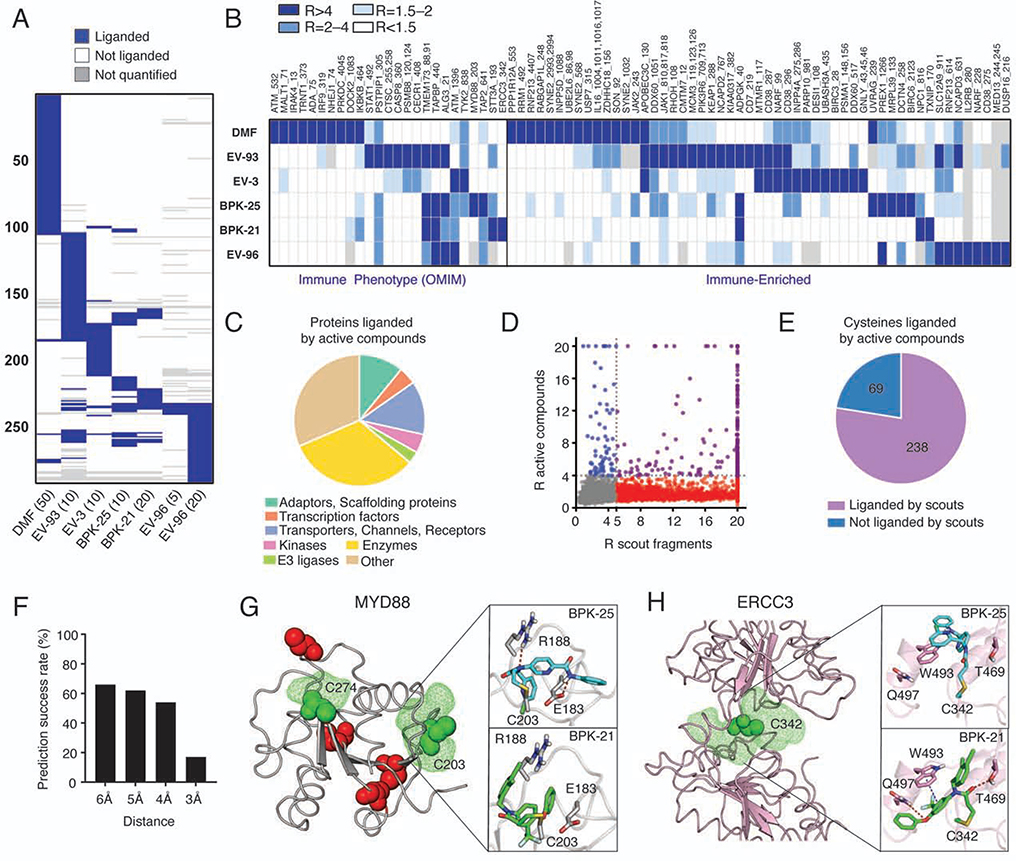
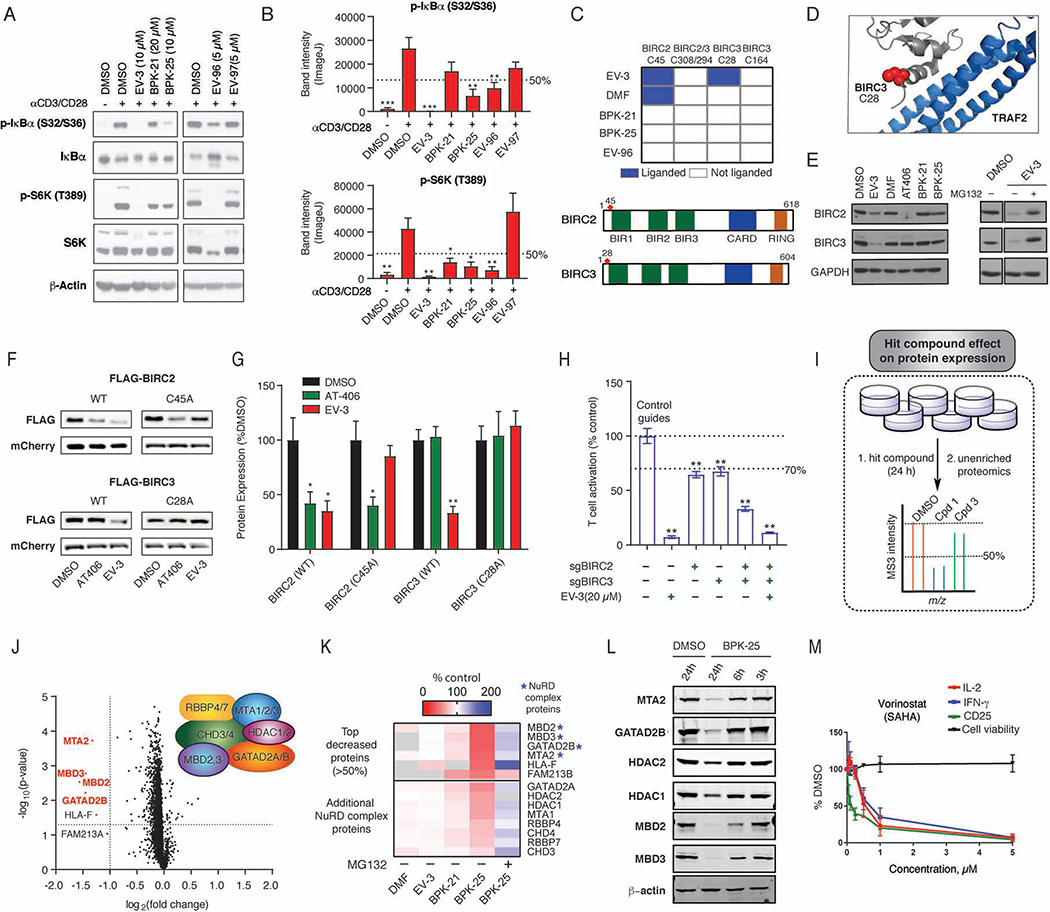
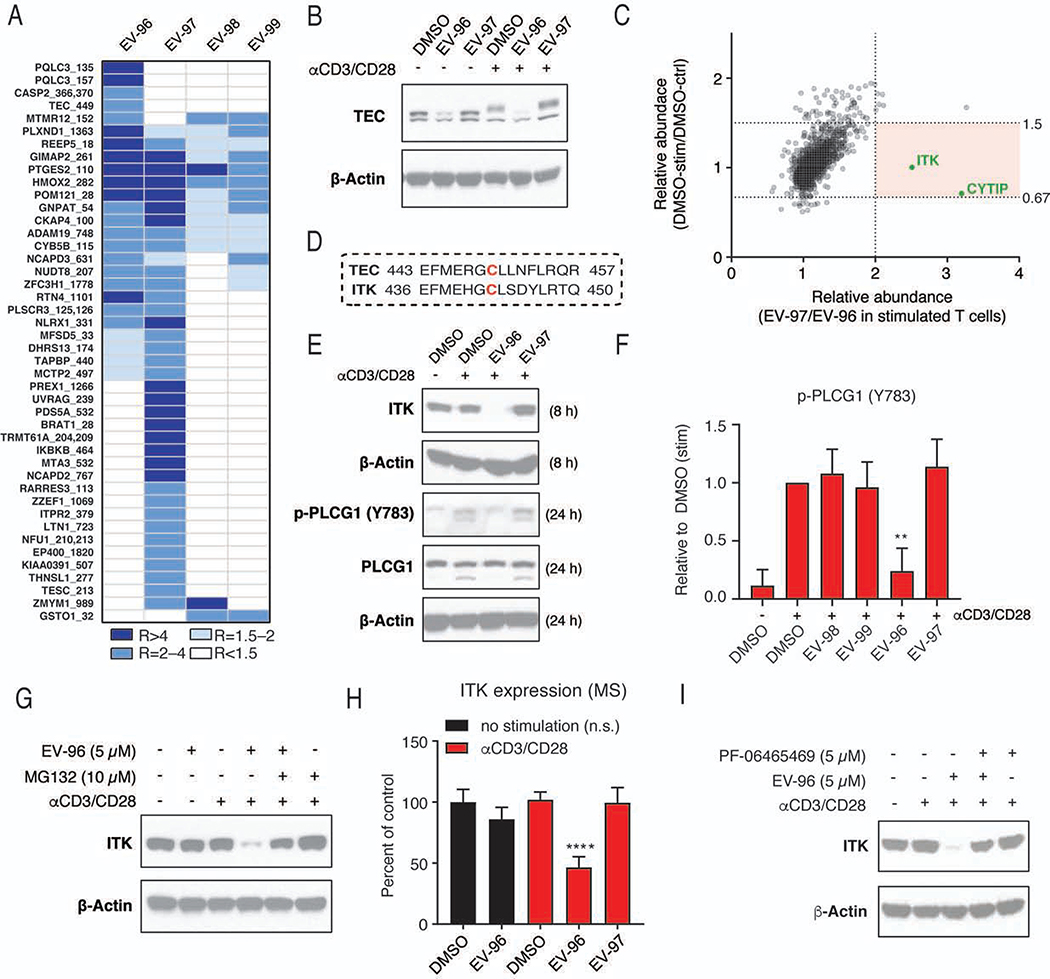
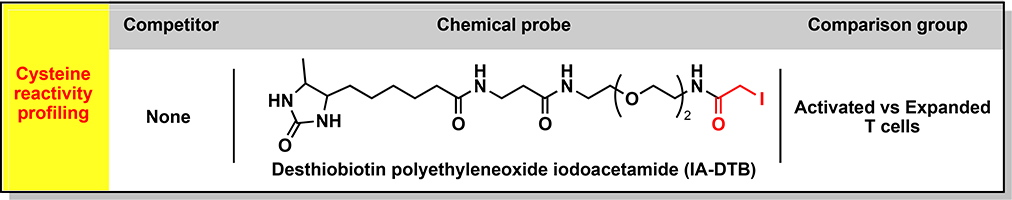
Electrophilic compounds originating from nature or chemical synthesis have profound effects on immune cells. These compounds are thought to act by cysteine modification to alter the functions of immune-relevant proteins; however, our understanding of electrophile-sensitive cysteines in the human immune proteome remains limited. Here, we present a global map of cysteines in primary human T cells that are susceptible to covalent modification by electrophilic small molecules. More than 3,000 covalently liganded cysteines were found on functionally and structurally diverse proteins, including many that play fundamental roles in immunology. We further show that electrophilic compounds can impair T cell activation by distinct mechanisms involving the direct functional perturbation and/or degradation of proteins. Our findings reveal a rich content of ligandable cysteines in human T cells and point to electrophilic small molecules as a fertile source for chemical probes and ultimately therapeutics that modulate immunological processes and their associated disorders.

Keywords: BIRC3; ITK; T cells; activity-based protein profiling; chemical proteomics; covalent; cysteine; electrophiles; human; protein degradation.


Conflict of interest statement

Declaration of Interests B.F.C. is a founder and scientific advisor to Vividion Therapeutics. B.F.C., V.M.C., B.M., D.R., M.A.S., E.V.V., X.Z., and M.Y. are co-inventors on a patent application related to this work.

Figures

Figure 1.
Figure 1.. Chemical proteomic map of cysteine reactivity changes in activated T cells.
(A) Organizational diagram outlining the types of chemical proteomic experiments and electrophilic small molecules used to investigate and modulate the activation of primary human T cells, as well as the major advances enabled by each experiment type. IA-DTB - desthiobiotin polyethyleneoxide iodoacetamide; SAR – structure-activity relationship; MoA – mechanism of action. (B) Workflow for proteomic experiments measuring cysteine reactivity (TMT-ABPP) and protein expression (TMT-exp) in primary human T cells. See STAR Methods for more details. (C) Protein expression differences between control and activated T cells. Results represent mean values from four biological replicates. (D) Representative protein expression differences between control and activated T cells, where results from both TMT-ABPP (black dots) and TMT-exp (green dots) concordantly support expression changes. (E) Fraction of proteins with cysteine reactivity changes observed for total proteins with the indicated numbers of quantified cysteines in TMT-ABPP experiments. Proteins with only 1–2 quantified cysteines were not interpreted for reactivity changes (gray bars). (F) Fraction of proteins with human genetics-based immune phenotypes and immune-enriched expression from total proteins showing cysteine reactivity changes in activated T cells (Data S1). (G) GO-term enrichment analysis for proteins undergoing reactivity (top, 160 total proteins) or expression (bottom, 1106 total proteins) changes in activated T cells. Top-10 enriched biological processes are shown for the expression changes group (Data S1). Red bold font highlights immune-relevant and cell redox homeostasis pathways enriched in expression and reactivity changes groups, respectively. (H-J) Representative cysteine reactivity changes in activated T cells organized by functional category. Horizontal black lines mark average reactivity value for quantified cysteines from each protein, excluding the reactivity-changing cysteine(s), which are shown in red. (H) Active-site cysteines in redox-related proteins; crystal structure of glutathione reductase (GSR; PDB: 1GRF) with the reactivity-changing C102 shown in blue. (I) Metal-binding cysteines; NMR structure of the EF-hand domain of LCP-1 (PDB: 5JOJ) with the reactivity-changing C42 shown in blue. (J) Cysteines at cofactor/metabolite-binding sites; crystal structure of isocitrate dehydrogenase 1 (IDH1) in complex with NADP (red), isocitrate (orange), and calcium (green ball) (PDB: 1T0L) with the reactivity-changing C269 highlighted in blue.
Figure 2.
Figure 2.. Chemical proteomic map of fragment electrophile-cysteine interactions in T cells.
(A) Workflow for chemical proteomic experiments measuring scout fragment engagement of cysteines in primary human T cells. See STAR Methods for more details. (B) Structures of scout fragments KB02 and KB05. Red color indicates the reactive group for each fragment. (C, D) Pie chart representations of cysteines (C) and proteins (D) liganded by scout fragments. Results were obtained by combining soluble and particulate proteomic data for KB02 and KB05 treatments (500 μM, 1 h) of both control and activated T cells. R-values within each group were derived from 3–5 independent isoTOP-ABPP and TMT-ABPP experiments. (E) Total number (left) and percentage (right) of liganded cysteines per total number of cysteines quantified across the indicated intrinsic reactivity ranges, which were determined as described previously (Weerapana et al., 2010). (F) Total number (left) and percentage (right) of liganded proteins with expression or reactivity changes in activated T cells. (G) Quantification of cysteines in PDCD1, revealing elevated expression of this protein in activated T cells (increased intensity of DMSO (act) signals for C93 and C241) and scout fragment-sensitivity for C93. Error bars represent SD from 2–4 independent experiments. ****, p < 0.0001 compared to DMSO (act) group. (H) Overlap of liganded proteins with immune-relevant proteins (Data S1). (I) Fractions of liganded and quantified proteins from total proteins in OMIM database with immune phenotypes (Data S1, see STAR Methods for details). (J) Location of liganded C408 (blue) and pathogenic missense mutations (yellow – mutation of H112, which is within 5 Å of C408, red – other mutations) in structure of adenosine deaminase CECR1 (PDB: 3LGD).
Figure 3.
Figure 3.. Liganded cysteines in immune-relevant proteins.
(A) Ligandability analysis of Reactome pathways within Immune System (left, hierarchical level 2 grouped according to their parent nodes) or Signal Transduction (right, hierarchical level 2) categories. Liganded and quantified proteins are colored red and black, respectively. Also see Data S1. (B) Diagram of TCR, TNF-alpha and NF-κB pathways marking proteins that possess cysteines liganded by scout fragments (green) or elaborated electrophilic compounds (blue). The rectangular frame around each protein is colored to reflect expression changes (blue, >2 fold, red, <2 fold, and black, unchanged, in activated T cells; yellow not quantified). (C) Location of a liganded C61 at the DNA-binding interface of NFKB1 (CPDB: 2O61). (D) Location of liganded active-site (C179) and non-active site (C464) cysteines in IKBKB (PDB: 4E3C). (E) Fractions of liganded transcription factor and adaptor proteins that are also immune-relevant; Data S1.
Figure 4.
Figure 4.. Elaborated electrophilic compounds that suppress T-cell activation.
(A) Workflow for T-cell activation screen. Primary human T cells were treated with compounds (10 μM) or DMSO under TCR-stimulating conditions (96-well plates pre-coated with 5 μg/mL αCD3 and 2 μg/mL αCD28) for 24h. T-cell activation was measured by IL-2 and IFN-γ secretion and surface expression of CD25 and CD69. Compounds were considered as active hits if they reduced IL-2 by >65% with <15% reduction in cell viability compared to DMSO control. (B) Screening results for elaborated electrophilic compounds. (C) Structures of active compounds selected for follow-up studies: acrylamides (BPK-21, BPK-25), α-chloroacetamides (EV-3, EV-93), and DMF as a positive control. Red color indicates the reactive group for each elaborated compound. (D) T-cell activation and cytotoxicity profiles for active compounds. Data are mean values ± SEM; n = 3/group. (E, F) Structures (E) and activity (F) of four stereoisomeric compounds, where one compound (EV-96) inhibited T-cell activation (F). In (E), the stereoisomeric relationships are shown in blue (diastereomers) and red (enantiomers). Red color in chemical structures indicates the acrylamide reactive group. In (F), T-cell activation (CD25) and cytotoxicity profiles are shown for the stereoisomeric compounds (5 μM, 24 h treatment). Data are mean values ± SD; n = 2–5/group. ***p < 0.001 compared to EV-97. (G) Concentration-dependent effects of EV-96 and EV-97 on T-cell activation (CD25). Data are mean values ± SEM; n = 4–5/group. **, p < 0.01 compared to 0.5 μM treatment groups. (H) T-cell activation and cytotoxicity profiles for EV-96. Data are mean values ± SEM; n = 3–5/group.
Figure 5.
Figure 5.. Cysteines liganded by active compounds in human T cells.
(A) Heatmap showing liganded cysteines for active compounds in human T cells (treated with the indicated concentrations of compounds (μM) for 3 h followed by ABPP). Cysteines quantified for at least two active compounds with R values ≥4 (DMSO/compound) for at least one of the compounds are shown. Results were obtained by combining isoTOP-ABPP and TMT-ABPP data from 2–6 independent experiments. See STAR Methods for details. (B) Heatmap showing cysteines liganded by active compounds in immune-relevant proteins. (C) Distribution of protein classes containing cysteines liganded by active compounds. (D, E) Comparison of cysteines liganded by active compounds versus scout fragments in human T cells, as displayed in correlation plot (D) and pie chart (E) analyses. In (D), cysteines liganded by both active compounds and scout fragments, only by active compounds, and only by scout fragments are showing in purple, blue, and red, respectively. (F) Prediction success rate querying for pockets within the indicated distances from cysteines liganded by active compounds. (G) Modeling of active compound interactions with C203 in MYD88 (PDB 4DOM). Predicted pockets highlighted as green mesh and other cysteines in the structure are colored red. Docking shows preferential liganding by BPK-25 due to predicted hydrogen bonds with E183 and R188 (top), which are not accessible in docked structure of BPK-21 (bottom). (H) Modeling of active compound interactions with C342 of ERCC3 (PDB 5OF4). Docking shows preferential liganding by BPK-21 (bottom) due to predicted hydrogen bonds with T469 and Q497 and π−π interaction with W493, which are less accessible in the docked structure of BPK-25 (bottom).
Figure 6.
Figure 6.. Mechanistic analysis of active compounds in human T cells.
(A, B) Effects of active compounds on NFκB and mTOR pathways, as determined by western blotting for phosphorylation of IκBα (S32/S36) and S6K (T389), respectively, in stimulated T cells treated with DMSO, active or control (EV-97) compounds for 24 h. (A) Representative western blots. (B) Quantitation of p-IκBα (S32/S36) and p-S6K (T389). Data are mean ± SEM; n = 3–8/group. *, p < 0.05; **, p < 0.01; ***, p < 0.001 compared to DMSO (αCD3/αCD28) control. (C) Top: Heat map showing active compounds interactions with cysteines in BIRC2 and BIRC3. Bottom: Domain maps highlighting location of EV-3-sensitive C45 and C28 in BIRC2 and BIRC3, respectively. (D) Location of C28 in structure of a BIRC3-TRAF2 protein complex (PDB: 3M0A). (E) Western blots showing reductions in BIRC2 and BIRC3 content in human T cells treated with EV-3 (10 μM), but not other active compounds (DMF (50 μM), BPK-21 (20 μM), and BPK-25 (10 μM)). The BIR3 domain ligand AT406 (1 μM) caused loss of BIRC2, but not BIRC3. Right panels: western blots showing that the proteasome inhibitor MG132 (10 μM) blocks EV-3-induced loss of BIRC2 and BIRC3. All treatments were for 24 h. (F-G) Impact of cysteine mutagenesis on EV-3-mediated degradation of BIRC2 and BIRC3. FLAG-tagged wild-type (WT) or the indicated cysteine-to-alanine mutants of BIRC2 (C45A) and BIRC3 (C28A) were expressed in primary human T cells. An mCherry-expressing plasmid was used to control for transfection efficiency. Cells were then treated with DMSO, EV-3 (10 μM), or AT-406 (1 μM) for 24 h and analyzed by anti-FLAG blotting (F). (G) Quantitation of data, shown as mean values ± SEM; n = 3/group. *p < 0.05; **p < 0.01 compared to respective DMSO controls. (H) Effect of genetic disruption of BIRC2 and/or BIRC3 by CRISPR/Cas9 genome editing on T-cell activation. Target disruption was considered to have an effect on T-cell activation if suppression was >33% with a p value < 0.01. Data are mean values ± SEM; n = 6/group. **, p < 0.01 compared to control guides. (I) Workflow for TMT-exp experiments evaluating protein expression changes caused by active compound treatment in human T cells. (J) Volcano plot representation of protein expression changes caused by BPK-25 (10 μM, 24 h) with significant decreases in NuRD complex proteins highlighted in red. (K) Heatmap of top proteins with decreased expression in BPK-25-treated T cells showing that NuRD complex proteins (asterisks) were largely unaltered by other active compounds and blocked in degradation by MG132. Additional NuRD complex proteins also showed evidence of reduced expression (25–50%) in T cells treated with BPK-25. (L) Representative western blot of time-dependent reductions in NuRD complex proteins in human T cells treated with BPK-25 (10 μM). (M) T-cell activation and cytotoxicity profile of the pan-HDAC inhibitor vorinostat. Data are mean values ± SD; n = 2–4/group.
Figure 7.
Figure 7.. EV-96 stereoselectively engages and degrades immune kinases in T cells.
(A) Heatmap showing cysteines engaged >50% by stereoisomeric compounds (5 μM, 3 h). For inclusion in the map, cysteines were also required to show increased engagement by the relevant stereoisomeric electrophile at 20 μM (see Data S1). (B) Western blot showing decreased TEC protein in human T cells treated with EV-96, but not EV-97 (5 μM each, 24 h). (C) TMT-exp experiments comparing protein expression in DMSO-treated αCD3/CD28-stimulated (DMSO-stim)-versus-naïve control (DMSO-ctrl) T cells (y-axis) and EV-97-treated-versus-EV-96-treated stimulated T cells (x-axis). T cells were treated with DMSO or compounds (5 μM each) for 8 h. Red background denotes proteins with: i) > 2-fold expression in stimulated T cells treated with EV-97 versus EV-96; and ii) < 1.5 fold change in expression in DMSO-stim vs DMSO-ctrl T cells. The two proteins in this region are colored green. Proteins showing >2-fold changes in expression in DMSO-stim vs DMSO-ctrl T cells were removed from the analysis. (D) Protein sequences showing EV-96-liganded cysteine in TEC (C449) and its conservation in ITK (C442). (E, F) Western blot analysis (E) showing reductions in ITK protein (8 h) and PLCG1 phosphorylation (Y783, 24 h) in αCD3/CD28-stimulated (stim) T cells treated with EV-96, but not EV-97 (5 μM each). (F) Quantitation of data, shown as mean values ± SD; n = 2–5/group. **p < 0.01 compared to EV-97 treatment. (G) Western blot analysis showing reductions in ITK protein in stimulated, but not control (naïve) T cells treated with EV-96 (5 μM). Co-treatment with the proteasome inhibitor MG132 (10 μM) blocks EV-96-induced reductions in ITK. All treatments were performed for 8 h. See Figure S7D for quantitation of these western blotting data. (H) Quantitation of TMT-exp data showing effects of EV-96 and EV-97 (5 μM each, 8 h) on ITK protein in naïve control (ctrl) T cells versus αCD3/CD28-treated (stimulated, stim) T cells. Data are mean values ± SEM; n = 4/group. ****p < 0.0001 compared to DMSO-treated stim control. (I) Western blot showing that pre-treatment with the ITK inhibitor PF-064655469 (1 h, 5 μM) blocks EV-96-induced degradation of ITK, but did not independently alter ITK protein in T cells.
None
None
None
None

References

    1. Acuto O, and Cantrell D (2000). T cell activation and the cytoskeleton. Annu Rev Immunol 18, 165–184. - PubMed
    1. Agata Y, Kawasaki A, Nishimura H, Ishida Y, Tsubata T, Yagita H, and Honjo T (1996). Expression of the PD-1 antigen on the surface of stimulated mouse T and B lymphocytes. International immunology 8, 765–772. - PubMed
    1. Almeida L, Lochner M, Berod L, and Sparwasser T (2016). Metabolic pathways in T cell activation and lineage differentiation. Semin Immunol 28, 514–524. - PubMed
    1. Andreotti AH, Joseph RE, Conley JM, Iwasa J, and Berg LJ (2018). Multidomain Control Over TEC Kinase Activation State Tunes the T Cell Response. Annu Rev Immunol 36, 549–578. - PubMed
    1. Ashburner M, Ball CA, Blake JA, Botstein D, Butler H, Cherry JM, Davis AP, Dolinski K, Dwight SS, Eppig JT, et al. (2000). Gene ontology: tool for the unification of biology. The Gene Ontology Consortium. Nat Genet 25, 25–29. - PMC - PubMed

Publication types

MeSH terms