

Estimating Shortages in Capacity to Deliver Continuous Kidney Replacement Therapy During the COVID-19 Pandemic in the United States
- PMID: 32730812
- PMCID: PMC7385068
- DOI: 10.1053/j.ajkd.2020.07.005
Estimating Shortages in Capacity to Deliver Continuous Kidney Replacement Therapy During the COVID-19 Pandemic in the United States
Abstract
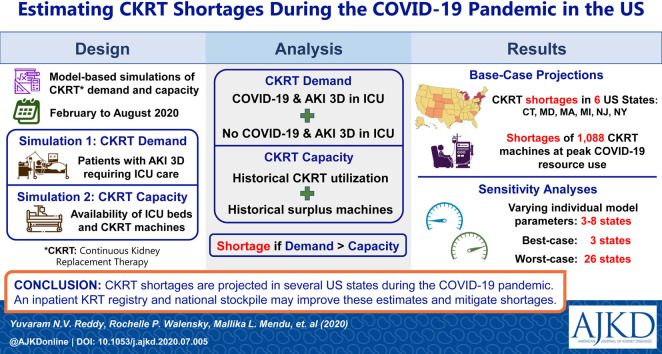
Rationale & objective: During the coronavirus disease 2019 (COVID-19) pandemic, New York encountered shortages in continuous kidney replacement therapy (CKRT) capacity for critically ill patients with acute kidney injury stage 3 requiring dialysis. To inform planning for current and future crises, we estimated CKRT demand and capacity during the initial wave of the US COVID-19 pandemic.
Study design: We developed mathematical models to project nationwide and statewide CKRT demand and capacity. Data sources included the Institute for Health Metrics and Evaluation model, the Harvard Global Health Institute model, and published literature.
Setting & population: US patients hospitalized during the initial wave of the COVID-19 pandemic (February 6, 2020, to August 4, 2020).
Intervention: CKRT.
Outcomes: CKRT demand and capacity at peak resource use; number of states projected to encounter CKRT shortages.
Model, perspective, & timeframe: Health sector perspective with a 6-month time horizon.
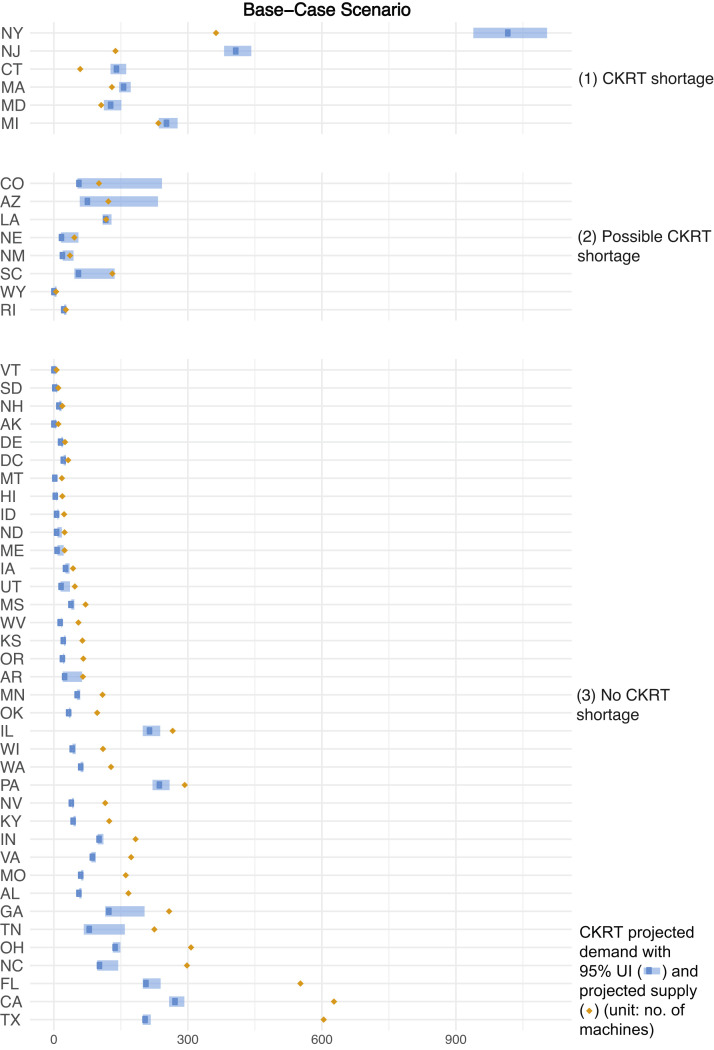
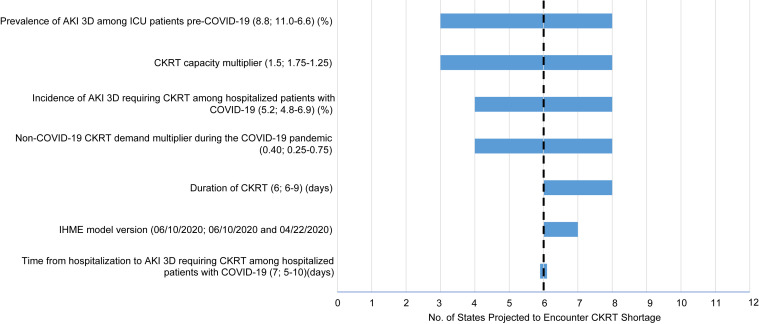
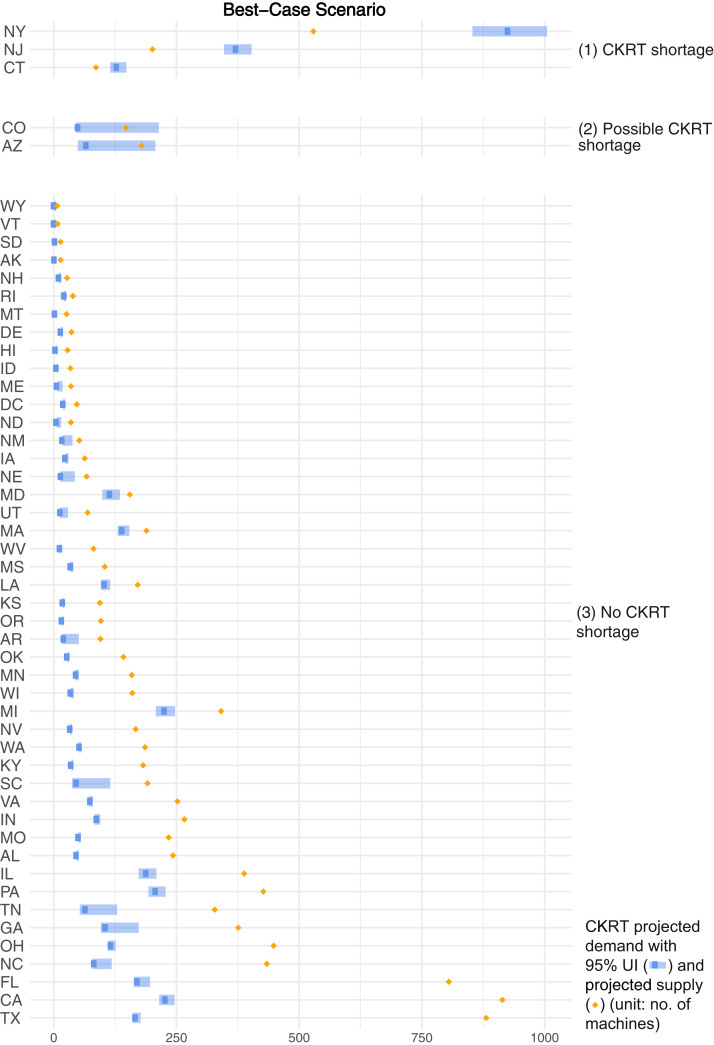
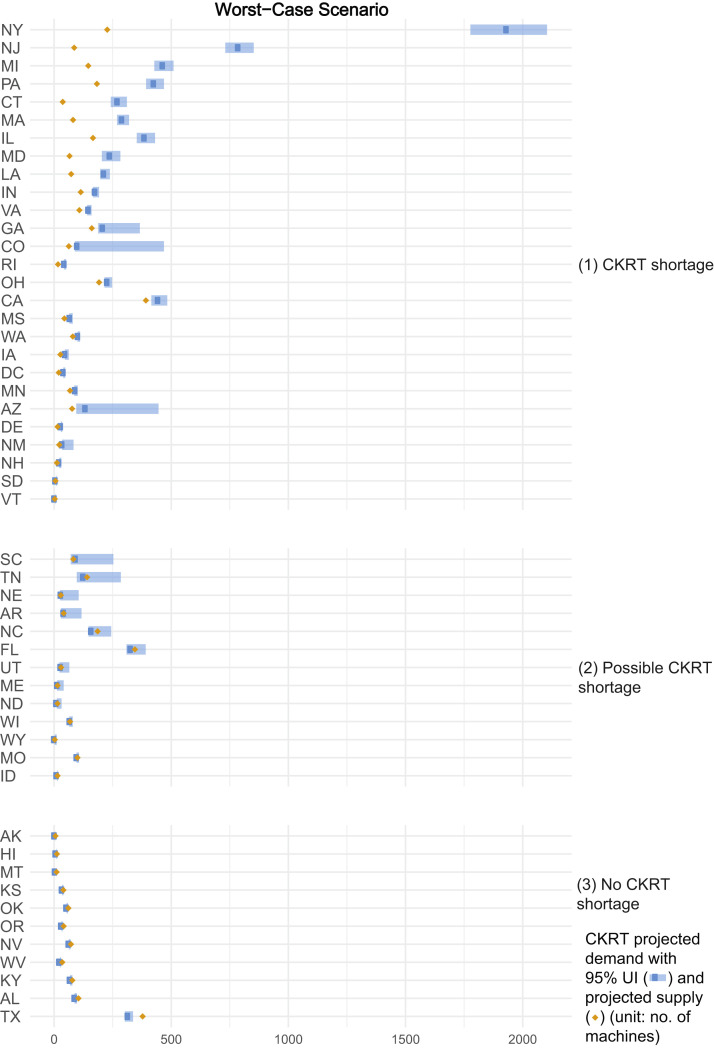
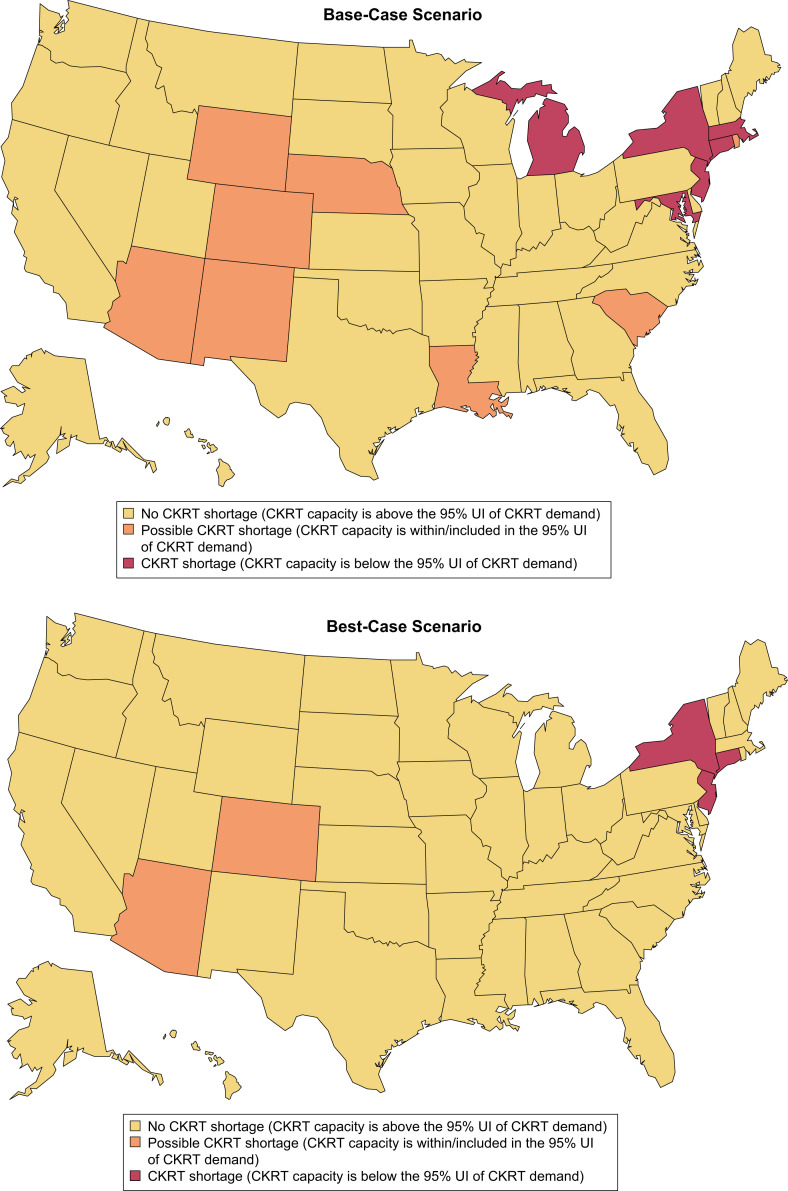
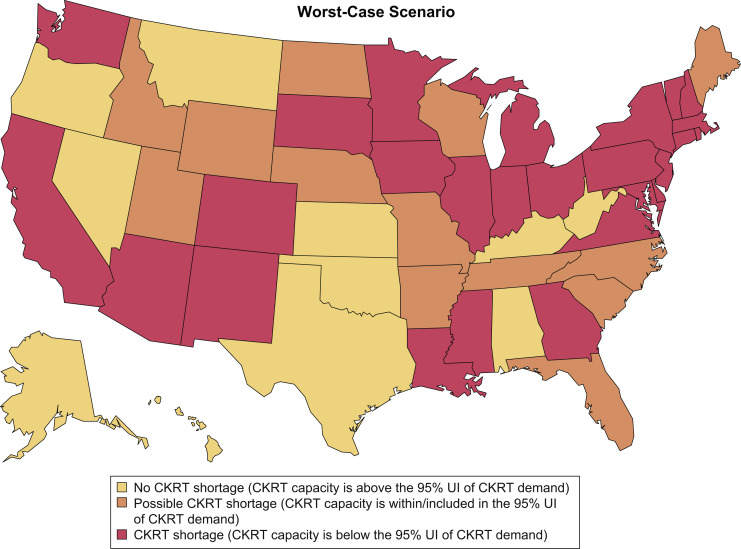
Results: Under base-case model assumptions, there was a nationwide CKRT capacity of 7,032 machines, an estimated shortage of 1,088 (95% uncertainty interval, 910-1,568) machines, and shortages in 6 states at peak resource use. In sensitivity analyses, varying assumptions around: (1) the number of pre-COVID-19 surplus CKRT machines available and (2) the incidence of acute kidney injury stage 3 requiring dialysis requiring CKRT among hospitalized patients with COVID-19 resulted in projected shortages in 3 to 8 states (933-1,282 machines) and 4 to 8 states (945-1,723 machines), respectively. In the best- and worst-case scenarios, there were shortages in 3 and 26 states (614 and 4,540 machines).
Limitations: Parameter estimates are influenced by assumptions made in the absence of published data for CKRT capacity and by the Institute for Health Metrics and Evaluation model's limitations.
Conclusions: Several US states are projected to encounter CKRT shortages during the COVID-19 pandemic. These findings, although based on limited data for CKRT demand and capacity, suggest there being value during health care crises such as the COVID-19 pandemic in establishing an inpatient kidney replacement therapy national registry and maintaining a national stockpile of CKRT equipment.
Keywords: Continuous renal replacement therapy (CRRT); acute care; acute kidney injury (AKI); acute kidney injury stage 3 requiring dialysis (AKI 3D); acute renal failure (ARF); continuous kidney replacement therapy (CKRT); coronavirus disease 2019 (COVID-19); mathematical model; pandemic; resource allocation; resource shortage; shortages.
Copyright © 2020 National Kidney Foundation, Inc. Published by Elsevier Inc. All rights reserved.
Figures
Similar articles
-
Ensuring Sustainability of Continuous Kidney Replacement Therapy in the Face of Extraordinary Demand: Lessons From the COVID-19 Pandemic.Am J Kidney Dis. 2020 Sep;76(3):392-400. doi: 10.1053/j.ajkd.2020.05.008. Epub 2020 Jun 4. Am J Kidney Dis. 2020. PMID: 32505811 Free PMC article.
-
Urgent Peritoneal Dialysis in Patients With COVID-19 and Acute Kidney Injury: A Single-Center Experience in a Time of Crisis in the United States.Am J Kidney Dis. 2020 Sep;76(3):401-406. doi: 10.1053/j.ajkd.2020.06.001. Epub 2020 Jun 11. Am J Kidney Dis. 2020. PMID: 32534129 Free PMC article.
-
Preparing for COVID-19-related Drug Shortages.Ann Am Thorac Soc. 2020 Aug;17(8):928-931. doi: 10.1513/AnnalsATS.202004-362VP. Ann Am Thorac Soc. 2020. PMID: 32492353 Free PMC article. No abstract available.
-
Acute Kidney Injury and Special Considerations during Renal Replacement Therapy in Children with Coronavirus Disease-19: Perspective from the Critical Care Nephrology Section of the European Society of Paediatric and Neonatal Intensive Care.Blood Purif. 2021;50(2):150-160. doi: 10.1159/000509677. Epub 2020 Jul 14. Blood Purif. 2021. PMID: 32663827 Free PMC article. Review.
-
[Multidisciplinary management of a typical case of acute kidney failure in the course of COVID-19 infection].G Ital Nefrol. 2020 Oct 5;37(5):2020-vol5. G Ital Nefrol. 2020. PMID: 33026202 Review. Italian.
Cited by
-
Incidence and Outcomes of Acute Kidney Injury in COVID-19: A Systematic Review.Blood Purif. 2022;51(3):199-212. doi: 10.1159/000514940. Epub 2021 Jun 15. Blood Purif. 2022. PMID: 34130296 Free PMC article.
-
Integration of sustained low-efficiency dialysis into extracorporeal membrane oxygenation circuit in critically ill COVID-19 patients: A feasibility study.Artif Organs. 2022 Sep;46(9):1847-1855. doi: 10.1111/aor.14277. Epub 2022 May 9. Artif Organs. 2022. PMID: 35490349 Free PMC article.
-
Pathophysiology and Clinical Manifestations of COVID-19-Related Acute Kidney Injury-The Current State of Knowledge and Future Perspectives.Int J Mol Sci. 2021 Jun 30;22(13):7082. doi: 10.3390/ijms22137082. Int J Mol Sci. 2021. PMID: 34209289 Free PMC article. Review.
-
COVID-19: The Kidneys Tell a Tale.Am J Kidney Dis. 2021 Feb;77(2):175-177. doi: 10.1053/j.ajkd.2020.11.001. Epub 2020 Dec 17. Am J Kidney Dis. 2021. PMID: 33342610 Free PMC article. No abstract available.
-
Meeting the Demand for Renal Replacement Therapy during the COVID-19 Pandemic: A Manufacturer's Perspective.Kidney360. 2020 Dec 29;2(2):350-354. doi: 10.34067/KID.0006192020. eCollection 2021 Feb 25. Kidney360. 2020. PMID: 35373015 Free PMC article. No abstract available.
References
-
- Center for Systems Science and Engineering Coronavirus COVID-19 global cases. https://gisanddata.maps.arcgis.com/apps/opsdashboard/index.html#/bda7594...
-
- Ranney M.L., Griffeth V., Jha A.K. Critical supply shortages - the need for ventilators and personal protective equipment during the COVID-19 pandemic. N Engl J Med. 2020;382(18):e41. - PubMed
MeSH terms
Grants and funding
LinkOut - more resources
Full Text Sources
